





Skyscanner Supercharges Ability to Turn Raw Data into Deep Understanding of Consumer Behaviour, Conversion Jumps 40%

3807
Of your peers have already read this article.
2:30 Minutes
The most insightful time you'll spend today!
Skyscanner is a leading global travel search company covering flights, hotels, and car hire around the world. Founded in 2003, the company helps over 40 million people each month find the best travel options across its portfolio of websites and mobile apps.
Skyscanner wanted to understand the anonymized behaviour of consumers on a more granular level than was possible via standard reports in the Google Analytics Premium web interface or even using the reporting APIs.
“These methods work well for high-level analysis and standard marketing reporting, but we were keen to dig deeper into the data to get more insight and further optimise our products,” explains Mark Shilton, Principal Analyst in the Skyscanner Data Team.
For example, the company wanted to create detailed cohorts to understand how users interacted with Skyscanner over time. Also, different teams in the business were keen to understand the performance of individual pieces of functionality that fell within their remit.
To do this, they needed to understand not just the overall conversion rate, but how users who interact with a given piece of functionality convert compared to those who do not. Skyscanner also wanted drill down into specific markets, devices types, and marketing channels.
Mapping a plan for deeper insights
Skyscanner opted to address all of these needs by integrating Google Analytics Premium with BigQuery. The integration has become the starting point for many detailed investigations across the business.
For example, analysts and engineers now run cohort analyses to understand how frequently users return to Skyscanner and which channels are most effective at which part of the customer journey.
“This type of analysis is allowing a much deeper understanding of our marketing activity and is informing our future strategy and spend,” Mark says.
He reveals that using BigQuery in conjunction with other tools such as Tableau and Python also helps Skyscanner execute analysis much more quickly and efficiently than before.
“While in the past it was tricky to get a fully unsampled report based on specific segments of users flowing directly from Google Analytics Premium into a Tableau dashboard, now it is simply a matter of writing the query, creating a connection in Tableau to automatically refresh the data daily, and publishing this dashboard to the rest of the company.”
Another key benefit of using a flexible combination of tools is the ability to keep an eye on costs.
“Where the aggregations and segments of data are required on a regular basis, we have to consider the potential cost of querying the entire BigQuery dataset multiple times for the same data,” Mark explains. “To minimise this, we use Python scripts to automate these aggregations into new, smaller tables that are much more cost efficient to query.”
Excellent visibility and a clear path ahead
Combining Google Analytics Premium with BigQuery has supercharged Skyscanner’s ability to turn raw data into deep understanding of consumer behaviour.
“We have been using BigQuery for various pieces of analysis, from one-off investigations to powering daily dashboards,” Mark affirms. “In all cases it has speeded up our workflow and enabled us to gain greater insight more quickly. In a fast moving internet economy, this is key. Instead of setting up and scheduling one or more unsampled API reports, analysts can now write a query against BigQuery and have results almost instantly.”
“BigQuery has also allowed us to more easily isolate the effects of marketing from the effects of site changes,” Mark says. “By writing queries that focus on the conversion rate from specific pages in the funnel, we can better segment our traffic. We can separate traffic from various sources, including: specific marketing campaigns, users who make it to specific parts of the funnel, or users who interact with new functionality. This greater understanding has played a key role in improving overall conversion rates on our websites, particularly on mobile where we’ve achieved conversion rate improvements of 30 to 40% on smartphone and tablet devices in the last six months.”
Looking to the future, Skyscanner’s next steps include exploring how this data can be used to segment, cluster, and classify users for machine learning analyses, which would not have been possible using standard reporting functionality.

3853
Of your peers have already listened to this podcast
25:30 Minutes
The most insightful time you'll spend today!
Cloud Dataprep: The Easiest Way to Cleanse Data
Skyscanner is a leading global travel search company covering flights, hotels, and car hire around the world. Founded in 2003, the company helps over 40 million people each month find the best travel options across its portfolio of websites and mobile apps.
Skyscanner wanted to understand the anonymized behaviour of consumers on a more granular level than was possible via standard reports in the Google Analytics Premium web interface or even using the reporting APIs.
“These methods work well for high-level analysis and standard marketing reporting, but we were keen to dig deeper into the data to get more insight and further optimise our products,” explains Mark Shilton, Principal Analyst in the Skyscanner Data Team.
For example, the company wanted to create detailed cohorts to understand how users interacted with Skyscanner over time. Also, different teams in the business were keen to understand the performance of individual pieces of functionality that fell within their remit.
To do this, they needed to understand not just the overall conversion rate, but how users who interact with a given piece of functionality convert compared to those who do not. Skyscanner also wanted drill down into specific markets, devices types, and marketing channels.
Mapping a plan for deeper insights
Skyscanner opted to address all of these needs by integrating Google Analytics Premium with BigQuery. The integration has become the starting point for many detailed investigations across the business.
For example, analysts and engineers now run cohort analyses to understand how frequently users return to Skyscanner and which channels are most effective at which part of the customer journey.
“This type of analysis is allowing a much deeper understanding of our marketing activity and is informing our future strategy and spend,” Mark says.
He reveals that using BigQuery in conjunction with other tools such as Tableau and Python also helps Skyscanner execute analysis much more quickly and efficiently than before.
“While in the past it was tricky to get a fully unsampled report based on specific segments of users flowing directly from Google Analytics Premium into a Tableau dashboard, now it is simply a matter of writing the query, creating a connection in Tableau to automatically refresh the data daily, and publishing this dashboard to the rest of the company.”
Another key benefit of using a flexible combination of tools is the ability to keep an eye on costs.
“Where the aggregations and segments of data are required on a regular basis, we have to consider the potential cost of querying the entire BigQuery dataset multiple times for the same data,” Mark explains. “To minimise this, we use Python scripts to automate these aggregations into new, smaller tables that are much more cost efficient to query.”
Excellent visibility and a clear path ahead
Combining Google Analytics Premium with BigQuery has supercharged Skyscanner’s ability to turn raw data into deep understanding of consumer behaviour.
“We have been using BigQuery for various pieces of analysis, from one-off investigations to powering daily dashboards,” Mark affirms. “In all cases it has speeded up our workflow and enabled us to gain greater insight more quickly. In a fast moving internet economy, this is key. Instead of setting up and scheduling one or more unsampled API reports, analysts can now write a query against BigQuery and have results almost instantly.”
“BigQuery has also allowed us to more easily isolate the effects of marketing from the effects of site changes,” Mark says. “By writing queries that focus on the conversion rate from specific pages in the funnel, we can better segment our traffic. We can separate traffic from various sources, including: specific marketing campaigns, users who make it to specific parts of the funnel, or users who interact with new functionality. This greater understanding has played a key role in improving overall conversion rates on our websites, particularly on mobile where we’ve achieved conversion rate improvements of 30 to 40% on smartphone and tablet devices in the last six months.”
Looking to the future, Skyscanner’s next steps include exploring how this data can be used to segment, cluster, and classify users for machine learning analyses, which would not have been possible using standard reporting functionality.
Analytics Hub for Secure Data Sharing and Analytics Unlocks True Data Value and Insights

6746
Of your peers have already read this article.
2:30 Minutes
The most insightful time you'll spend today!
Customers tell us that sharing and exchanging data with other organizations is a critical element of their analytics strategy, but it’s hamstrung by unreliable data and processes, and only getting harder with security threats and privacy regulations on the rise.
Furthermore, traditional data sharing techniques use batch data pipelines that are expensive to run, create late arriving data, and can break with any changes to the source data. They also create multiple copies of data, which brings unnecessary costs and can bypass data governance processes. These techniques do not offer features for data monetization, such as managing subscriptions and entitlements. Altogether, these challenges mean that organizations are unable to realize the full potential of transforming their business with shared data.
To address these limitations, we are introducing Analytics Hub, a new fully managed service, available in Q3, in preview, that helps you unlock the value of data sharing, leading to new insights and increased business value. With Analytics Hub you get:
- A rich data ecosystem by publishing and subscribing to analytics-ready datasets.
- Control and monitoring over how your data is being used, because data is shared in one place.
- A self-service way to access valuable and trusted data assets, including data provided by Google. For example, a unique dataset from Google Search Trends will be available, that you can query and combine with your own data.
- An easy way to monetize your data assets without the overhead of building and managing the infrastructure.
Built on a decade of cross-organizational sharing
While Analytics Hub is a new service, it builds on BigQuery, Google’s petabyte-scale, serverless cloud data warehouse. BigQuery’s unique architecture provides separation between compute and storage, enabling data publishers to share data with as many subscribers as you want without having to make multiple copies of your data. With BigQuery, there are no servers to deploy or manage, which means that data consumers get immediate value from shared data. Data can be provided and consumed in real-time using the streaming capabilities of BigQuery and you can leverage the built in machine learning, geospatial, and natural language capabilities of BigQuery or take advantage of the native business intelligence support with tools like Looker, Google Sheets, and Data Studio.
BigQuery has had cross-organizational, in-place data sharing capabilities since it was introduced in 2010. We took a look at usage metrics in BigQuery and found that over a 7 day period in April, we had over 3,000 different organizations sharing over 200 petabytes of data. These numbers don’t include data sharing between departments within the same organization.
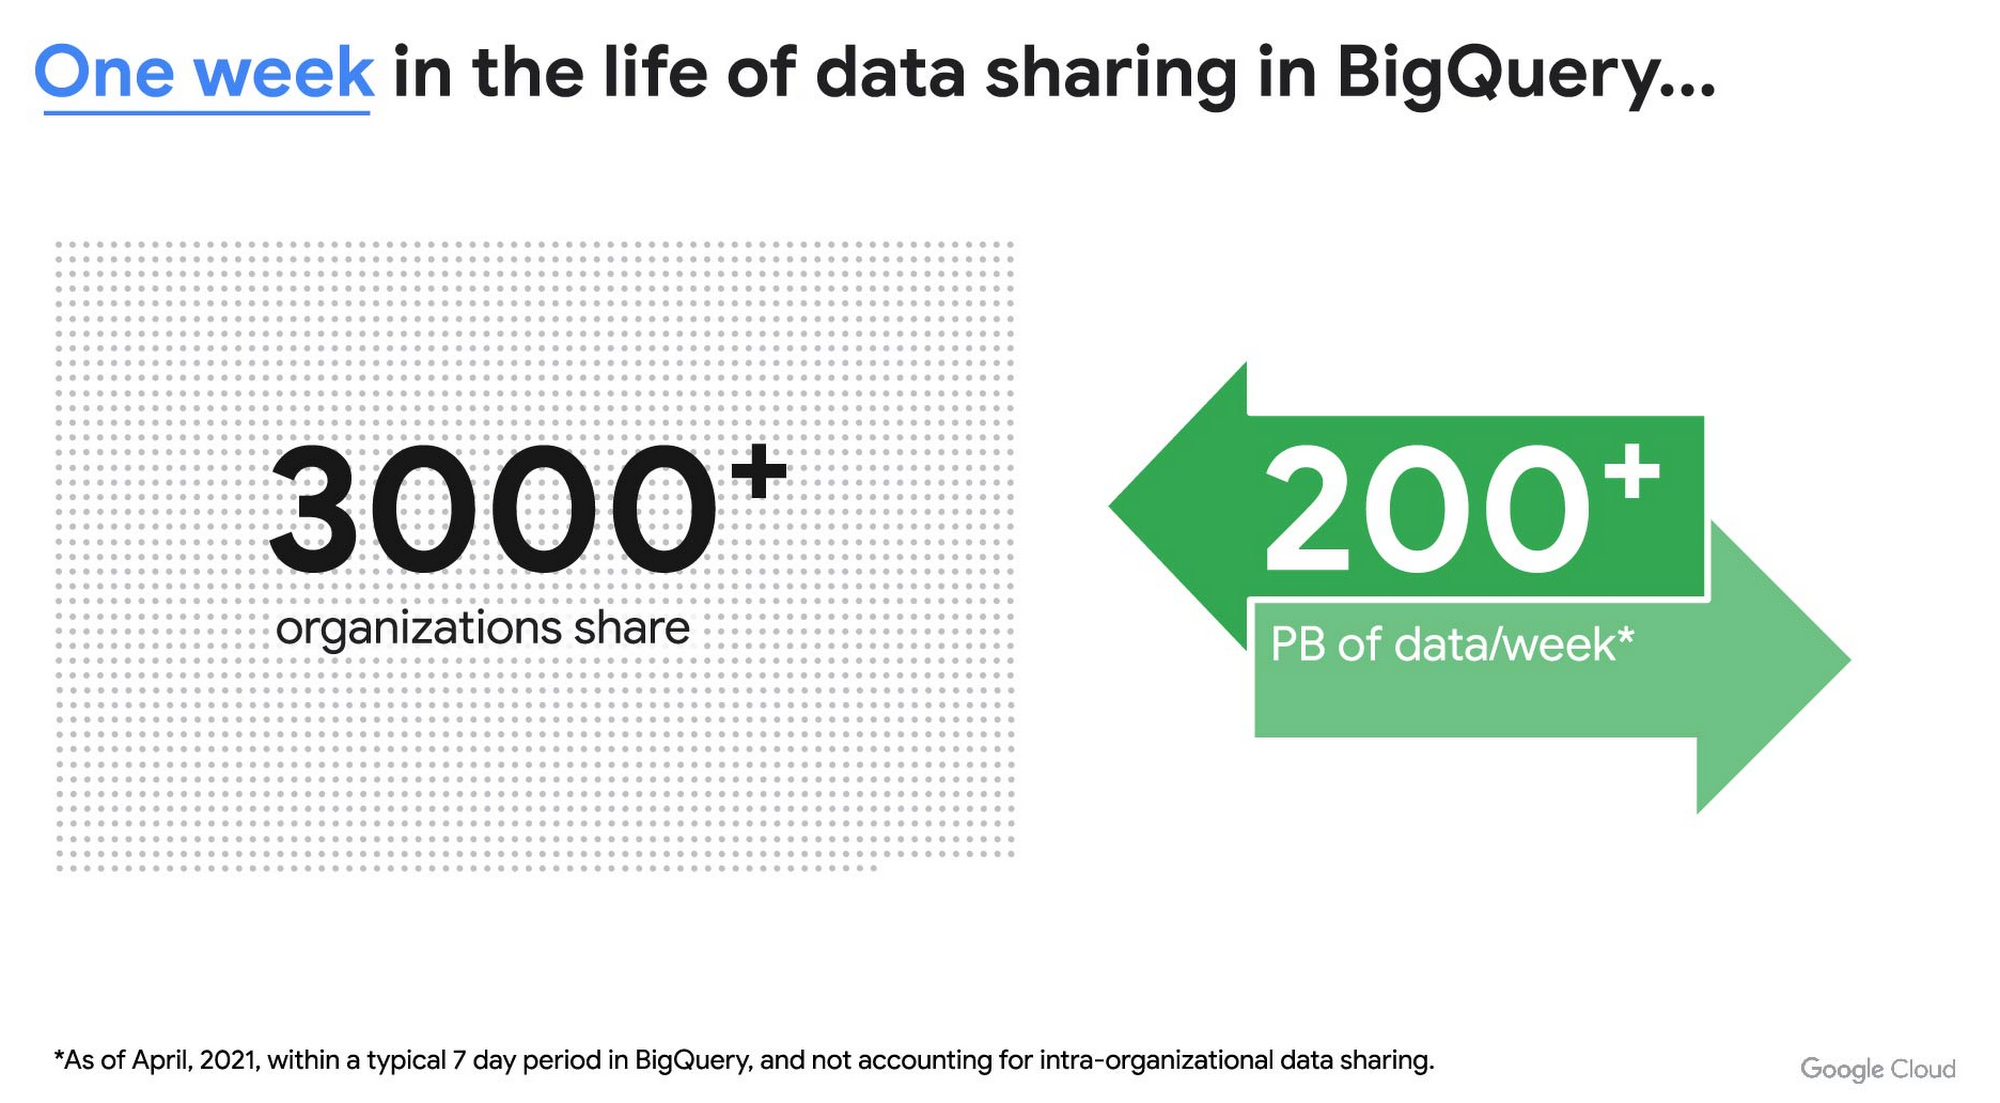
As you can see, data sharing in BigQuery is already popular. But we want to make it easier and even more scalable.
Raising the bar on data sharing
To make data sharing easier and more scalable in BigQuery, Analytics Hub introduces the concepts of shared datasets and exchanges. As a data publisher, you create shared datasets that contain the views of data that you want to deliver to your subscribers. Next, you create exchanges, which are used to organize and secure shared datasets. By default, exchanges are completely private, which means that only the users and groups that you give access to can view or subscribe to the data. You can also create internal exchanges or leverage public exchanges provided by Google. Finally, you publish shared datasets into an exchange to make them available to subscribers.
Data subscribers search through the datasets that are available across all exchanges for which they have access and subscribe to relevant datasets. This creates a linked dataset in their project that they can query and join with their own data. Subscribers pay for the queries that they run against the data while the publisher pays for the storage of the data. Data providers can add new data, new tables, or new columns to the shared dataset and these will be immediately available to subscribers. In addition, the publisher can track subscribers, disable subscriptions, and see aggregated usage information for the shared data.
Analytics Hub makes it easy for you to publish, discover, and subscribe to valuable datasets that you can combine with your own data to derive unique insights. Here are some types of data that will be available through Analytics Hub:
- Public datasets: Easy access to the existing repository of over 200 public datasets, including data about weather and climate, cryptocurrency, healthcare and life sciences, and transportation.
- Google datasets: Unique, freely-available datasets from Google. One example of this is the COVID-19 community mobility dataset. Another example is the forthcoming Google Trends dataset, which will provide the top 25 search terms and top 25 rising search terms over a 5 year window in 210 distinct locations in the US. Trends data can be used by everyone in the organization to gain insights into what customers care about.
- Commercial (paid for) datasets: We are working with leading commercial data providers to bring their data products to Analytics Hub. If you are interested in delivering your data via Analytics Hub, we’re also introducing Data Gravity, an initiative that provides storage benefits and new distribution paths for data published through Analytics Hub.
- Internal datasets: We know that data sharing can be challenging in larger organizations. Analytics Hub can be used for internal data, for example, to share standardized customer demographics with your sales engineering and data science teams.
Customers and partners using Analytics Hub

“Google Search Trends data has always been an important tool for our WPP agency data teams. At WPP we believe that data variety is a superpower which is why we are excited to use the new Trends dataset availability within BigQuery, plus the launch of Analytics Hub. The best creativity in the world is informed by data insights, and influenced by what people search for, so the operational efficiencies we’ll gain via the Analytics Hub and the insights we can drive with Trends data are just phenomenal.”
—Di Mayze Global Head of Data and AI, WPP

“Equifax Ignite is our shared data analytics environment within our Equifax data fabric. We are excited to partner with Google to leverage Analytics Hub and BigQuery to deliver data to over 400 statisticians and data modelers as well as securely sharing data with our partner financial institutions.”
—Kumar Menon, SVP Data Fabric and Decision Science, Equifax

“The flow of data and insights between our teams at Deloitte and our clients is paramount for building truly transformational data cultures. With its purpose-built architecture for secure data exchanges and sharing analytics resources, Google Cloud’s Analytics Hub can help provide significant operational efficiencies for how Deloitte teams support our clients’ data-driven initiatives within their industry ecosystems. It will also help minimize the worries about scale, privacy and security, or the administrative burden associated with each.”
—Navin Warerkar, Managing Director, Deloitte Consulting LLP, and US Google Cloud Data & Analytics GTM Lead

“Crux Informatics is proud to partner with Google to support the launch of Analytics Hub, removing friction for those who need access to analytics-ready data. With thousands of datasets from over 140 sources, Crux Informatics will accelerate access to data on Analytics Hub and together provide a more efficient and cost effective solution to deliver datasets in Google Cloud’s ecosystem.”
—Will Freiberg, CEO, Crux Informatics
Next steps for Analytics Hub
This is just the beginning for Analytics Hub. As we get to preview and general availability, we will be adding additional capabilities, including workflows for publishing and subscribing, publishing analytics assets (Looker Blocks, Data Studio reports, Connected Google Sheets) along with the shared data, the ability for data publishers to specify query restrictions on the usage of their data, and making it easy for data publishers to create sandbox environments for subscribers to work with their data, even if they are not yet on Google Cloud. We will provide features in Analytics Hub for monetization of data, including managing subscriptions, data entitlements, and billing.
Please sign up for the preview, which is scheduled to be available in the third quarter of 2021. In the meantime, you can learn more about BigQuery and how to leverage its built-in data sharing capabilities. Please go to g.co/cloud/analytics-hub to register your interest in Analytics Hub.
4820
Of your peers have already watched this video.
2:30 Minutes
The most insightful time you'll spend today!
Haaretz on Google Cloud Guarantees Faster, Reliable & Responsive Services to its Audience
Israeli centenarian newspaper, Haaretz relied on on-prem infrastructure to serve readers digitally. As the need for scalability, security and business intelligence grew alongside their readership, Haaretz was looking for more than just a cloud-based solution to replace their infrastructure. Inon Gershovitz, CTO, Haaretz takes us through the journey of recreating digital news experience, serving growing reader traffic and keeping up the editorial standards with Google Cloud.
Watch the video to hear from Haaretz’ leaders on delivering personalized content to readers with Google Cloud solutions!
Report on API-led Digital Transformations in 2020 and the Future

6805
Of your peers have already read this article.
1:30 Minutes
The most insightful time you'll spend today!
In 2020, many businesses across industries turned their focus and investments towards digital strategies. APIs being an integral part of every organization’s digital disruption, will grow in relevance throughout 2021. Read the report to gain more insights on driving API-led digital transformations and in-depth analysis of Google Cloud’s Apigee API Management Platform usage data, case studies and third-party surveys conducted with tech leaders.
Home Depot Leverages Google Cloud’s BigQuery and DataFlow to Break Data Silos and Craft Personalized CX

5004
Of your peers have already read this article.
4:00 Minutes
The most insightful time you'll spend today!
The Home Depot, Inc., is the world’s largest home improvement retailer with annual revenue of over $151B. Delighting our customers—whether do-it-yourselfers or professionals—by providing the home improvement products, services, and equipment rentals they need, when they need them, is key to our success.
We operate more than 2,300 stores throughout the United States, Canada, and Mexico. We also have a substantial online presence through HomeDepot.com, which is one of the largest e-commerce platforms in the world in terms of revenue. The site has experienced significant growth both in traffic and revenue since the onset of Covid-19.
Because many of our customers shop at both our brick-and-mortar stores and online, we’ve embarked on a multi-year strategy to offer a shopping experience that seamlessly bridges the physical and digital worlds. To maximize value for the increasing number of online shoppers, we’ve shifted our focus from event marketing to personalized marketing, as we found it to be far more effective in improving the customer experience throughout the sales journey. This led to changing our approach to marketing content, email communications, product recommendations, and the overall website experience.
Challenge: launching a modern marketing strategy using legacy IT
For personalized marketing to be successful, we had to improve our ability to recognize a customer at the point of transaction so we could—among other things—suspend irrelevant and unnecessary advertising. Most of us have experienced the annoyance of receiving ads for something we’ve already purchased, which can degrade our perception of the brand itself. While many online retailers can identify 100% of their customer transactions due to the rich information captured during checkout, most of our transactions flow through physical stores, making this a more difficult problem to solve.
Our old legacy IT system, which ran in an on-premises data center and leveraged Hadoop, also challenged us since maintaining both the hardware and software stack required significant resources. When that system was built, personalized marketing was not a priority, so it took several days to process customer transaction data and several weeks to roll out any system changes. Further, managing and maintaining the large Hadoop cluster base presented its own set of issues in terms of quality control and reliability, as did keeping up with open-source community updates for each data processing layer.
Adopting a hybrid approach
As we worked through the challenges of our legacy system, we started thinking about what we wanted our future system to look like. Like many companies, we began with a “build vs. buy” analysis. We looked at several products on the market and determined that while each of them had their strengths, none was able to offer the complete set of features we needed.
Our project team didn’t think it made sense to build a solution from scratch, nor did we have access to the third-party data we needed. After much consideration, we decided to adopt a solution that combined a complete rewrite of the legacy system with the support of a partner to help with the customer transaction matching process.
Building the foundation on Google Cloud
We chose Google Cloud’s data platform, specifically BigQuery, Dataflow, DataProc, Cloud Storage, and Cloud Composer. Google Cloud platform empowered us to break down data silos and unify each stage of the data lifecycle from ingestion, storage, and processing to analysis and insights. Google Cloud offered best-in-class integration with open-source standards and provided the portability and extensibility we needed to make our hybrid solution work well. The open standards of BigQuery’s BQ Storage API allowed us to leverage fast BQ storage layers to be utilized with other compute platforms, e.g., DataProc.
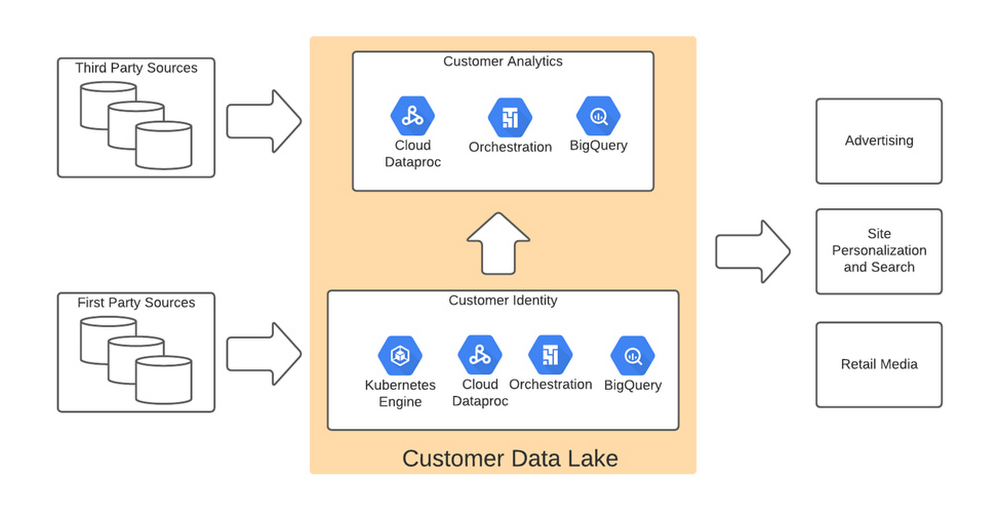
We used BigQuery combined with Dataflow to integrate our first- and third-party data into an enterprise data and analytics data lake architecture. The system then combined previously siloed data and used BigQuery ML to create complete customer profiles spanning the entire shopping experience, both in-store and online.
Understanding the customer journey with the help of Dataflow and BigQuery
The process of developing customer profiles involves aggregating a number of first- and third-party data sources to create a 360-degree view of the customer based on both their history and intent. It starts with creating a single historical customer profile through data aggregation, deduplication, and enrichment. We used several vendors to help with customer resolution and NCOA (Change of Address) updates, which allows the profile to be house-holded and transactions to be properly reconciled to both the individual and the household. This output is then matched to different customer signals to help create an understanding of where the customer is in their journey—and how we can help.
The initial implementation used Google Dataflow, Google’s streaming analytics solution, to load data from Google Cloud Storage into BigQuery and perform all necessary transformations. The Dataflow process was converted into BQML (BigQuery Machine Learning) since this significantly reduced costs and increased visibility into data jobs. We used Google Cloud Composer, a fully managed workflow orchestration service, to help orchestrate all data operations and DataProc and Google Kubernetes Engine to enable special case data integration so we could quickly pivot and test new campaigns. The architecture diagram below shows the overall structure of our solution.
Taking full advantage of cloud-native technology
In our initial migration to Google Cloud, we moved most of our legacy processes in their original form. However, we quickly learned that this approach didn’t take full advantage of the cloud-native and more improved features Google Cloud offered such as auto scaling of resources, flexibility to decouple storage from the compute layer, and a wide variety of options to choose the best tool for the job. We refactored our Hadoop-based data pipelines written in Java-based Map Reduce and our Pig Latin jobs to Dataflow and BigQuery jobs. This dramatically reduced processing time and made our data pipeline code concise and efficient.
Previously, our legacy system processes ran longer than intended, and data was not used efficiently. Optimizing our code to be cloud-native and leveraging all the capabilities of Google Cloud services resulted in reduced run times. We decreased our data processing window from 3 days to 24 hours, improved resource usage by dramatically reducing the amount of compute we used to possess this data, and built a more streamlined system. This in turn reduced cloud costs and provided better insight. For example, DataFlow offers powerful native features to monitor data pipelines, enabling us to be more agile.
Leveraging the flexibility and speed of the cloud to improve outcomes
Today, using a continuous integration/continuous delivery (CI/CD) approach, we can deploy multiple system changes each week to further improve our ability to recognize in-store transactions. Leveraging the combined capabilities of various Google Cloud systems—BigQuery, DataFlow, Cloud Composer, Dataproc, and Cloud Storage–we drastically increased our ability to recognize transactions and can now connect over 75% of all transactions to an existing household. Further, the flexible Google Cloud environment coupled with our cloud-native application makes our team more nimble and better able to respond to emerging problems or new opportunities.
Increased speed has led to better outcomes in our ability to match transactions across all sales channels to a customer and thereby improve their experience. Before moving to Google Cloud, it took 48 to 72 hours to match customers to their transactions, but now we can do it in less than 24 hours.
Making marketing more personal—and more efficient
The ability to quickly match customers to transactions has huge implications for our downstream marketing efforts in terms of both cost and effectiveness. By knowing what a customer has purchased, we can turn off ads for products they’ve already bought or offer ads for things that support what they’ve bought recently. This helps us use our marketing dollars much more efficiently and offer an improved customer experience.
Additionally, we can now apply the analytical models developed using BQML and Vertex AI to sort customers into audiences. This allows us to more quickly identify a customer’s current project, such as remodeling a kitchen or finishing a basement, and then personalize their journey by offering them information on products and services that matter most at a given point through our various marketing channels. This provides customers with a more relevant and customized shopping journey that mirrors their individual needs.
Protecting a customer’s privacy
With this ability to better understand our customers, we also have the responsibility to ensure we have good oversight and maintain their data privacy. Google’s cloud solutions provide us the security needed to help protect our customers’ data, while also being flexible enough to allow us to support state and federal regulations, like the California Customer Privacy Act. This way we can provide a customer the personalized experience they desire without having to fear how their data is being used.
With flexible Google Cloud technology in place, The Home Depot is well positioned to compete in an industry where customers have many choices. By putting our customers’ needs first, we can stay top of mind whenever the next project comes up.
More Relevant Stories for Your Company

Vector Search: The Tech Powering Billions of Search Results for Google Users
Recently, Google Cloud partner Groovenauts, Inc. published a live demo of MatchIt Fast. As the demo shows, you can find images and text similar to a selected sample from a collection of millions in a matter of milliseconds: Image similarity search with MatchIt Fast Give it a try — and either select a preset

AirAsia Leverages Google Cloud to Enhance Pricing, Revenue, and Customer Experience
With Google Cloud, AirAsia is now a “data first” business that can capture, analyze, and report on rising volumes of data to address complex problems and increase revenue streams. The airline is also using AI-powered chatbots to streamline internal operations and provide a faster, more efficient service. Become a digital




Google had Enough of Flooding in India. Here’s What It Did About It
Over the last century, floods have become the most common and deadly natural disaster on the planet. Many countries currently lack effective early warning systems and alerts. Today, 20 percent of flood fatalities occur in India. To help, Google sent a team to study the Ghaghara River, near Patna. “In

Google Cloud Platform Gives Us 5x the Processing Power to Analyze Physician Performance at 75% Lower Cost
Patients about to undergo a healthcare procedure understandably want the best medical professionals they can get. But how can they know which doctors have had the most experience and the best outcomes with that particular procedure? How can they make an informed decision about which doctor to select when the
