





Google and AI Researchers Work towards Building Data-centric AI

6077
Of your peers have already read this article.
1:30 Minutes
The most insightful time you'll spend today!
AI researchers and engineers need better data to enable better AI solutions. The quality of an AI solution is determined by both the learning algorithm (such as a deep-neural network model) and the datasets used to train and evaluate that algorithm. Historically, AI research has focused much more on algorithms than datasets, despite their vital importance. As a result, many algorithms are freely available as starting points, but many important problems lack large, high-quality open datasets. Further, creating new datasets is expensive and error-prone.
Recently, the data-centric AI movement has emerged, which aims to develop new methodologies and tools for constructing better datasets to fix this problem. Conferences, workshops, challenges, and platforms are being launched to support improving data quality and to foster data excellence. Thought leaders such as Andrew Ng at Landing.AI and Chris Re at Stanford University are encouraging AI developers to focus more on iterative data engineering than they do tuning their learning algorithms. Our CHI-best-paper-award-winning paper, “Everyone wants to do the model work, not the data work” highlighted the significance of data quality in the practice of ML.
At Google, we are excited to contribute to data-centric AI. Today, Google Cloud is adding a new high value dataset to the Public Dataset Program, and Google researchers are announcing DataPerf, a new multi-organizational effort to develop benchmarks for data quality and data centric algorithms.
Google Cloud is committed to helping users improve their data quality, starting with supporting better public data. The Public Datasets program provides high quality datasets pre-configured on GCP for easy access. Google Cloud is adding a new high-value dataset developed by the MLCommons™ Association (which Google co-founded) to the Public Datasets program: The Multilingual Spoken Words Corpus: a rich audio speech dataset with more than 340,000 keywords in 50 languages with upwards of 23.4 million examples.
This new public dataset is aligned with the MLCommons Association vision for “open” datasets – accessible by all – that are “living” – continually being improved to raise quality and increase representation and diversity.
Google researchers, in collaboration with multiple organizations, are announcing the DataPerf effort at the NeurIPS Data-Centric AI workshop today, to develop benchmarks to improve data quality. Much like the the MLPerf™ benchmarking effort which is now the industry standard for machine learning hardware/software speed, DataPerf brings together the originators of prior efforts including: CATS4ML, Data-Centric AI Competition, DCBench, Dynabench, and the MLPerf benchmarks to define clear metrics that catalyze rapid innovation. DataPerf will measure the utility of training and test data for common problems, and algorithms for working with datasets such as: selecting core sets, correcting errors, identifying under-optimized data slices, and valuing datasets prior to labeling.
Together, supporting open, living datasets for core ML tasks, and the development of benchmarks to direct the rapid evolution of those datasets will empower the researchers and engineers who use Google Cloud to do even more amazing things – and we can’t wait to see what they create!
Acknowledgements: In collaboration with Lora Aroyo and Praveen Paritosh.
Partnering with Google Cloud is the Key Behind Recent Healthcare Innovations

8828
Of your peers have already read this article.
2:00 Minutes
The most insightful time you'll spend today!
It’s simply amazing to witness how some of our systems integrators employ Google Cloud solutions to drive innovation in ways we at Google may never have considered—especially in healthcare. According to analyst firm MarketsandMarkets, the market for the Cloud in healthcare is projected to grow 43% between 2020 and 2025 to nearly $65 billion, fueled by the need for better technology infrastructures and faster digital transformation.
Healthcare and life sciences communities are looking to Google Cloud and its Service engagement model partners to improve collaboration and activate the power of medical data. These transformations deliver robust data analytics and bring a much deeper perspective into health epidemics like COVID-19 to help save lives.
In the healthcare and life sciences industry, our Google Cloud partners and customers provide constant energy and inspiration–and are the magic in some key healthcare innovations globally.
Let me show you how they are solving real-world business challenges.
Improving collaboration in Healthcare
Cloudbakers and Comanche County Memorial Hospital transitioned 2,000 employees to Google Workspace to improve collaboration, reduce costs, and increase security. By implementing a system that requires less maintenance while enabling mobile access to data and true collaboration, Comanche County Memorial Hospital saves $175,000 annually on licenses and helps medical professionals spend more time with patients.
“We chose Google Workspace because it cost a quarter of what we were paying previously, offers the kind of modern features that healthcare facilities need, and gave us data security and peace of mind.” —James Wellman, CIO, Comanche County Memorial Hospital
Accessing previously locked down medical data
Google Cloud and Quantiphi supported advances in cloud-based machine learning services to reduce infrastructure costs, unlock new paths of treatment, and dramatically reduce the amount of time it takes to evaluate scanned imagery following a stroke. John Hopkins University BIOS Division has been working on medical imaging to accelerate insights from scans on approximately 500 patients from 2,500 hours to 90 minutes, and lead to more accurate decision-making for brain injury patients that will ultimately improve medical outcomes.
“We’ve aligned closely with the goal of showing that a cloud-based, AI-driven approach is robust and that it can be performed while protecting personal PHI. In terms of costs, the cloud has definitely reduced some of the traditional financial demands of our research.” —Daniel F. Hanley, Jr., M.D., Director, Johns Hopkins University BIOS Division
Improving data access with the flexibility of Google Cloud
With the help of MediaAgility, TRIARQ migrated to Google Cloud to modernize their platform, build new applications, and expand their global footprint. With BigQuery, TRIARQ can now consolidate all transactional data, past and present, into a single location to report on specific insights and predict future data from e-prescriptions to complex revenue-cycle data and value-base analysis.
“The future of this industry will need to be a global one, and we can no longer be stuck in legacy systems if we want to survive. Having a team that is passionate about supporting us in this journey is definitely a plus point.”—Yaw Kwakye, Co-founder and Chief Architect, TRIARQ
Increasing visibility to COVID-19 outbreaks for actionable insights
As part of its response to the COVID-19 pandemic, HCA Healthcare chose to work with Google Cloud and SADA to create a national portal that increases visibility into outbreaks in 3,100 counties across the country in just 8 weeks. Now, the portal generates 30,000 new analytical views each day that can help inform private and public sector decision making for reopenings, closures, hot spots, and many other population health management activities.
“This project required deep knowledge of AI, and consumer-facing platforms, as well as healthcare. Google brought together the ideal combination of product, people, and partners. Google Cloud’s healthcare-specific products along with SADA’s expertise in the healthcare IT space made this partnership the perfect choice to move quickly and intelligently.”—Dr. Edmund Jackson, Chief Data Officer, HCA Healthcare
We’re committed to building the technology, resources, and services through Partner Advantage to help our partners address this opportunity. Looking for a solution focused partner in your region who has achieved Expertise and/or Specialization in your industry? Search our Global Partner Directory. Not yet a Google Cloud partner? Visit Partner Advantage and learn how to become one today!
4348
Of your peers have already watched this video.
7:00 Minutes
The most insightful time you'll spend today!
Baking Gets Sweeter: Build ML Models that Help Predict the Best Recipe!
Baking recipes and ML models have one thing in common—they follow a pattern. Machine Learning is all about finding pattern in data sets, you can predict what you are baking based on the core ingredients and their respective amounts! Bread, cake or cookies, watch the video to make you make your baking experiences and learning with ML sweeter.
AutoML Tables, a no-code Google Cloud tool for ML models analyzes data from the databases and spreadsheets to help creates an automatic stats and dashboard with lists of ingredients and their values to predict a new recipe. Watch more episodes from Making with Machine Learning.
ActivStat: Enhancing Live Sports Broadcast with Real-time Stats and Metrics

5090
Of your peers have already read this article.
2:00 Minutes
The most insightful time you'll spend today!
Millions of people annually view esports, as top players and teams compete in thrilling, fast-paced tests of reflexes, strategy, and teamwork. Fans are a diverse group, sharing a passion for action. A new, revolutionary project we’re working on with Call of Duty League just made that action a lot better.
ActivStat brings fans, players, and commentators the power of competitive statistics in real-time—stats that matter not only to the game at hand, but also for a full roster of competitors globally. Using ActivStat, live broadcasts will soon be enhanced with more depth and color-of-play while they’re happening, building excitement and adding to the overall experience.
Technically, ActivStat is an entirely new capability for esports. It’s a constantly updating catalog of statistics that is sourced, analyzed, updated, and delivered in an easy-to-consume way across global-scale computing systems, with a latency of milliseconds or seconds, rather than minutes or hours. By comparison, many of these stats today are available to fans after a day or more of processing.
Call of Duty League plans to begin rolling out ActivStat during the 2021 season. The initial rollout will include critical information like player and team standings and winning ratios across multiple aspects of virtual combat—including ultimately what these numbers mean for rankings. ActivStats are delivered both in raw statistics and via visualizations and graphics, providing commentators with fast access to the types of insights fans crave.
For engineers at both companies, building the service has been an epic success all its own. Due to a sponsorship with Call of Duty signed last February, our dedicated game engineering team quickly innovated a new solution incorporating high-speed networking, data pipelines from multiple cloud sources, and data warehousing to create a user-friendly dashboard. Real data was flowing into commentator dashboards by April.
Esports are more complex to cover in many ways than regular sports. Instead of a well-defined physical playing field (often a simple rectangular space), multiplayer games involve complex and sprawling virtual environments that can be the size of a large campus or airport with multiple levels and hidden locations.
Gameplay between competitors happens across many of these locations simultaneously. In addition, competitors also each choose their own configurations of equipment, known as “loadouts,” which can dramatically affect gameplay and strategy. All of this additional complexity in online gaming involves data that needs to be captured, analyzed, and communicated to the fans in insightful ways.
Two Google Cloud technology capabilities play central roles in the operations of ActivStat. BigQuery—a planet-scale data warehouse that can store and query petabytes of information in real time—is the foundation of the ActivStat platform for gathering and summarizing millisecond-level statistics. Looker, an intuitive analytic dashboard, surfaces those insights to commentators in an easy-to-use, real-time dashboard that enables the commentators to speak to compelling insights and statistics in sync with the gameplay as it is happening in the live broadcast.
While the initial release of ActivStat for this season of Call of Duty League provides compelling and powerful capabilities, it’s only the beginning of this Call of Duty League-Google Cloud co-innovation partnership. Our future vision is mapping gameplay hotspots on the field, and predicting where to place cameras with machine learning as the match evolves–enabling broadcast producers to build excitement for fans by always being in the middle of the best action. Call of Duty League and Google will also look to drive statistics and metrics directly into the broadcast feed.
The implications of the real-time statistical capabilities of ActivStat go beyond gaming and esports. Historically, gaming has been at the leading edge of what computer processing, computer graphics, wide-area networking, data analysis, and insight can do. The real-time data ingestion and output used in ActivStat could one day be useful powering live broadcasts in other types of sporting events, as well as blending live video feeds and data to support use cases in media & entertainment, healthcare, finance, manufacturing, and other verticals. We’re excited about the potential for this bold new solution and partnership between Call of Duty League and Google in esports and beyond.
To learn more about Call of Duty League-Google Cloud partnership, visit our press release.
How to Enhance Incremental Pipeline Performance while Ingesting Data into BigQuery

6316
Of your peers have already read this article.
3:00 Minutes
The most insightful time you'll spend today!
When you build a data warehouse, the important question is how to ingest data from the source system to the data warehouse. If the table is small you can fully reload a table on a regular basis, however, if the table is large a common technique is to perform incremental table updates. This post demonstrates how you can enhance incremental pipeline performance when you ingest data into BigQuery.
Setting up a standard incremental data ingestion pipeline
We will use the below example to illustrate a common ingestion pipeline that incrementally updates a data warehouse table. Let’s say that you ingest data into BigQuery from a large and frequently updated table in the source system, and you have Staging and Reporting areas (datasets) in BigQuery.

The Reporting area in BigQuery stores the most recent, full data that has been ingested from the source system tables. Usually you create the base table as a full snapshot of the source system table. In our running example, we use BigQuery public data as the source system and create reporting.base_table as shown below. In our example each row is identified by a unique key which consists of two columns: block_hash and log_index.
CREATE TABLE reporting.base_table --156 GB processedPARTITION BY TIMESTAMP_TRUNC(block_timestamp, DAY) ASSELECT log_index, data, topics, block_timestamp, block_hashFROM bigquery-public-data.crypto_ethereum.logsWHERE block_timestamp BETWEEN TIMESTAMP '2020-01-01' AND TIMESTAMP '2020-11-30';
In data warehouses it is common to partition a large base table by a datetime column that has a business meaning. For example, it may be a transaction timestamp, or datetime when some business event happened, etc. The idea is that data analysts who use the data warehouse usually need to analyze only some range of dates and rarely need the full data. In our example, we partition the base table by block_timestamp which comes from the source system.
After ingesting the initial snapshot you need to capture changes that happen in the source system table and update the reporting base table accordingly. This is when the Staging area comes into the picture. The staging table will contain captured data changes that you will merge into the base table. Let’s say that in our source system on a regular basis we have a set of new rows and also some updated records. In our example we mock the staging data as follows: first, we create new data, than we mock the updated records:
CREATE TABLE staging.load_delta AS --5 GB processedSELECT log_index, data, topics, block_timestamp, block_hashFROM bigquery-public-data.crypto_ethereum.logsWHERE block_timestamp BETWEEN TIMESTAMP '2020-12-01' AND TIMESTAMP '2020-12-07';INSERT INTO staging.load_delta --2 GB processedSELECT log_index, CONCAT(data, RAND()), topics, block_timestamp, block_hashFROM bigquery-public-data.crypto_ethereum.logs TABLESAMPLE SYSTEM (5 PERCENT)WHERE block_timestamp BETWEEN TIMESTAMP '2020-10-01' AND TIMESTAMP '2020-11-30';
Next, the pipeline merges the staging data into the base table. It joins two tables by unique key and than updates the changed value or inserts a new row
MERGE INTO reporting.base_table T --161 GB processedUSING staging.load_delta SON T.block_hash = S.block_hashAND T.log_index = S.log_indexWHEN MATCHED THEN UPDATE SETT.data = S.dataWHEN NOT MATCHED THEN INSERT (log_index, data, topics, block_timestamp, block_hash)VALUES (log_index, data, topics, block_timestamp, block_hash);
It is often the case that the staging table contains keys from various partitions but the number of those partitions are relatively small. It holds, for instance, because in the source system the recently added data may get changed due to some initial errors or ongoing processes but older records are rarely updated. However, when the above MERGE gets executed, BigQuery scans all partitions in the base table and processes 161 GB of data. You might add additional join condition on block_timestamp:
MERGE INTO reporting.base_table T --161 GB processedUSING staging.load_delta SON T.block_hash = S.block_hashAND T.log_index = S.log_indexAND T.block_timestamp = S.block_timestampWHEN MATCHED THEN UPDATE SETT.data = S.dataWHEN NOT MATCHED THEN INSERT (log_index, data, topics, block_timestamp, block_hash)VALUES (log_index, data, topics, block_timestamp, block_hash);
But BigQuery would still scan all partitions in the base table because condition T.block_timestamp = S.block_timestamp is a dynamic predicate and BigQuery doesn’t automatically push such predicates down from one table to another in MERGE.
Can you improve the MERGE efficiency by making it scan less data? The answer is Yes.
As described in the MERGE documentation, pruning conditions may be located in a subquery filter, a merge_condition filter, or a search_condition filter. In this post we show how you can leverage the first two. The main idea is to turn a dynamic predicate into a static predicate.
Steps to enhance your ingestion pipeline
The initial step is to compute the range of partitions that will be updated during the MERGE and store it in a variable. As was mentioned above, in data ingestion pipelines, staging tables are usually small so the cost of the computation is relatively low.
DECLARE src_range STRUCT<date_min TIMESTAMP, date_max TIMESTAMP> --115 MB processedDEFAULT(SELECT STRUCT(MIN(block_timestamp) AS date_min,MAX(block_timestamp) AS date_max) FROM staging.load_delta);
Based on your existing ETL/ELT pipeline, you can add the above code as-is to your pipeline or you can compute date_min, data_max as part of some already existing transformation step. Alternatively, date_min, data_max can be computed on the Source System side while capturing the next ingestion data batch.
After computing date_min, date_max you pass those values to the MERGE statement as static predicates. There are several ways to enhance the MERGE and prune partitions in the base table based on precomputed date_min, data_max.
If your initial MERGE statement uses a subquery, you can incorporate a new filter into it:
BEGINDECLARE src_range STRUCT<date_min TIMESTAMP, date_max TIMESTAMP> --115 MB processedDEFAULT(SELECT STRUCT(MIN(block_timestamp) AS date_min,MAX(block_timestamp) AS date_max) FROM staging.load_delta);MERGE INTO reporting.base_table T --41 GB processedUSING (SELECT *FROM staging.load_deltaWHERE block_timestamp BETWEEN src_range.date_min AND src_range.date_max) SON T.block_hash = S.block_hashAND T.log_index = S.log_indexAND T.block_timestamp = S.block_timestampWHEN MATCHED THEN UPDATE SETT.data = S.dataWHEN NOT MATCHED THEN INSERT (log_index, data, topics, block_timestamp, block_hash)VALUES (log_index, data, topics, block_timestamp, block_hash);END;
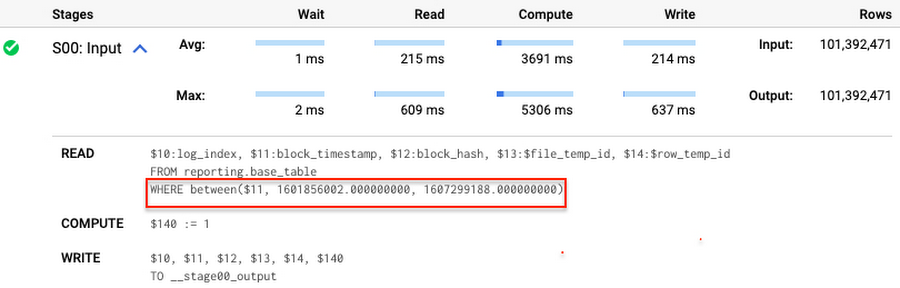
Note that you add the static filter to the staging table and keep T.block_timestamp = S.block_timestamp to convey to BigQuery that it can push that filter to the base table. This MERGE processes 41 GB of data in contrast to the initial 161 GB. You can see in the query plan that BigQuery pushes the partition filter from the staging table to the base table:
This type of optimization, when a pruning condition is pushed from a subquery to a large partitioned or clustered table, is not unique for MERGE. It also works for other types of queries. For instance:
SELECT * -- 41 GB processedFROM reporting.base_table TINNER JOIN staging.load_delta SON T.block_hash = S.block_hashAND T.log_index = S.log_indexAND T.block_timestamp = S.block_timestampWHERE S.block_timestamp BETWEEN TIMESTAMP '2020-10-05' AND TIMESTAMP '2020-12-07'
And you can check the query plan to verify that BigQuery pushed down the partition filter from one table to another.
Moreover, for SELECT statements, BigQuery can automatically infer a filter predicate on a join column and push it down from one table to another if your query meets the following criteria:
- The target table must be clustered or partitioned.
- The result size of the other table, i.e. after applying all filters, must qualify for broadcast join. Namly, the result set must be relatively small, less than ~100MB.
In our running example, reporting.base_table is partitioned by block_timestamp. If you define a selective filter on staging.load_delta and join two tables, you can see an inferred filter on the join key pushed to the target table
SELECT *FROM reporting.base_table TINNER JOIN staging.load_delta SON T.block_timestamp = S.block_timestampWHERE S.block_hash = '0x0c1caa16b34d94843aabfebc0d5a961db358135988f7498a6fdc450ad55f0870'
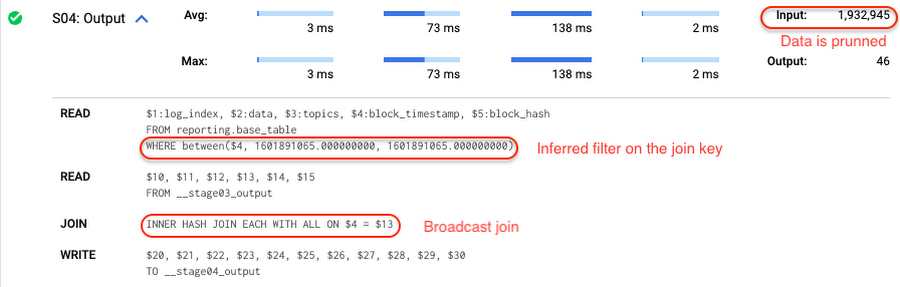
There is no requirement to join tables by partitioning or clustering key to kick off this type of optimization. However, in this case the pruning effect on the target table would be less significant.
But let us get back to the pipeline optimizations. Another way to enhance MERGE is to modify the merge_condition filter by adding static predicate on the base table:
BEGINDECLARE src_range STRUCT<date_min TIMESTAMP, date_max TIMESTAMP> --115 MB processedDEFAULT(SELECT STRUCT(MIN(block_timestamp) AS date_min,MAX(block_timestamp) AS date_max) FROM staging.load_delta);MERGE INTO reporting.base_table T --41 GB processedUSING staging.load_delta SON T.block_hash = S.block_hashAND T.log_index = S.log_indexAND T.block_timestamp BETWEEN src_range.date_min AND src_range.date_maxWHEN MATCHED THEN UPDATE SETT.data = S.dataWHEN NOT MATCHED THEN INSERT (log_index, data, topics, block_timestamp, block_hash)VALUES (log_index, data, topics, block_timestamp, block_hash);END;
To summarize, here are the steps that you can perform to enhance incremental ingestion pipelines in BigQuery. First you compute the range of updated partitions based on the small staging table. Next, you tweak the MERGE statement a bit to let BigQuery know to prune data in the base table.
All the enhanced MERGE statements scanned 41 GB of data, and setting up the src_range variable took 115 MB. Compare it with the initial 161 GB scan. Moreover, given that computing src_range may be incorporated into some existing transformation in your ETL/ELT, it results in a good performance improvement which you can leverage in your pipelines.
In this post we described how to enhance data ingestion pipelines by turning dynamic filter predicates into static predicates and letting BiQuery prune data for us. You can find more tips on BigQuery DML tuning here.
Special thanks to Daniel De Leo, who helped with examples and provided valuable feedback on this content.
Seven-Eleven Japan Leverages Google Cloud’s Performance and Speed for Real-time Business Insights

6828
Of your peers have already read this article.
4:00 Minutes
The most insightful time you'll spend today!
With the rise of technologies like smartphones, retailers have felt the pressure to meet evolving consumer needs and expectations. Seven-Eleven Japan(“SEJ”) has long been on the forefront of this thanks to the way they develop and invest in IT. However, in recent years, Japan’s leading convenience store chain has struggled to maintain its complex legacy systems at the rate needed to keep up with today’s rapid digitization, spurred on by the increasing proliferation of smartphones and an IT vendor-dependent structure.
Legacy systems limiting real-time responsiveness and innovation
Since its early days, SEJ has been proactive in adopting information technology, mainly relying on technology solutions from Japan’s leading vendors. But as the systems have grown, key business issues have been resolved using a vendor-dependent structure rather than being driven by SEJ’s own needs.
Datasets and business logic were combined and built into legacy environments, gradually leading to data silos. As a result, data was distributed across multiple systems, causing a variety of problems, including the inability to efficiently retrieve data when needed, delays in accessing data collected in individual stores, and difficulties taking measurements at the right time in business operations that require real-time responsiveness.
Connecting different systems also takes time and money, and the lead time for introducing new services—from planning to development and launch—has been longer than expected.
To solve these problems, SEJ’s IT department built “Seven Central”—a new platform for practical data use launched in 2020 to support the company’s future IT strategies and digital transformation initiatives.
At its core, Seven Central’s ultimate purpose is to allow real-time data views. Versatile, real-time datasets—such as point-of-sale (POS) data from 7-Eleven stores—are consolidated into a centralized location in the cloud. They created a simple data mart that provides data via an API to enable them to respond more quickly to requests from individual departments.
“In such uncertain times, it’s vital to use data to make quick decisions,” says Izuru Nishimura, Executive Officer and Head of ICT Department. “Each department across the entire company will be able to gain an immediate understanding of the situation based on the most up-to-date data and respond accordingly. This is why we built Seven Central.”
Google Cloud selected to help SEJ build and grow their data cloud
Today’s rapidly changing business environment has also highlighted the risk of IT support becoming a bottleneck. The long-term strategy is to gradually expand the datasets managed and collected in Seven Central according to business needs.
In the first phase, SEJ collected POS data from all 21,000+ stores to enable real-time analysis. Moving forward, they would like to collect other relevant data—for example, unstructured data, such as images and videos, or master datasets that are currently stored externally.
Google Cloud was already a top contender when SEJ started developing Seven Central in 2019. They compared various public cloud services besides Google Cloud, focusing on three main capabilities.
“We placed particular emphasis on service scalability to drive future digital transformation; security when handling data, which is the lifeline of our company; and finally, openness,” says Nishimura. He emphasizes that openness was perhaps the most important factor for choosing Google Cloud. Breaking away from the negative aspects of an entirely vendor-dependent system enabled them to build an agile development system with multiple vendors.
Google Cloud technologies including BigQuery and API management platform, Apigee, play a vital role in Seven Central. BigQuery’s high-speed processing at petabyte scale and fully managed infrastructure helped keep costs low during development and verification.
“Data is stored in a way that allows you to share it easily across organizations, which helps solve the issue of data silos from the perspective of scalability. I also like the fact there are some interesting features that could be used in the future—like BigQuery ML, which enables machine learning on BigQuery,” says Nishimura.
Apigee allows SEJ to separate datasets and business logic, which is one of the key points of Seven Central. While the trend these days is to standardize interfaces using an API, the reality tends to involve many different APIs rather than the introduction of one unified API. With Apigee, SEJ provides a single unified API for all of its data cloud, and they can now understand what data is used thanks to Apigee’s API usage visualizations.
“Right now, we collect data from all 21,000+ stores,” says Nishimura. “But in anticipation of a future expansion in business operations, we have designed a system that can scale up and run without issue, even if we were to have 30,000 stores, with 1,000 customers per store per day, purchasing five items per person.”
Real-time insights with BigQuery and Cloud Spanner
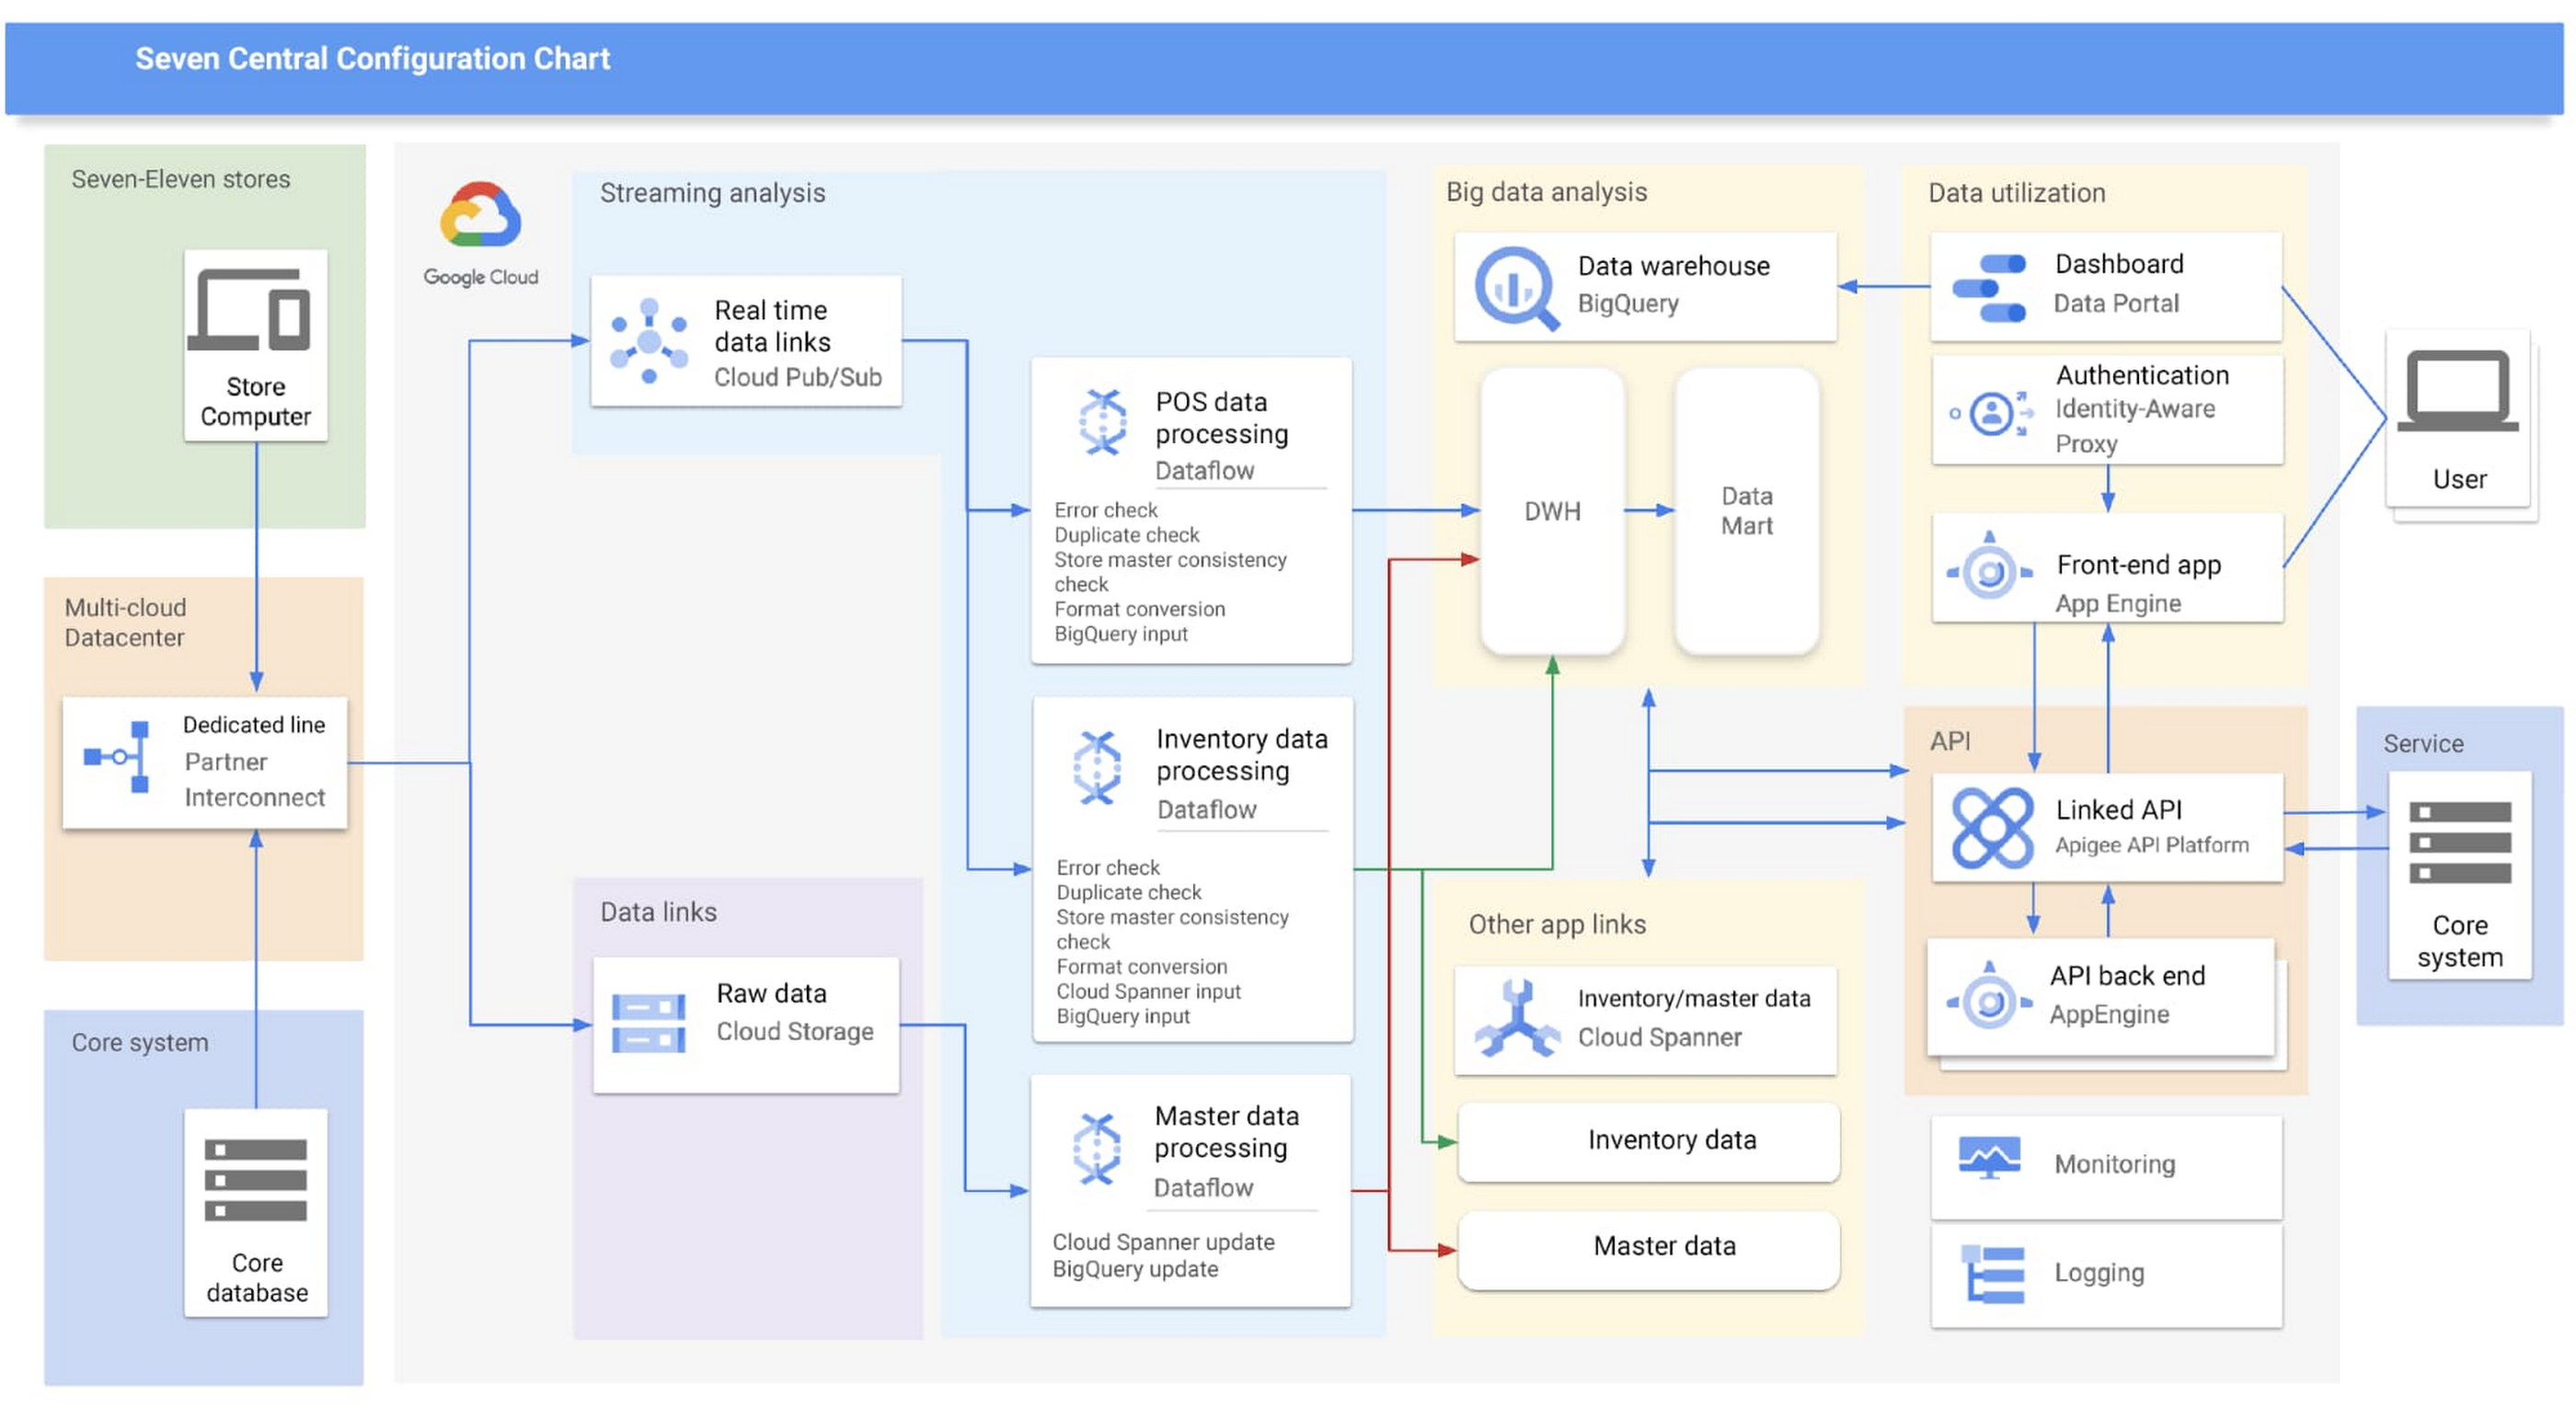
Google Cloud partner Cloud Ace came on board early in the planning phases. Based on their recommendations, SEJ decided to continue making full use of BigQuery to analyze data collected from all 21,000+ stores throughout Japan, while also using Cloud Spanner’s availability, near-unlimited scalability and transactional consistency to help achieve the real-time results needed for the project.
“Given that both the data and the regularity with which it is accessed are expected to steadily increase in the future, we chose Cloud Spanner as backend storage for data delivery via API. We consider it a good choice,” says Shota Kikuchi, General Manager, Consulting Department, Technology Division, Cloud Ace Co., Ltd.
Finally, they chose to use Google Cloud’s Stream Analytics Solutions messaging service for collecting POS data in real time, which can then be put to immediate use with Cloud Spanner and BigQuery.
High-speed responses exceed targets and create new value
Seven Central went live in September 2020 with surprising results.
They initially set a target time of one hour from when a customer makes a purchase to the point when Seven Central can use that data. But when the final system was first tried—it took barely a minute. Moving forward they estimate that the latest inventory data from the service side will become available within a few minutes of being added to the system.
“This is real innovation, and I must admit that I am quite surprised. As well as being able to solve existing issues, we also hope it will lead to new improvements and services that have been unimaginable up until now,” says Nishimura.
The team hopes to roll out the Seven Central platform in all companies affiliated with Seven & i Holdings—not just SEJ. They also plan to explore Google Cloud AI and machine learning technologies to take on challenges in new areas. For example, they are investigating the idea of clustering individual stores using BigQuery ML.
Seven Central has already attracted attention from many departments and received a lot of requests. Nishimura and his team say they hope to continue to grow Seven Central while still observing their fundamental principles—not including business logic, maintaining real-time results, and staying true to the uniqueness of SEJ.
Learn more about Google Cloud smart analytics solutions.
More Relevant Stories for Your Company

Making Mothers’ Day Special: How Google Cloud Migration for 1-800-FLOWERS.COM, Inc Impacts CX
Editor’s note: In honor of Mother’s Day, we look at how 1-800-FLOWERS.COM, Inc. migrated to Google Cloud as part of its digital transformation to quickly deploy seamless and convenient customer experiences across multiple brands on Mother’s Day and every day. As a leading provider of gifts designed to help customers

Blue Apron: Offering a better recipe for modern analytics
When Blue Apron had issues running its data warehouse on another cloud provider, it built an analytics platform using Looker and Google BigQuery to enable faster business decisions about food inventory. Google Cloud Results Enables near real-time business decisions to better manage food inventory and delivery by reducing query times

Getting Started with BigQuery: 10 Quick Steps
BigQuery is Google's fully managed, petabyte scale, low cost analytics data warehouse. BigQuery is NoOps—there is no infrastructure to manage and you don't need a database administrator—so you can focus on analyzing data to find meaningful insights, use familiar SQL, and take advantage of our pay-as-you-go model. That's great, right? So

How Vertex AI Helps Coca-Cola Bottlers Japan Analyze Billions of Data Records
Japan is home to millions of vending machines installed on streets and in buildings, sports stadiums and other facilities. Vending machine owners and operators, including beverage manufacturers, stock these machines with different product combinations depending on location and demand. For example, they primarily display coffee and energy drinks in machines
