





MerPay Platform Scales its Reach to Millions of Users using Cloud Spanner

5291
Of your peers have already read this article.
2:00 Minutes
The most insightful time you'll spend today!
Editor’s note: To launch a new mobile payment platform, Mercari needed a database solution strong on scalability, availability, and performance. Here’s how Cloud Spanner delivered those results.
E-commerce companies need to connect customers to their services securely, reliably, with zero downtime. When Mercari, Inc. launched a new mobile payment platform, we chose Cloud Spanner as part of our data portfolio, which provided us with easy scalability to handle millions of new users, a fully managed service that minimized overhead costs, and deep integration with other Google Cloud services.
Mercari, Inc., Japan’s largest C2C marketplace, launched its app in 2013, which allows 18.2million monthly users to easily and securely buy new and used items. Mercari expanded into the United States and in 2014 and launched Merpay, a mobile payment service that can be used through Mercari in Japan in 2017. With more than 85 million users, Merpay is now accepted at 1.8 million merchants and e-commerce sites in Japan, supporting payments via the DOCOMO ID contactless system and QR code.
Prioritizing availability and scalability
When we started building Merpay, we were looking for a new database. In the past, Mercari had used MySQL with bare metal hardware. Because of the amount of data, we required additional expertise to manage and maintain the hardware, software and MySQL implementation. Having built much of the microservices architecture for our Mercari app using Google Kubernetes Engine (GKE), it was natural to look at Google Cloud’s managed services when deciding upon our new database infrastructure for Merpay.
For the database, we were focusing especially on requirements around availability, scalability, and performance. To do a single payment transaction, there were multiple steps each with writes, requiring high-write-throughput and low-latency from the database. Needing a solution that would support reliable payment processing 24/7/365, we chose Spanner, which offers up to 99.999% availability with zero downtime for planned maintenance and schema changes.
We worked closely with Google Cloud’s Premium Support, Technical Account Management (TAM), and Strategic Cloud Engineer and Cloud Consultant teams to implement Spanner, including separating the payment processing— originally one of the functions in Mercari—as a microservice.
A nod to easier nodes and better scale
After launch, the number of Merpay users reached 2 million in only a few months. We had 45 Spanner nodes at the time of launch of Merpay and about 50 nodes four months later. Because we’d optimized the application side during those four months, we didn’t have to add many nodes to keep up with the growing traffic.
Whenever we needed to scale up the serving and storage resources in our instances, Spanner made it easy to increase nodes as needed in the Cloud Console. To optimize costs, it’s easy to add nodes during a marketing campaign and remove them afterward. Even if the traffic count is different from expected, we can change the number of nodes immediately. That’s one incredible convenience of Cloud Spanner.
Building powerful pipelines
Our data pipelines are used for KPI analytics, fraud detection, credit scoring, and customer support use cases. Because Cloud Spanner integrates so easily with other Google Cloud data services, the data in Spanner is easily accessible for analytics. From the Spanner database for each microservice, we create both batch and streaming data pipelines using Pub/Sub and Dataflow, as well as Apache Flink, and load the data into BigQuery and Google Cloud Storage. We’re able to quickly aggregate the data required for data platforms such as BigQuery and Cloud Storage. The original data is stored in Spanner and managed by microservices, but analysis through BigQuery is centrally managed by the Data Platform team. This team determines the confidentiality level of data and centrally manages BigQuery permissions using Terraform. By centrally managing data access permissions on the data platform rather than on individual microservices, we’re able to set appropriate security for individual users.
Our full data portfolio also includes Looker, which we use for product analysis, accounting analysis, test performance visualization, operation monitoring, development efficiency analysis, and HR analysis. We also use Dataproc, Cloud Composer, Data Catalog, and Data Studio. The Dataflow template created for the pipeline is also published as OSS.
With Spanner and other Google Cloud services, our Merpay platform is flexible, secure, scalable and highly available. As Spanner eliminates overhead, we can devote engineering resources to developing new tools and solutions for our customers. We’re looking ahead at providing cryptocurrency service, for example, and are now working on a project to migrate Mercari’s monolithic system that is still on premises entirely over to Google Cloud.
Read more about Mercari and Merpay. Or check out our recent blog: three reasons to consider Cloud Spanner for your next project.
Countries can Tackle Food Wastage Crisis Using Google’s Data Analytics

4986
Of your peers have already read this article.
4:00 Minutes
The most insightful time you'll spend today!
With over ⅓ of the food in the USA ending up as waste according to the USDA, it is a compelling challenge to address this travesty. What will happen to hunger, food prices, trash reduction, water consumption, and overall sustainability when we stop squandering this abundance?

Beginning with the departure from the farm to the back of the store, the freshness clock continues to run. Grocers work very hard to purchase high quality produce items for their customers and the journey to the shelf can take a toll in both quality and remaining shelf life. Suppliers focus on delivering their items through the arduous supply chain journey to the store with speed and gentle handling. The baton is then passed to the store to unload and present the items to customers with care to sell through each lot significantly before the expiration or sell by date. This is to ensure that the time spent in the customer’s home is ample to ensure a great eating experience as well. Food waste is a farm to fork problem with opportunity at every step of the chain, but today we will focus on the segment that the grocery industry oversees.
With the complexities of weather, geopolitical issues, distribution, sales variability, pricing, promotions, and inventory management, it seems daunting to impact waste. Fortunately, data analytics and machine learning in the cloud is a powerful weapon in the fight against food waste. Data Scientists harness knowledge to draw meaning from data turning that data into decision driving information.
One key Google has been working on to accelerate value is to break down data silos and leverage machine learning to realize better outcomes, using our Google Data Cloud platform. This enables better planning through demand forecasting, Inventory management, assortment planning, and dynamic pricing and promotions.
That sounds great but how does it work?
Let’s walk through a day in the life journey to see how the integrated Google Data Cloud platform can change the game for good. Our friendly fictitious grocer FastFreshFood is committed to selling high quality perishable items to their local market. Their goal is to minimize food waste and maximize revenue by selling as much perishable fresh food as possible before the sell by date. Our fictitious grocer in partnership with Google Cloud could build a solution that will take a significant bite out of their food waste volume and better satisfy customers.
- Sales through the register and online are processed in real time with Datastream, Dataflow to keep an accurate perpetual inventory by minute of every single item.
- A Demand forecasting model using machine learning algorithms in BigQuery then identifies needs for back room replenishment, so Direct Store Delivery and daily store Distribution Centers manage ordering more efficiently to ensure just the right amount of each product each day.
- Realtime reporting dashboards in Looker with alerting capabilities enable the system to operate with strong associate support and understanding. The reporting suite shows inventory levels into the future, daily orders, and at risk items.
The pricing algorithm could also alert store leadership concerning any items that will not sell through and suggest real time in store specials resulting in zero waste at shelf and maximized revenue.

This approach is not just for perishable categories and is a pattern that works well for in-store produced items and center store items. The key point is that by bringing ML/AI to difficult business problems grocers are reinventing what is possible for both their profitability and sustainability.
The technical implementation of this design pattern in Google Cloud leverages Datastream, Dataflow, BigQuery and Looker products, it is detailed in a technical tutorial accompanying this blog post.
In partnership with Google Cloud, retailers can solve complex problems with innovative solutions to achieve higher quality, lower cost, and provide great customer experiences. To learn more from this and other use cases, please visit our Design Patterns website.
Curious to learn more?
We’re excited to share what we know about tackling food waste at Google, a topic we’ve been working on in the last decade as we’ve embarked on reducing our own food waste in our operations in over 50 countries in the world. The Google Food for Good team works exclusively on Google Cloud Platform with our partners on this topic. Two additional articles below.
Silos are for food, not for data – tackling food waste with technology
This business Cloud blog directly addresses information silos that currently exist across many nodes in the food system and how to break down cultural and organizational barriers to sharing.
“Unsiloing” data to work toward solving food waste and food insecurity
This follow-on technical Cloud blog articulates the path to setting up data pipelines, translating between data sets (not everyone calls a tomato a tomato!) and making sense of emergent insights.
Seven-Eleven Japan Leverages Google Cloud’s Performance and Speed for Real-time Business Insights

6845
Of your peers have already read this article.
4:00 Minutes
The most insightful time you'll spend today!
With the rise of technologies like smartphones, retailers have felt the pressure to meet evolving consumer needs and expectations. Seven-Eleven Japan(“SEJ”) has long been on the forefront of this thanks to the way they develop and invest in IT. However, in recent years, Japan’s leading convenience store chain has struggled to maintain its complex legacy systems at the rate needed to keep up with today’s rapid digitization, spurred on by the increasing proliferation of smartphones and an IT vendor-dependent structure.
Legacy systems limiting real-time responsiveness and innovation
Since its early days, SEJ has been proactive in adopting information technology, mainly relying on technology solutions from Japan’s leading vendors. But as the systems have grown, key business issues have been resolved using a vendor-dependent structure rather than being driven by SEJ’s own needs.
Datasets and business logic were combined and built into legacy environments, gradually leading to data silos. As a result, data was distributed across multiple systems, causing a variety of problems, including the inability to efficiently retrieve data when needed, delays in accessing data collected in individual stores, and difficulties taking measurements at the right time in business operations that require real-time responsiveness.
Connecting different systems also takes time and money, and the lead time for introducing new services—from planning to development and launch—has been longer than expected.
To solve these problems, SEJ’s IT department built “Seven Central”—a new platform for practical data use launched in 2020 to support the company’s future IT strategies and digital transformation initiatives.
At its core, Seven Central’s ultimate purpose is to allow real-time data views. Versatile, real-time datasets—such as point-of-sale (POS) data from 7-Eleven stores—are consolidated into a centralized location in the cloud. They created a simple data mart that provides data via an API to enable them to respond more quickly to requests from individual departments.
“In such uncertain times, it’s vital to use data to make quick decisions,” says Izuru Nishimura, Executive Officer and Head of ICT Department. “Each department across the entire company will be able to gain an immediate understanding of the situation based on the most up-to-date data and respond accordingly. This is why we built Seven Central.”
Google Cloud selected to help SEJ build and grow their data cloud
Today’s rapidly changing business environment has also highlighted the risk of IT support becoming a bottleneck. The long-term strategy is to gradually expand the datasets managed and collected in Seven Central according to business needs.
In the first phase, SEJ collected POS data from all 21,000+ stores to enable real-time analysis. Moving forward, they would like to collect other relevant data—for example, unstructured data, such as images and videos, or master datasets that are currently stored externally.
Google Cloud was already a top contender when SEJ started developing Seven Central in 2019. They compared various public cloud services besides Google Cloud, focusing on three main capabilities.
“We placed particular emphasis on service scalability to drive future digital transformation; security when handling data, which is the lifeline of our company; and finally, openness,” says Nishimura. He emphasizes that openness was perhaps the most important factor for choosing Google Cloud. Breaking away from the negative aspects of an entirely vendor-dependent system enabled them to build an agile development system with multiple vendors.
Google Cloud technologies including BigQuery and API management platform, Apigee, play a vital role in Seven Central. BigQuery’s high-speed processing at petabyte scale and fully managed infrastructure helped keep costs low during development and verification.
“Data is stored in a way that allows you to share it easily across organizations, which helps solve the issue of data silos from the perspective of scalability. I also like the fact there are some interesting features that could be used in the future—like BigQuery ML, which enables machine learning on BigQuery,” says Nishimura.
Apigee allows SEJ to separate datasets and business logic, which is one of the key points of Seven Central. While the trend these days is to standardize interfaces using an API, the reality tends to involve many different APIs rather than the introduction of one unified API. With Apigee, SEJ provides a single unified API for all of its data cloud, and they can now understand what data is used thanks to Apigee’s API usage visualizations.
“Right now, we collect data from all 21,000+ stores,” says Nishimura. “But in anticipation of a future expansion in business operations, we have designed a system that can scale up and run without issue, even if we were to have 30,000 stores, with 1,000 customers per store per day, purchasing five items per person.”
Real-time insights with BigQuery and Cloud Spanner
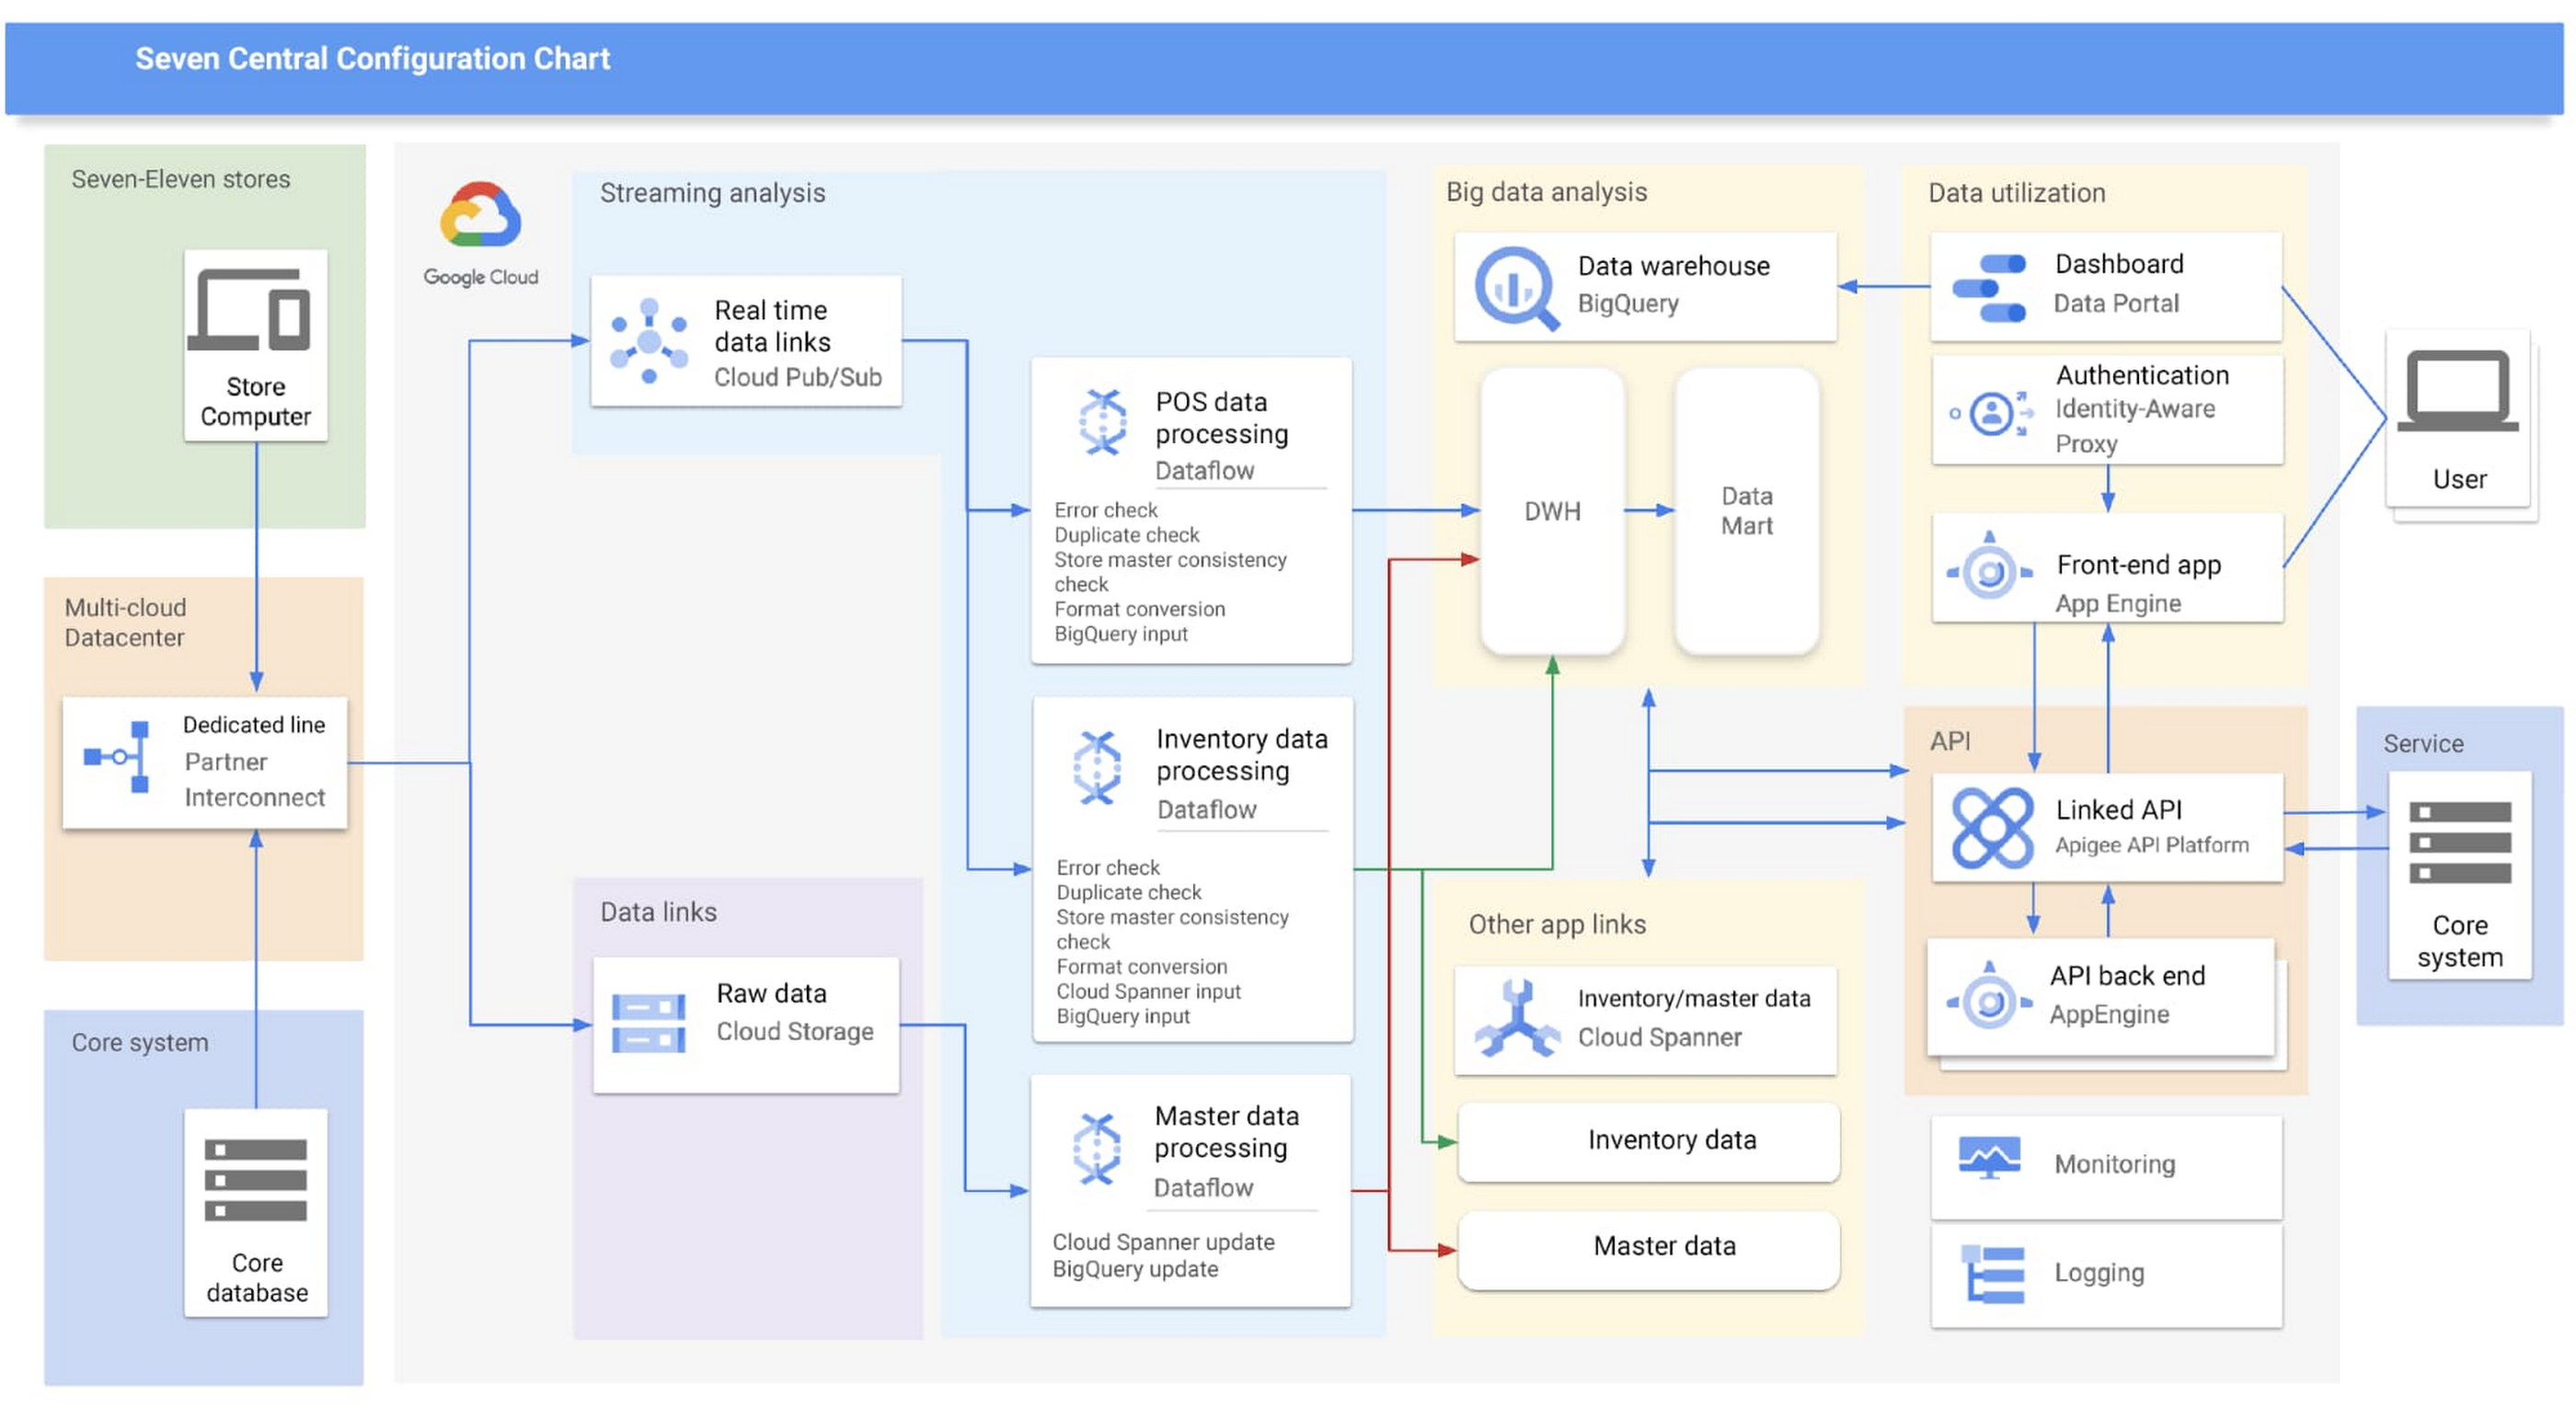
Google Cloud partner Cloud Ace came on board early in the planning phases. Based on their recommendations, SEJ decided to continue making full use of BigQuery to analyze data collected from all 21,000+ stores throughout Japan, while also using Cloud Spanner’s availability, near-unlimited scalability and transactional consistency to help achieve the real-time results needed for the project.
“Given that both the data and the regularity with which it is accessed are expected to steadily increase in the future, we chose Cloud Spanner as backend storage for data delivery via API. We consider it a good choice,” says Shota Kikuchi, General Manager, Consulting Department, Technology Division, Cloud Ace Co., Ltd.
Finally, they chose to use Google Cloud’s Stream Analytics Solutions messaging service for collecting POS data in real time, which can then be put to immediate use with Cloud Spanner and BigQuery.
High-speed responses exceed targets and create new value
Seven Central went live in September 2020 with surprising results.
They initially set a target time of one hour from when a customer makes a purchase to the point when Seven Central can use that data. But when the final system was first tried—it took barely a minute. Moving forward they estimate that the latest inventory data from the service side will become available within a few minutes of being added to the system.
“This is real innovation, and I must admit that I am quite surprised. As well as being able to solve existing issues, we also hope it will lead to new improvements and services that have been unimaginable up until now,” says Nishimura.
The team hopes to roll out the Seven Central platform in all companies affiliated with Seven & i Holdings—not just SEJ. They also plan to explore Google Cloud AI and machine learning technologies to take on challenges in new areas. For example, they are investigating the idea of clustering individual stores using BigQuery ML.
Seven Central has already attracted attention from many departments and received a lot of requests. Nishimura and his team say they hope to continue to grow Seven Central while still observing their fundamental principles—not including business logic, maintaining real-time results, and staying true to the uniqueness of SEJ.
Learn more about Google Cloud smart analytics solutions.
Make Meaningful Analysis with Geo Boundary Public Datasets on BigQuery

6354
Of your peers have already read this article.
4:00 Minutes
The most insightful time you'll spend today!
Geospatial data is a critical component for a comprehensive analytics strategy. Whether you are trying to visualize data using geospatial parameters or do deeper analysis or modeling on customer distribution or proximity, most organizations have some type of geospatial data they would like to use – whether it be customer zipcodes, store locations, or shipping addresses. However, converting geographic data into the correct format for analysis and aggregation at different levels can be difficult. In this post, we’ll walk through some examples of how you can leverage the Google Cloud platform alongside Google Cloud Public Datasets to perform robust analytics on geographic data. The full queries can be accessed from this notebook here.
Public US Geo Boundaries dataset
BigQuery hosts a slew of public datasets for you to access and integrate into your analytics. Google pays for the storage of these datasets and provides public access to the data via the bigquery-public-data project. You only pay for queries against the data. Plus, the first 1 TB per month is free! These public datasets are valuable on their own, but when joined against your own data they can unlock new analytics use cases and save the team a lot of time.
Within the Google Cloud Public Datasets Program there are several geographic datasets. Here, we’ll work with the geo_us_boundaries dataset, which contains a set of tables that have the boundaries of different geospatial areas as polygons and coordinates based on the center point (GEOGRAPHY column type in BigQuery), published by the US Census Bureau.

Mapping geospatial points to hierarchical areas
Many times you will find yourself in situations where you have a string representing an address. However, most tools require lat/long coordinates to actually plot points. Using the Google Maps Geocoding API we can convert an address into a lat/long and then store the results in the BigQuery table.
With a lat/long representation of our point, we can join our initial dataset back onto any of the tables here using the ST_WITHIN function. This allows us to check and see if a point is within the specified polygon.
ST_WITHIN(geography_1, geography_2)
This can be helpful for ensuring standard nomenclature; for example, metropolitan areas that might be named differently. The query below maps each customers’ address to a given metropolitan area name.
SELECTcust.id as customer_id,metro.name as metro_nameFROM `looker-private-demo.retail.customers` as cust,`bigquery-public-data.geo_us_boundaries.metropolitan_divisions` as metroWHERE ST_WITHIN(ST_GEOGPOINT(cust.longitude, cust.latitude),metro.metdiv_geom)
It can also be useful for converting to designated market area (DMA), which is often used in creating targeted digital marketing campaigns.
SELECTcust.id as customer_id,dma.dma_nameFROM `looker-private-demo.retail.customers` as cust,`bigquery-public-data.geo_us_boundaries.designated_market_area` as dmaWHERE ST_WITHIN(ST_GEOGPOINT(cust.longitude, cust.latitude),dma.dma_geom)
Or for filling in missing information; for example, some addresses may be missing zip code which results in incorrect calculations when aggregating up to the zipcode level. By joining onto the zip_codes table we can ensure all coordinates are mapped appropriately and aggregate up from there.
SELECTzip.zip_code,count(distinct cust.id) as unique_customersFROM `looker-private-demo.retail.customers` as cust,`bigquery-public-data.geo_us_boundaries.zip_codes` as zipWHERE ST_WITHIN(ST_GEOGPOINT(cust.longitude, cust.latitude),zip.zip_code_geom)GROUP BY 1
Note that the zip code table isn’t a comprehensive list of all US zip codes, they are zip code tabulation areas (ZCTAs). Details about the differences can be found here. Additionally, the zip code table gives us hierarchical information, which allows us to perform more meaningful analytics. One example is leveraging hierarchical drilling in Looker. I can aggregate my total sales up to the country level, and then drill down to state, city and zipcode to identify where sales are highest. You can also use the BigQuery GeoViz tool to visualize geospatial data!

Aside from simply checking if a point is within an area, we can also use ST_DISTANCE to do something like find the closest city using the centerpoint for the metropolitan area table.
SELECTcust.id as customer_id,ARRAY_AGG(metro.name order by ST_DISTANCE(ST_GEOGPOINT(cust.longitude, cust.latitude),metro.internal_point_geom) asc limit 1)[offset(0)] as metro_nameFROM`looker-private-demo.retail.customers` as cust,`bigquery-public-data.geo_us_boundaries.metropolitan_divisions` as metroGROUP BY cust.id
This concept doesn’t just hold true for points, we can also leverage other GIS functions to see if a geospatial area is contained within areas that are listed in the boundaries datasets. If your data comes into BigQuery as a GeoJSON string, we can convert it to a GEOGRAPHY type using the ST_GEOGFROMGEOJSON function. Once our data is in a GEOGRAPHY type we can do things like check to see what urban area the geo is within – using either ST_WITHIN or ST_INTERSECTS to account for partial coverage. Here, I am using the customer’s zip code to find all metropolitan divisions where the zip code polygon and the metropolitan polygon intersect. I am then selecting the metropolitan area that has the most overlap (or the intersection has the largest area) to be the customer’s metro that we use for reporting.
SELECTcust.id as customer_id,ARRAY_AGG(metro.name order by ST_AREA(ST_INTERSECTION(zip.zip_code_geom,metro.metdiv_geom)) desc limit 1)[offset(0)] as metro_nameFROM`looker-private-demo.retail.customers` as custJOIN `bigquery-public-data.geo_us_boundaries.zip_codes` as zip on cust.zip=zip.zip_code,`bigquery-public-data.geo_us_boundaries.metropolitan_divisions` as metroWHERE ST_INTERSECTS(zip.zip_code_geom,metro.metdiv_geom)GROUP BY cust.id
The same ideas can be applied to the other tables in the dataset including the county, urban areas and National Weather Service forecast regions (which can also be useful if you want to join your datasets onto weather data).
Correcting for data discrepancy
One problem that we may run into when working with geospatial data is that different data sources may have different representations of the same information. For example, you might have one system that records state as a two letter abbreviation and another using the full name. Here, we can use the state table to join the different datasets.
SELECTst.state_name,sum(ab.sales+fn.sales) as total_salesFROM `bigquery-public-data.geo_us_boundaries.states` as stLEFT JOIN abbreviated_table as ab on ab.state = st.stateLEFT JOIN fullname_table as fn on fn.state = st.state_nameWHERE COALESCE(ab.state, fn.state) IS NOT NULLGROUP BY 1
Another example might be using the tables as a source of truth for fuzzy matching. If the address is a manually entered field somewhere in your application, there is a good chance that things will be misspelled. Different representations of the same name may prevent tables from joining with each other or lead to duplicate entries when performing aggregations. Here, I use a simple Soundex algorithm to generate a code for each county name, using helper functions from this blog post. We can see that even though some are misspelled they have the same Soundex code.

Next, we can join back onto our counties table so we make sure to use the correct spelling of the county name. Then, we can simply aggregate our data for more accurate reporting.
SELECTc.county_name,sum(sales) as total_salesFROMtableJOIN `bigquery-public-data.geo_us_boundaries.counties` as con testing.dq_fm_Soundex(table.county) = testing.dq_fm_Soundex(c.county_name)WHERE c.state_fips_code = cast(36 as string)GROUP BY 1
Note that fuzzy matching definitely isn’t perfect and you might need to try different methods or apply certain filters for it to work best depending on the specifics of your data.
The US Geo Boundary datasets allow you to perform meaningful geographic analysis without needing to worry about extracting, transforming or loading additional datasets into BigQuery. These datasets, along with all the other Google Cloud Public Datasets, will be available in the Analytics Hub. Please sign up for the Analytics Hub preview, which is scheduled to be available in the third quarter of 2021, by going to g.co/cloud/analytics-hub.
Scaling Ad Personalization with Bigtable

3005
Of your peers have already read this article.
2:30 Minutes
The most insightful time you'll spend today!
Cloud Bigtable is a popular and widely used key-value database available on Google Cloud. The service provides scale elasticity, cost efficiency, excellent performance characteristics, and 99.999% availability SLA. This has led to massive adoption with thousands of customers trusting Bigtable to run a variety of their mission-critical workloads.
Bigtable has been in continuous production usage at Google for more than 15 years now. It processes more than 5 billion requests per second at peak and has more than 10 exabytes of data under management. It’s one of the largest semi-structured data storage services at Google.
One of the key use cases for Bigtable at Google is ad personalization. This post describes the central role that Bigtable plays within ad personalization.
Ad personalization
Ad personalization aims to improve user experience by presenting topical and relevant ad content. For example, I often watch bread-making videos on YouTube. If ads personalization is enabled in my ad settings, my viewing history could indicate to YouTube that I’m interested in baking as a topic and would potentially be interested in ad content related to baking products.
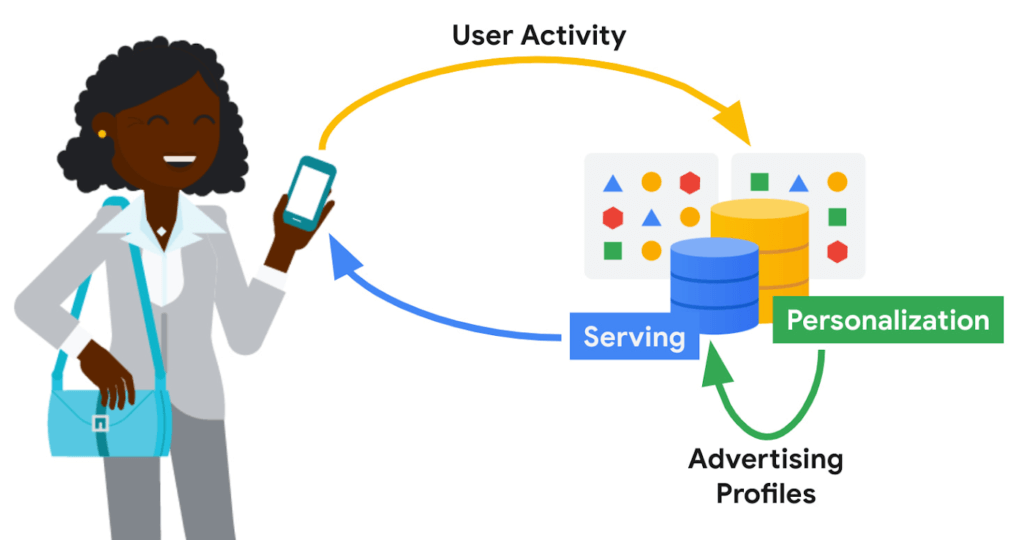
Ad personalization requires large-scale data processing in near real-time for timely personalization with strict controls for user data handling and retention. System availability needs to be high, and serving latencies need to be low due to the narrow window within which decisions need to be made on what ad content to retrieve and serve. Sub-optimal serving decisions (e.g. falling back to generic ad content) could potentially impact user experience. Ad economics requires infrastructure costs to be kept as low as possible.
Google’s ad personalization platform provides frameworks to develop and deploy machine learning models for relevance and ranking of ad content. The platform supports both real-time and batch personalization. The platform is built using Bigtable, allowing Google products to access data sources for ads personalization in a secure manner that is both privacy and policy compliant, all while honoring users’ decisions about what data they want to provide to Google
The output from personalization pipelines, such as advertising profiles are stored back in Bigtable for further consumption. The ad serving stack retrieves these advertising profiles to drive the next set of ad serving decisions.
Some of the storage requirements of the personalization platform include:
- Very high throughput access for batch and near real-time personalization
- Low latency (<20 ms at p99) lookup for reads on the critical path for ad serving
- Fast (i.e. in the order of seconds) incremental update of advertising models in order to reduce personalization delay
Bigtable
Bigtable’s versatility in supporting both low-cost, high-throughput access to data for offline personalization as well as consistent low-latency access for online data serving makes it an excellent fit for the ads workloads.
Personalization at Google-scale requires a very large storage footprint. Bigtable’s scalability, performance consistency and low cost required to meet a given performance curve are key differentiators for these workloads.
Data model
The personalization platform stores objects in Bigtable as serialized protobufs keyed by Object ids. Typical data sizes are less than 1 MB and serving latency is less than 20 ms at p99.
Data is organized as corpora, which correspond to distinct categories of data. A corpus maps to a replicated Bigtable.
Within a corpus, data is organized as DataTypes, logical groupings of data. Features, embeddings, and different flavors of advertising profiles are stored as DataTypes, which map to Bigtable column families. DataTypes are defined in schemas which describe the proto structure of the data and additional metadata indicating ownership and provenance. SubTypes map to Bigtable columns and are free-form.
Each row of data is uniquely identified by a RowID, which is based on the Object ID. The personalization API identifies individual values by RowID (row key), DataType (column family), SubType (column part), and Timestamp.
Consistency
The default consistency mode for operations is eventual. In this mode, data from the Bigtable replica nearest to the user is retrieved, providing the lowest median and tail latency.
Reads and writes to a single Bigtable replica are consistent. If there are multiple replicas of Bigtable in a region, traffic spillover across regions is more likely. To improve the likelihood of read-after-write consistency, the personalization platform uses a notion of row affinity. If there are multiple replicas in a region, one replica is preferentially selected for any given row, based on a hash of the Row ID.
For lookups with stricter consistency requirements, the platform first attempts to read from the nearest replica and requests that Bigtable return the current low watermark (LWM) for each replica. If the nearest replica happens to be the replica where the writes originated, or if the LWMs indicate that replication has caught up to the necessary timestamp, then the service returns a consistent response. If replication has not caught up, then the service issues a second lookup—this one targeted at the Bigtable replica where writes originated. That replica could be distant and the request could be slow. While waiting for a response, the platform may issue failover lookups to other replicas in case replication has caught up at those replicas.
Bigtable replication
The Ads personalization workloads use a Bigtable replication topology with more than 20 replicas, spread across four continents.
Replication helps address the high availability needs for ad serving. Bigtable’s zonal monthly uptime percentage is in excess of 99.9%, and replication coupled with a multi-cluster routing policy allows for availability in excess of 99.999%.
A globe-spanning topology allows for data placement that is close to users, minimizing serving latencies. However, it also comes with challenges such as variability in network link costs and throughputs. Bigtable uses Minimum Spanning Tree-based routing algorithms and bandwidth-conserving proxy replicas to help reduce network costs.
For ads personalization, reducing Bigtable replication delay is key to lowering the personalization delay (the time between a user’ action and when that action has been incorporated into advertising models to show more relevant ads to the user). Faster replication is preferred but we also need to balance serving traffic against replication traffic and make sure low-latency user-data serving is not disrupted due to incoming or outgoing replication traffic flows. Under the hood, Bigtable implements complex flow control and priority boost mechanisms to manage global traffic flows and to balance serving and replication traffic priorities.
Workload Isolation
Ad personalization batch workloads are isolated from serving workloads by pinning a given set of workloads onto certain replicas; some Bigtable replicas exclusively drive personalization pipelines while others drive user-data serving. This model allows for a continuous and near real-time feedback loop between serving systems and offline personalization pipelines, while protecting the two workloads from contending with each other.
For Cloud Bigtable users, AppProfiles and cluster-routing policies provide a way to confine and pin workloads to specific replicas to achieve coarse-grained isolation.
Data residency
By default, data is replicated to every replica—often spread out globally—which is wasteful for data that is only accessed regionally. Regionalization saves on storage and replication costs by confining data to the region where it is most likely to be accessed. Compliance with regulations mandating that data pertaining to certain subjects are physically stored within a given geographical area is also vital.
The location of data can be either implicitly determined by the access location of requests or through location metadata and other product signals. Once the location for a user is determined, it is stored in a location metadata table which points to the Bigtable replicas that read requests should be routed to. Migration of data based on row-placement policies happens in the background, without downtime or serving performance regressions.
Conclusion
In this blog post, we looked at how Bigtable is used within Google to support an important use case—modeling user intent for ad personalization.
Over the past decade, Bigtable has scaled as Google’s personalization needs have scaled by orders of magnitude. For large-scale personalization workloads, Bigtable offers low cost storage with excellent performance characteristics. It seamlessly handles global traffic flows with simple user configurations. Its ease at handling both low-latency serving and high-throughput batch computations make it an excellent option for lambda-style data processing pipelines.
We continue to drive high levels of investment to further lower costs, improve performance, and bring new features to make Bigtable an even better choice for personalization workloads.
Learn more
To get started with Bigtable, try it out with a Qwiklab and learn more about the product here.
Acknowledgements
We’d like to thank Ashish Awasthi, Ashish Chopra, Jay Wylie, Phaneendhar Vemuru, Bora Beran, Elijah Lawal, Sean Rhee and other Googlers for their valuable feedback and suggestions.
6816
Of your peers have already watched this video.
2:30 Minutes
The most insightful time you'll spend today!
What is BigQuery?
BigQuery is Google Cloud’s enterprise data warehouse designed to help you ingest, store, analyze, and visualize big data with ease.
Organizations rely on data warehouses to aggregate data from disparate sources, process it, and make it readily available for data analysis that supports their strategic decision-making.
You can ingest data into BigQuery either through batch uploading or streaming data directly to deliver real-time insights.
As a fully-managed data warehouse, Google takes care of the infrastructure so you can focus on analyzing your data up to petabyte scale.
BigQuery supports the same Structured Query Language, or SQL, for analyzing your data, which you may be familiar with if you’ve worked with ANSI-compliant relational databases in the past.
If you’re looking to create machine learning models using your enterprise data, you can do so with BigQuery ML.
With only a few lines of SQL, you can train and execute models on your BigQuery data without needing to move it around.
When it comes time to visualize your data, BigQuery integrates with Looker, as well as several other business intelligence tools across our partner ecosystem.
Now, how do you use BigQuery?
Luckily, it’s straightforward to get up and running with BigQuery.
After creating a GCP project, you can immediately start querying public data sets, which Google Cloud hosts and makes available to all BigQuery users, or you can load your own data into BigQuery to analyze.
Interacting with BigQuery to load data, run queries, or even create ML models can be done in three different ways.
First is by using the UI and the Cloud Console. Second is by using the BigQuery command line tool. And third is by making calls to the BigQuery API, using client libraries available in several languages.
BigQuery is integrated with Google Cloud’s Identity and Access Management Service so you can securely share your data and analytical insights across the organization.
What does it cost to use BigQuery?
With BigQuery, you pay for storing and querying data and streaming inserts.
Loading and exporting data are free of charge.
Storage costs are based on the amount of data stored and have two rates based on how often the data is changing.
Query costs can be either on demand, meaning you are charged per query by the amount of data processed, or flat rate for customers who want to purchase dedicated resources.
More Relevant Stories for Your Company

Query Insights for Spanner: A blessing for developers and DBAs
Today, application development teams are more agile and are shipping features faster than ever before. In addition to these rapid development cycles and the rise of microservices architectures, the end-to-end ownership of feature development (and performance monitoring) has moved to a shared responsibility model between advanced database administrators and full-stack

BURGER KING Germany: Serving Up Marketing Insights and Supply Chain Visibility Easily
Do hamburgers really come from Hamburg? This may still be a matter of debate, but the popularity of American-style burger joints not just in Hamburg but all over Germany, is clear. Germany’s top two fast food companies are both burger chains. One of them is BURGER KING®, a global brand that welcomes more

BigQuery Helps Insurance Firms Leverage Previous Storm Data for Better Pricing Insights
It may be surprising to know that U.S. natural catastrophe economic losses totaled $119 billion in 2020, and 75% (or $89.4B) of those economic losses were caused by severe storms and cyclones. In the insurance industry, data is everything. Insurers use data to influence underwriting, rating, pricing, forms, marketing, and

BigQuery Now Supports Multi-statement Transactions
Mercury, the Roman god of commerce, is often depicted carrying a purse, symbolic of business transactions, wearing winged sandals, illustrating his abilities to move at great speeds. Transactions power the world’s business systems today, ranging from millions of packages moving worldwide tracked in real time by logistics companies to global
