





6796
Of your peers have already watched this video.
2:30 Minutes
The most insightful time you'll spend today!
What is BigQuery?
BigQuery is Google Cloud’s enterprise data warehouse designed to help you ingest, store, analyze, and visualize big data with ease.
Organizations rely on data warehouses to aggregate data from disparate sources, process it, and make it readily available for data analysis that supports their strategic decision-making.
You can ingest data into BigQuery either through batch uploading or streaming data directly to deliver real-time insights.
As a fully-managed data warehouse, Google takes care of the infrastructure so you can focus on analyzing your data up to petabyte scale.
BigQuery supports the same Structured Query Language, or SQL, for analyzing your data, which you may be familiar with if you’ve worked with ANSI-compliant relational databases in the past.
If you’re looking to create machine learning models using your enterprise data, you can do so with BigQuery ML.
With only a few lines of SQL, you can train and execute models on your BigQuery data without needing to move it around.
When it comes time to visualize your data, BigQuery integrates with Looker, as well as several other business intelligence tools across our partner ecosystem.
Now, how do you use BigQuery?
Luckily, it’s straightforward to get up and running with BigQuery.
After creating a GCP project, you can immediately start querying public data sets, which Google Cloud hosts and makes available to all BigQuery users, or you can load your own data into BigQuery to analyze.
Interacting with BigQuery to load data, run queries, or even create ML models can be done in three different ways.
First is by using the UI and the Cloud Console. Second is by using the BigQuery command line tool. And third is by making calls to the BigQuery API, using client libraries available in several languages.
BigQuery is integrated with Google Cloud’s Identity and Access Management Service so you can securely share your data and analytical insights across the organization.
What does it cost to use BigQuery?
With BigQuery, you pay for storing and querying data and streaming inserts.
Loading and exporting data are free of charge.
Storage costs are based on the amount of data stored and have two rates based on how often the data is changing.
Query costs can be either on demand, meaning you are charged per query by the amount of data processed, or flat rate for customers who want to purchase dedicated resources.
5199
Of your peers have already watched this video.
5:00 Minutes
The most insightful time you'll spend today!
How to Build and Maintain Spark and Hadoop Clusters Quickly, Easily and Inexpensively
How often have you struggled to create Spark and Hadoop clusters only to have them become unstable?
Building and maintaining clusters that are the building blocks of big data analytics should not be a time-consuming, repetitive, and expensive process. But with the current set of tools, it often is.
Google Cloud Dataproc solves this. It is a fast, easy-to-use, fully-managed cloud service for running Spark and Hadoop clusters in a simple, more cost-efficient way.
Operations that used to take hours or days take now seconds or minutes instead, and you pay only for the resources you use (with per-second billing).
Watch this five-minute demo to find out how—with just a few clicks—you can set up clusters that build and heal themselves. You’ll find out how to creating a large Dataproc cluster with preemptible VMs, which help run large clusters at a low total cost.
Google Cloud Tools Help U.S. Forest Department Generate Years of Insights into Earth’s Natural Resources
5011
Of your peers have already read this article.
3:00 Minutes
The most insightful time you'll spend today!
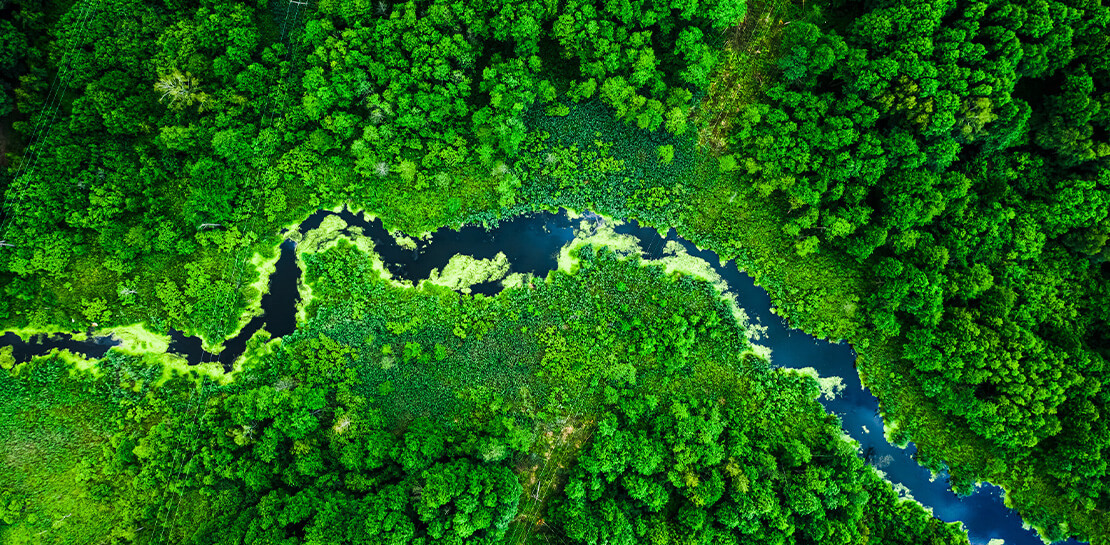
For 117 years, the U.S. Department of Agriculture’s Forest Service has been a steward of America’s forests, grasslands, and waterways. It directly manages 193 million acres and supports sustainable management on a total of 500 million acres of private, state, and tribal lands. Its impact reaches far beyond even that, offering its research and learning freely to the world.
At Google, we’re big admirers of the Forest Service’s mission. So we were thrilled to learn in 2011 that its scientists were using Google Earth Engine, our planetary-scale platform for Earth Science data and analysis, to aid its research, understanding, and effectiveness. In the years since, Google has worked with the Forest Service to meet its unique requirements for visual information about the planet. Using both historical and current data, the Forest Service built new products, workflows, and tools that help more effectively and sustainably manage our natural resources. The Forest Service also uses Earth Engine and Google Cloud to study the effects of climate change, forest fires, insects and disease, helping them create new insights and strategies.
Besides gaining newfound depths of insight, the Forest Service has also sped up its research dramatically, enabling everyone to do more. Using Google Cloud and Earth Engine, the Forest Service reduced the time it took to analyze 10 years worth of land-cover changes from three months to just one hour, using just 100 lines of code. The agency built new models for coping with change, then mapped these changes over time, in its Landscape Change Monitoring System (LCMS) project.
Emergency responders can now work better on new threats that arise after wildfires, hurricanes, and other natural disasters. Forest health specialists can detect and monitor the impacts of invasive insects, diseases, and drought. More Forest Service personnel can use new tools and products within Earth Engine, thanks to numerous training and outreach sessions within the Forest Service.
Researchers elsewhere also benefited when the Forest Service created new toolkits, and posted them to GitHub for public use. For example, there’s geeViz, a repository of Google Earth Engine Python code modules useful for general data processing, analysis, and visualization.
This is only the start. Recently, the Forest Service started using Google Cloud’s processing and analysis tools for projects like California’s Wildfire and Forest Resilience Action Plan. Forest Service researchers also use Google Cloud to better understand ecological conditions across landscapes in projects like Fuelcast, which provides actionable intelligence for rangeland managers, fire specialists, and growers, and the Scenario Investment Planning Platform for modeling local and national land management scenarios.
The Forest Service is a pioneer in building technology to help us better understand and care for our planet. With more frequent imaging, rich satellite data sets, and sophisticated database and computation systems, we can view and model the Earth as a large-scale dynamic system.
We are honored and excited to respond to the unique set of requirements of the scientists, engineers, rangers, and firefighters of the USFS, and look forward to years of learning about — and better caring for — our most precious resources.
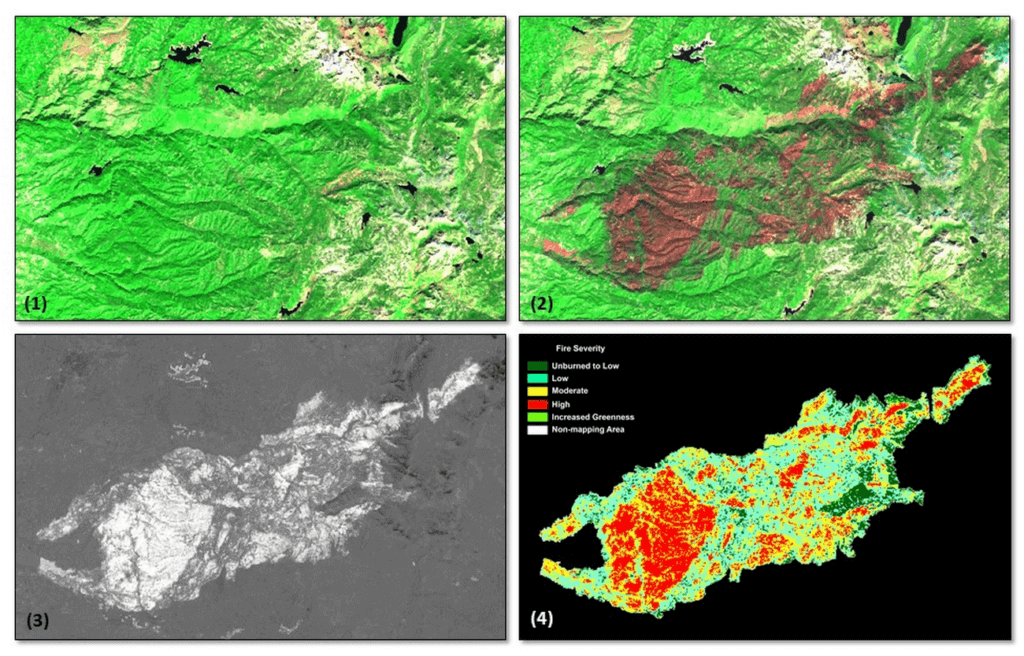
*Image 1: The USDA Forest Service (USFS) Geospatial Technology and Applications Center (GTAC) uses science-based remote sensing methods to characterize vegetation and soil condition after wildland fire events. The results are used to facilitate emergency assessments to support hazard mitigation, to inform post-fire restoration planning, and to support the monitoring of national fire policy effectiveness. GTAC currently conducts these mapping efforts using long-established geospatial workflows. However, GTAC has adapted its post-fire mapping and assessment workflows to work within Google Earth Engine (GEE) to accommodate the needs of other users in the USFS. The spatially and temporally comprehensive coverage of moderate resolution multispectral data sources (e.g., Landsat, Sentinel 2) and analytical power provided by GEE allows users to create geospatial burn severity products quickly and easily. Box 1 shows a pre-fire Sentinel-2 false color composite image. Box 2 shows a post-fire Sentinel-2 false color composite image with the fire scar apparent in reddish brown. Box 3 shows a differenced Normalized Burn Ratio (dNBR) image showing the change between the pre- and post-fire images in Boxes 1 and 2. Box 4 shows a thresholded dNBR image of the burned area with four classes of burn severity (unburned to high severity), which is the final output delivered to forest managers.
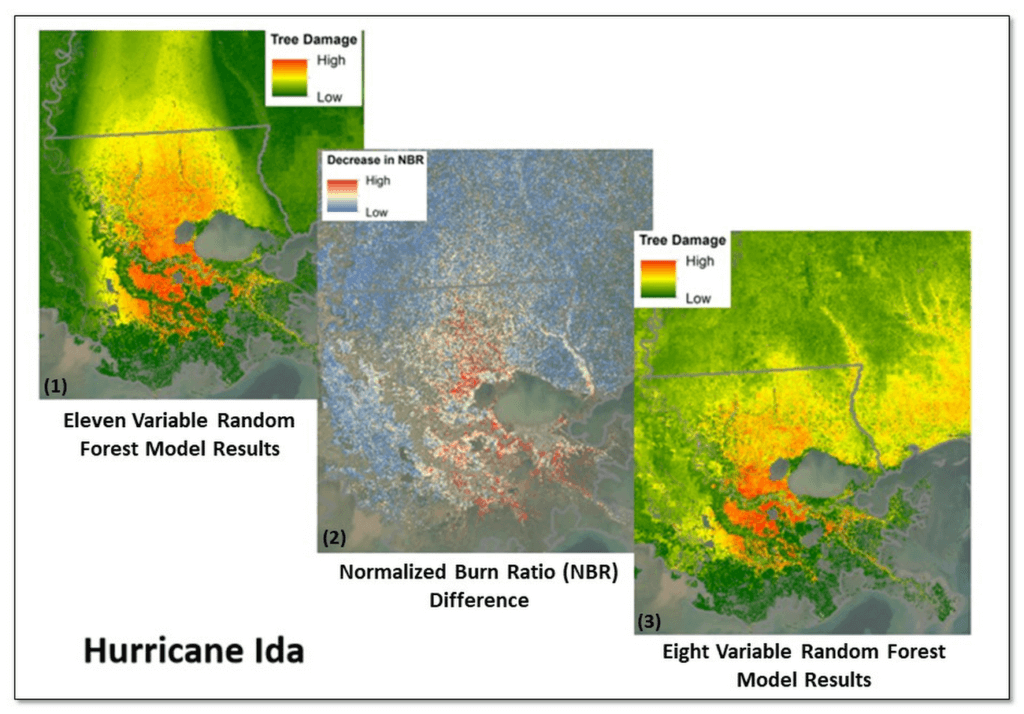
*Image 2: Leveraging Google Earth Engine (GEE), the USDA Forest Service (USFS) Geospatial Technology and Applications Center (GTAC) and USFS Region 8, developed the Tree Structure Damage Impact Predictive (TreeS-DIP) modeling approach to predict wind damage to trees resulting from large hurricane events and produce spatial products across the landscape. TreeS-DIP results become available within 48 hours following landfall of a large storm event to allow allocation of ground resources to the field for strategic planning and management. Boxes 1 and 3 above show TreeS-DIP modeled outputs with varying data inputs and parameters. Box 2 shows changes in greenness (Normalized Burn Ratio; NBR) that was measured with GEE during the recovery from Hurricane Ida and is shown as a visual comparison to the rapidly available products from TreeS-DIP.
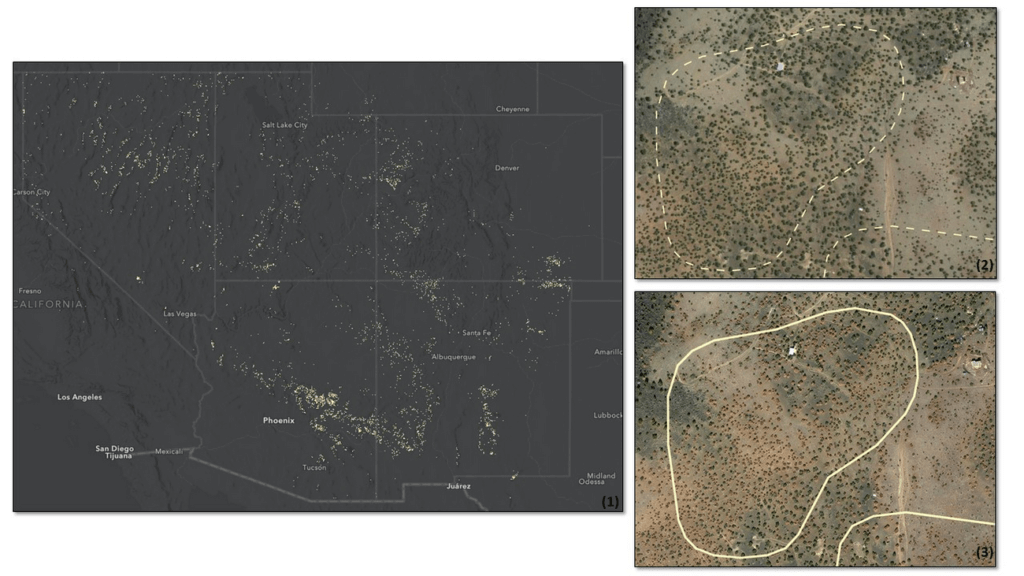
*Image 3: Severe drought conditions across the American West prompted concern about the health and status of pinyon-juniper woodlands, a vast and unique ecosystem. In a cooperative project between the USDA Forest Service (USFS) Geospatial Technology and Applications Center (GTAC) and Forest Health Protection (FHP), Google Earth Engine (GEE) was used to map pinyon pine and juniper mortality across 10 Western US States. The outputs are now being used to plan for future work including on-the-ground efforts, high-resolution imagery acquisitions, aerial surveys, in-depth mortality modeling, and planning for 2022 field season work.
Box 1 contains remote sensing change detection outputs (in white) generated with GEE, showing pinyon-juniper decline across the Southwestern US. Box 2 shows NAIP imagery from 2017 with, with box 3 showing NAIP imagery from 2021. NAIP imagery from these years shows trees changing from healthy and green in 2017 to brown and dying in 2021. In addition, box 2 and box 3 show change detection outputs from Box 1 for a location outside of Flagstaff, AZ converted to polygons (in white). The polygon in box 2 is displayed as a dashed line to serve as a reference, while the solid line in box 3 shows the measured change in 2021. Converting rasters to polygons allows the data to be easily used on tablet computers, as well as the ability to add information and photographs from field visits.

5432
Of your peers have already downloaded this article
14:30 Minutes
The most insightful time you'll spend today!
To make great products: do machine learning like the great engineer you are, not like the great machine learning expert you aren’t.
Most of the problems you will face are, in fact, engineering problems. Even with all the resources of a great machine learning expert, most of the gains come from great features, not great machine learning algorithms. So, the basic approach is:
- Make sure your pipeline is solid end to end.
- Start with a reasonable objective.
- Add common-sense features in a simple way.
- Make sure that your pipeline stays solid.
This approach will work well for a long period of time. Diverge from this approach only when there are no more simple tricks to get you any farther. Adding complexity slows future releases.
Once you’ve exhausted the simple tricks, cutting-edge machine learning might indeed be in your future. See the section on Phase III machine learning projects.
This document is arranged as follows:
- The first part should help you understand whether the time is right for building a machine learning system.
- The second part is about deploying your first pipeline.
- The third part is about launching and iterating while adding new features to your pipeline, how to evaluate models and training-serving skew.
- The final part is about what to do when you reach a plateau.
- Afterwards, there is a list of related work and an appendix with some background on the systems commonly used as examples in this document.
4567
Of your peers have already watched this video.
32:30 Minutes
The most insightful time you'll spend today!
Technical deep dive on Looker: The enterprise BI solution for Google Cloud
Thousands of users accessing petabytes of data on a daily basis: This is a challenging proposition for enterprises, without a doubt.
But Looker makes it possible. Beyond just accessing data though, Looker’s platform transforms your company’s relationship with data.
Go under the hood of Looker, with Olivia Morgan, Enterprise CE, Looker, to see how LookML empowers developers to take advantage of powerful data warehouses like BigQuery and ultimately enhance the workflows of end users.
She also takes a deep dive into LookML’s ability to use Google Cloud Functions and Search API to enhance dashboards, leverage BQML within Looker’s modeling layer to give users access to forecasts, tie in BigQuery’s public datasets to add richness to analysis, and show off LookML’s ability to handle nested tables for faster performance on transaction analysis all through a complete end to end demo.
2800
Of your peers have already watched this video.
41:30 Minutes
The most insightful time you'll spend today!
Real-world Data Integration Patterns
Learn the basics of Google Cloud Data Integration. How do you go from basic, hardcoded data pipelines to making your solution is dynamic and reusable? How do you parameterize your pipelines? What is the difference between parameters and variables, and when should you use them?
Nidhi Modh, Product Manager, Google Cloud, answers all these questions and more. He contrasts practices with traditional views of data integration, the benefits and the challenges.
Explore some common design patterns for moving and orchestrating data, including incremental and metadata-driven pipelines. Discover best practices and lessons learned and highlight common data engineering best practices for building scalable and high-performing data integration solutions.
More Relevant Stories for Your Company

Guide for Measuring Cloud Spanner Performance for Your Custom Workload
Database migration to a new database platform or technology can be daunting for various reasons. One of the common concerns is database performance. It is hard to evaluate database performance early in the evaluation cycle without performing actual data migration and application changes. This becomes even more important in the

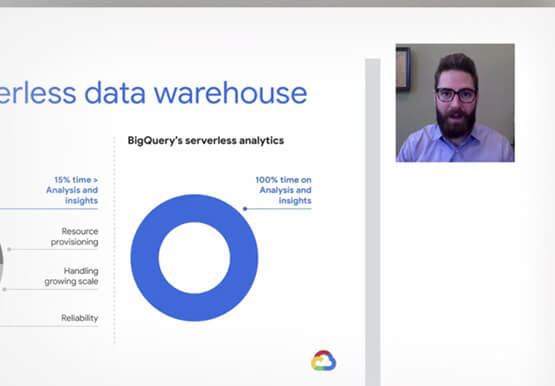

Don’t sweat the big stuff. Make it Google’s problem
Need to interpolate new time series data values over 5 billion rows? Don’t reach for python. Make that Google’s problem and do it in BigQuery. Need to aggregate petabytes of geospatial data across arbitrary polygons and put it on a map for analysis? Make that Google’s problem and use BQ-GIS.

Speech Analytics and AI: Leverage Every Customer Interaction as a Data Point
Contact centers can transform customer experience using AI-driven speech analytics to evaluate every customer interaction and use it as a 'data point' to identify key patterns, enquiries, pain points, reviews and feedback to enhance customer experience with real-time, personalized recommendations. Knowlarity's AI-based cloud telephony solutions for businesses built with Google
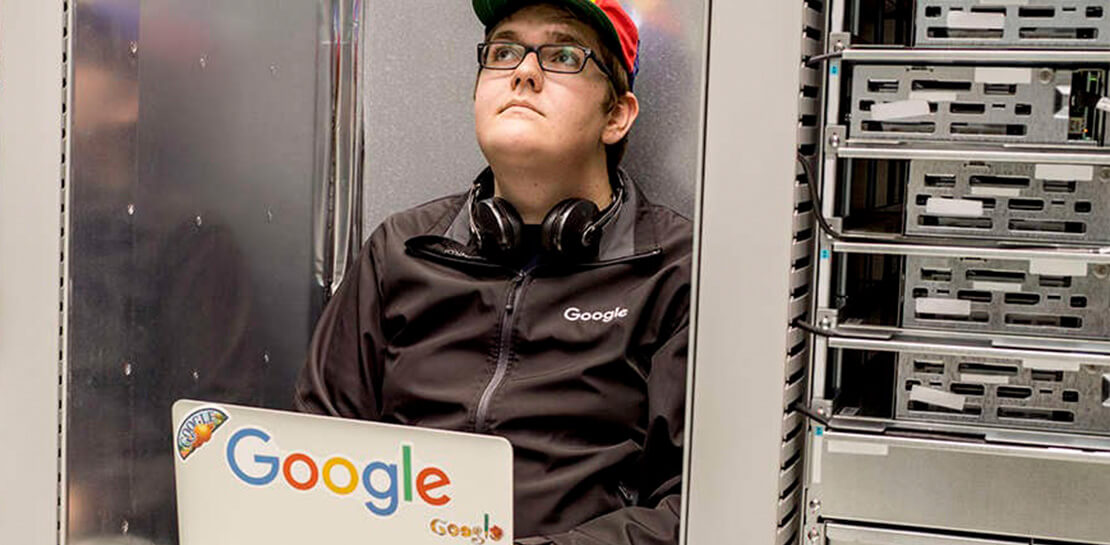
Google Cloud Data Heroes Series: Honoring Data Practitioner’s Journey and Learning with GCP
Google Cloud Data Heroes is a series where we share stories of the everyday heroes who use our data analytics tools to do amazing things. Like any good superhero tale, we explore our Google Cloud Data Heroes’ origin stories, how they moved from data chaos to a data-driven environment, what
