





Guide for Measuring Cloud Spanner Performance for Your Custom Workload

4834
Of your peers have already read this article.
3:00 Minutes
The most insightful time you'll spend today!
Database migration to a new database platform or technology can be daunting for various reasons. One of the common concerns is database performance. It is hard to evaluate database performance early in the evaluation cycle without performing actual data migration and application changes. This becomes even more important in the case of Cloud Spanner where modernization is required at both the database and application layers.
The traditional approach to evaluate database performance is to deploy the application and database together, migrate historical data to the new database and then simulate load tests by running an application on the new database. Doing all this for an early performance evaluation of Cloud Spanner may feel like a lot of effort.
In this post, we will explore a middle ground to performance testing using JMeter. Performance test Cloud Spanner for a custom workload before making application code changes and executing data migration. More detailed step-by-step guide is published here.
Goals
- Estimate the number of Cloud Spanner nodes needed (and get a cost estimate).
- Performance test the most frequently used set of queries and transactions.
- Demonstrate the ability to scale horizontally.
- Better understand the optimizations needed for schema and sql queries.
- Determine latency of DML operations.
Limitations
- You cannot test using non-java client libraries.
- It is more complex to test non-jdbc compliant features like mutations, parallel reads etc.
Preparing for performance tests
- Identify top SQL queries, latency, frequency / hour and avg number of rows returned or updated for each. This information will also serve as a baseline for the current system.
- Determine Cloud Spanner region / multi-region deployment. Ideally, load should be generated from the Cloud Spanner instance’s leader region for minimum latency and best performance. Read Demystifying Cloud Spanner multi-region configurations for more details on various configurations of Cloud Spanner.
- Estimate the number of Cloud Spanner nodes required for a given workload based on (step 1). It is recommended to have a minimum of 2 nodes for linear scaling.
Note: Peak performance numbers of regional performance and multi regional performance are published. It is based on a 1KB single row transaction with no secondary indexes. - Request quota for Cloud Spanner nodes on a given region / multi-region. It can take up to 1 business day.
Setting up Cloud Spanner
Creating the schema for Cloud Spanner
You can use the following tools to generate a schema for Cloud Spanner if you are migrating from the following source databases. Alternatively, you can model the schema manually. Schema design has a huge performance impact, hence it is recommended to review the schema very carefully.
| Source | Target | Tool(s) | |
| 1. | MySQL / MariaDB | Cloud Spanner | HarbourBridgeStriim |
| 2. | Postgresql | Cloud Spanner | HarbourBridgeStriim |
| 3. | Oracle | Cloud Spanner | Striim |
| 4. | SQL Server | Cloud Spanner | Striim |
Note: Manual review and tuning of schema will be needed to optimize and mitigate potential hotspots. You will need to keep in mind schema design best practices when modeling your schema.
Populating seed data into Cloud Spanner
Performance of a database depends on the amount of data present. Existing data (and indexes) determines how much data is scanned on select queries and therefore performance. Hence, it is important to seed data into Cloud Spanner before performance testing.
For most realistic results, data should be migrated from an existing production source. Sometimes you cannot do that due to schema changes. One way is to utilize a custom ETL job to export and transform data and then import into Cloud Spanner. Another alternative could be to mock seed data using JMeter(More details in later sections).
JMeter performance tests
Writing Tests
JMeter will interact with Cloud Spanner just like your application. It will perform DML operations the same way as your application does. Hence, tests need to simulate production like transactions. For example if a transaction is made up of insert and/or update statements in several tables within transaction boundaries then JMeter should mimic the same.
JMeter has the following hierarchy:
Test Plan > Thread Group(s) > Sampler(s) (aka test)
Test plan is a top level component. It can contain global properties and libraries (like jdbc driver etc).
Thread Group(s) are representative of a database transaction. It contains one or more sampler(s). All the samplers within a thread group execute serially.
Sampler(s) should represent a single DML call. If your transaction needs to have multiple dml calls, you should create multiple samplers. Typically you will use JDBC Sampler for database calls. You can also use JSR 223 Sampler as described here, in case you need to use mutations or parallel reads etc. Results from one sampler can be passed to the next, as in real world application.
Executing tests and collecting results
JMeter tests should be executed as physically close to Cloud Spanner instances as possible to minimize network latency. Therefore it is best to execute them from Compute Engine (via private service connect) from the same region as the Cloud Spanner instance. In-case of multi region Cloud Spanner, GCE instances should be created in the Leader Region of the Cloud Spanner instance for lowest network latency.
JMeter should be executed via command line, it is a CPU intensive application so make sure you have allocated enough resources on the VM.
Refer to the Cloud Spanner monitoring dashboard to ensure that your Cloud Spanner instance’s CPU utilization is at or below the recommended values. In addition, use introspection tools to investigate performance issues with your database.
You might need to optimize your queries (add indexes) and re-execute tests in multiple waves to tune the performance as needed.
Try it yourself
Follow a detailed step by step tutorial on Measure Cloud Spanner performance test using JMeter to test Cloud Spanner performance yourself.
redBus: Mastering Big Data with Google BigQuery

5393
Of your peers have already read this article.
2:30 Minutes
The most insightful time you'll spend today!
In 2006, online travel agency redBus introduced internet bus ticketing in India, unifying tens of thousands of bus schedules into a single booking operation. (Think of it as Expedia for bus booking.) Using BigQuery, redBus crunches terabytes of booking and inventory data in mere seconds and at a fraction of the cost of other big data services. BigQuery also helps engineers fix glitches quickly, minimize lost sales, and improve customer service.
Challenge
Executives at the Bangalore-based redBus needed a powerful tool to analyze booking and inventory data across their system of hundreds of bus operators serving more than 10,000 routes. They considered using clusters of Hadoop servers to process the data but decided the system would take too much time to set up and would require a specialized staff to maintain it. It also would not provide the lightning-fast analysis they needed.
“It would have taken at least a couple of hours to analyze anything,” says Pradeep Kumar, a technical architect at redBus. “Crunching very large data sets would have been a day’s job. We needed something more powerful to get the real-time analysis we were looking for.”
Solution
Kumar and his colleagues learned about BigQuery and realized it was the right match for their data processing needs. The web-based service, which enables companies to analyze massive datasets using Google’s data processing infrastructure, is easy to set up and manage since its simple, SQL-like query language doesn’t require complex technology or specialized personnel. It also has low overhead costs.
The redBus team uses BigQuery as part of an intricate data collection and analysis process. Applications hosted on a range of servers continually pump information related to customer searches, seat inventory, and bookings into a centralized data collection system. Engineers upload the data to BigQuery, which provides answers to complex queries within seconds. For example, BigQuery helps redBus staff:
- Learn how many times customers searched for seats and found none or very few available, indicating more seats should be added to a route
- Investigate decreases in bookings and notify engineers if a technical problem is the cause
- Identify server problems by quickly analyzing data related to server activity
Results
BigQuery provides near real-time data analysis capabilities at 20% of the cost of maintaining a complex Hadoop infrastructure. Queries that would have required a day to analyze on a Hadoop framework take less than 30 seconds using Google’s web-based service.
“We explored several data analytics solutions. Nothing comes remotely close to the sheer power of Google BigQuery,” Kumar says. “It made large-scale data collection and crunching possible with little effort, which has translated to a significant business advantage.”
Google Cloud Platform results
- Analyzes data sets as large as 2 terabytes in less than 30 seconds using a simple, SQL-like language
- Saves time analyzing technical problems and customer booking trends
- Spends 80% less than they would have on a Hadoop infrastructure and avoids setting up and maintaining a complex infrastructure in-house
- Strengthens the company by improving customer service and engineering quality
The fast insights gained through BigQuery are also making redBus a stronger company. By minimizing the time it takes staff members to solve technical problems, BigQuery has helped improve customer service and reduce lost sales.
“Getting to the root of problems used to be really time-consuming,” Kumar says. “By the time we figured it out, customers might have given up. Now if there are booking problems, BigQuery helps us understand the reason right away. Choosing Google BigQuery was the right decision for our company.”
“It’s an Astonishing Difference”: What Data Operation Execs say About Google Cloud’s Data Warehouse

5654
Of your peers have already read this article.
8:30 Minutes
The most insightful time you'll spend today!
The popularity of meal kit delivery services has surged in recent years as consumer attitudes toward home cooking and grocery shopping have shifted. As a pioneer in the category, Blue Apron helps its customers create incredible home cooking experiences by sending culinary-driven recipes with high-quality ingredients and step-by-step instructions straight to customers’ doors. Blue Apron also offers a monthly wine subscription service and a la carte culinary tools and products through its marketplace.
If that sounds simple, it isn’t.
Ingredients for the meal kits must be sourced at the right time, quality, and price. Orders must be packed efficiently and in exactly the right proportions. Most importantly, meal kits must be delivered to the customer fresh and on time.
To meet these criteria and make data meaningful and intuitive to its managers, one of the tools Blue Apron relies on is Looker, an analytics platform that lets business users explore data and ask sophisticated questions using familiar terms. Looker integrates its solution with Google Cloud Platform to help customers modernize their analytics.
“The combination of Looker and Google BigQuery is powerful, allowing us to get data-hungry analysts essential information much faster. Because we choose to pay by the query, it’s also flexible and cost effective—plus storage is cheap, so we can just put data in and query what we need.”
—Sam Chase, Tech Lead, Data Operations, Blue Apron
Blue Apron previously used Looker with a single database instance hosted on another cloud provider. As data volumes grew and queries became more complex, it became difficult to scale. Blue Apron’s only options were choosing ever-larger server classes and increasing storage throughput by purchasing a higher number of provisioned IOPS. To improve speed, scalability, and cost efficiency, Blue Apron moved its data warehouse to Google BigQuery.
“The combination of Looker and Google BigQuery is powerful, allowing us to get data-hungry analysts essential information much faster,” says Sam Chase, Tech Lead, Data Operations at Blue Apron. “Because we choose to pay by the query, it’s also flexible and cost effective—plus storage is cheap, so we can just put data in and query what we need.”
“After we moved to Google BigQuery, query time was reduced exponentially. It’s an astonishing difference, allowing us to run 300 queries per day.”
—Sam Chase, Tech Lead, Data Operations, Blue Apron
The analytics platform of the future
When you’re making business decisions about a customer’s dinner, speed matters. Looker takes full advantage of the power of Google BigQuery, making it easy to build a data exploration platform.
Blue Apron’s applications publish event data to Kafka—approximately 140 million events per day—and data is then streamed into Google BigQuery, which performs lightning-fast queries on both streamed and static data. Now, business users and analytics teams can make decisions based on near real-time information in Looker, instead of waiting until the next business day for results.
“After we moved to Google BigQuery, query time was reduced exponentially. It’s an astonishing difference, allowing us to run 300 queries per day,” says Sam.
Previously, Blue Apron spent up to a week out of every month optimizing its data warehouse to attempt to improve query performance. With Google BigQuery, all maintenance is handled by Google, reclaiming 25% of up to two engineers’ time. Even when multiple people are using Looker concurrently, query performance never degrades and storage never runs out.
“Because Google BigQuery is architected as a giant, shared cluster, growth is smooth,” says Lloyd Tabb, Founder and CTO of Looker. “Like a race car going from 0 to 120 mph, there are no shift points, just smooth acceleration. To us, it looks like the future.”
An empowering, integrated toolset
Looker takes advantage of aggressive caching and support for date-based table partitioning in Google BigQuery to increase performance, simplify the load process, and improve data manageability. By partitioning data by time, Blue Apron can also take advantage of better long-term storage pricing without sacrificing query performance. When using Google BigQuery with Looker, analysts can easily see how much data is going to be scanned before each query is run.
Blue Apron is also using Looker for Google BigQuery Data Transfer Service to provide actionable analytics for all of the company’s Google marketing data from Google AdWords and DoubleClick by Google in one place to understand campaign performance across channels, saving its data operations team months of work. Using Looker Blocks, marketers can quickly make sense of the data with reports and dashboards, and set alerts when campaign performance hits certain thresholds.
“Everyone at Blue Apron is excited about using Google BigQuery with Looker. Business users and marketers are more empowered to look for answers, instead of waiting for analytics teams. Because users know they can get results rapidly, our business processes are evolving and improving.”
—Sam Chase, Tech Lead, Data Operations, Blue Apron
Looker Blocks for Google AdWords and DoubleClick by Google provide all the analysis you’d get straight from the Google console, plus additional value-add analysis that’s impossible to replicate without SQL. Complex metrics such as ROI on ad spend, flexible multi-touch attribution, and predictive lifetime value empower marketers with a better understanding of their customers and where to spend their next dollar.
In addition to these turnkey dashboards and pieces of analysis, marketers can customize views to meet their unique needs and workflows. These capabilities help the Blue Apron marketing team make decisions regarding the allocation of spend to maximize customer acquisition and retention.
“Everyone at Blue Apron is excited about using Google BigQuery with Looker,” says Sam. “Business users and marketers are more empowered to look for answers, instead of waiting for analytics teams. Because users know they can get results rapidly, our business processes are evolving and improving.”
For data cleansing and transformation, Blue Apron uses Google Cloud Dataproc to run fully managed Apache Spark clusters on Google Cloud Platform. It’s also leveraging Google BigQuery integration with G Suite to bring data into Google Sheets for further distribution and analysis.
“Transferring data between Google tools is fast because it all happens on the Google network,” says Sam. “We can pull data from Google BigQuery, run transformations with Spark, and then write it back to Google BigQuery. That’s very helpful in providing our business users and data analysts with the richest, most current data.”
A perfect match for better insights
As Blue Apron seeks to expand its reach and deepen its engagement with customers, it is making Google BigQuery and Looker available to more users, providing a high-quality interactive analytics experience. “Our ability to pull a lot of data in and compute fast results affects everyone in our company,” says Sam. “Using Google BigQuery and Looker to iterate quickly and build new models to make our operations more efficient will directly impact our customers.”
For Looker, Google BigQuery represents the next step in data warehouse evolution. “Google BigQuery is a perfect match for Looker, combining easy setup with near infinite scale-out and elasticity,” says Lloyd. “People can make smarter decisions faster that directly benefit their business and customers.”
6596
Of your peers have already watched this video.
8:00 Minutes
The most insightful time you'll spend today!
Hospitals Can Offer Interconnected Patient Experiences Using Google’s Natural Language Services
Machine Learning (ML) in healthcare helps extract data from conversations, medical records, forms, research reports, insurance claims and other documents across the care value-chain to help care providers have a holistic view of their patients to draw insights for diagnoses and treatments. With Natural Language Processing(NLP), healthcare organizations can program computers and systems to process and analyse large volumes of human communication in form of spoken texts, written documentation and utterances. Watch the video to learn how the healthcare community can leverage Google’s NLP services to process structured and unstructured data to offer interconnected experiences for patients.
Beyond Traditional Learning: AI-based Online Learning Platform and Google Cloud Solutions Push Learners to Get Ahead

10352
Of your peers have already read this article.
1:30 Minutes
The most insightful time you'll spend today!
The combination of a vital need for IT experts among businesses and a digital skills gap is making lifelong learning increasingly critical. Beyond professional development, learning new skills offers additional rewards from building peer connections to boosting your creativity. That’s why in 2020 Krishna Deepak Nallamilli and I launched KIMO.ai to reimagine how people approach learning, especially in developing markets. Our team is building the artificial intelligence needed to generate individual learning paths through a wide range of quality digital learning content.
Google Cloud and its Startup Program have been instrumental in connecting our team with the tools, people, processes, and best practices to grow our business.
Existing learning platforms lack engagement
Outside of traditional education settings, massive open online learning courses (MOOCs)—often modeled after university courses—can provide a flexible and affordable way to upskill or reskill. But the vast majority of people who participate in MOOC programs fail to complete courses. Based on our research, the challenge with existing learning platforms is a lack of engagement, primarily caused by limited direction on which skills to learn, whether AI, fintech, blockchain, or other in-demand disciplines.
We’ve also received feedback that many corporate learning management systems–developed as online training systems to upskill employees–tend to be poorly designed and time-consuming to use.
Overall, a significant challenge with most existing learning platforms is that they’re generic. For example, suppose you’re interested in learning about AI. In that case, you need AI-related coursework that applies to your industry and the job you want because AI in medicine is vastly different from AI in financial services. Today’s online learning options typically take a one-size-fits-all approach and fail to capture the nuances of what learners really need to get ahead.
Building a future-proof learning platform
The commitment to highly personalized, accessible learning inspired KIMO.ai, a platform that we believe is the future of education. Depending on your goals, current skills, location, and other factors, our AI-based platform will identify which coursework (and where to find those classes) to build the skills you need. The more personalized, relevant learning recommendations even take into account people’s preferences for podcasts, MOOCs, books, articles, videos, courses, publications, and more.
In a mix of cooperation and competition we call “coopetition,” KIMO.ai will regularly recommend courses from other established online learning systems if, based on our automated assessment, it’s the best option for a learner. There’s also the option to access free content only.
Google cultural alignment fosters trust
Our platform started with one developer exploring NLP models and Google APIs. As we’ve grown our team and launched our beta to 110,000 users in developing markets, we discovered there is a lot of interest in our platform, and we believe we can make a significant impact. In feedback forums, we also learned that we need to focus our efforts on the mobile experience to improve engagement since 99% of the beta testers use mobile devices.
Beyond our team’s high level of trust in Google Cloud solutions, our team also appreciates the cultural alignment with Google. We value Google’s developer-centric approach and rely on tools like Dataflow for batch data processing and Cloud TPU to reliably run machine learning models with AI services on Google Cloud. We also build all of our deployments on Google Kubernetes Engine (GKE), which makes it easy to manage all our containerized workloads
On the front end, Google App Engine makes it easy to deploy apps and experiment, and it integrates seamlessly with Firebase for authentication and more. BigQuery is our serverless data warehouse that efficiently scales to support the millions of articles, videos, and other learning resources we need to analyze to provide the targeted coursework recommendations our learners require.
As we grow our business having a network of trusted advisors is also extremely valuable. By working closely with DoIT International, the 2020 Google Cloud Global Reseller Partner of the Year, our team has access to their cloud, Kubernetes, and machine learning expertise. DoIT has already helped us quickly resolve IT issues and create analytics dashboards that give us insights to continually enhance our services.
Building for a growing industry
The dynamic edtech market is growing rapidly and estimated to become an $11B industry by 2025. We’re proud to be part of the next wave of personalized education that has the potential to empower people in developing markets and beyond to grow their skills with coursework tailored to their exact needs and how they like to learn. This year, we will deliver our platform to at least 400,000 more people. We’re excited to see how they use it and where it takes them.
If you want to learn more about how Google Cloud can help your startup, visit our Startup Program application page here to get more information about our program, and sign up for our communications to get a look at our community activities, digital events, special offers, and more.
Looking for a Cloud Data Warehouse? Find out Why Forrester Thinks Google BigQuery is a Leader

4487
Of your peers have already read this article.
4:30 Minutes
The most insightful time you'll spend today!
We are thrilled to announce that Google has been named a Leader in The Forrester Wave™: Cloud Data Warehouse, Q1 2021 report. For more than a decade, BigQuery, our petabyte-scale cloud data warehouse, has been in a class of its own. We’re excited to share this recognition and we want to thank our strong community of customers and partners for voicing their opinion. We believe this report validates the alignment of our strategy with our customers’ analytics needs.
“Customers like Google’s frequency of data warehouse releases, business value, future proof architecture, high-end scale, geospatial capabilities, strong AI/ML capabilities, good security capabilities, and broad analytical use cases,” according to the Forrester report. Today’s data leaders require a data warehousing platform that provides both depth and breadth and with BigQuery, organizations are able to unlock deeper data science and machine learning capabilities while promoting data democratization and providing the highest levels of availability.
Google BigQuery: 5 out of 5!
Forrester gave Google BigQuery a score of 5 out of 5 across 19 different criteria, including:
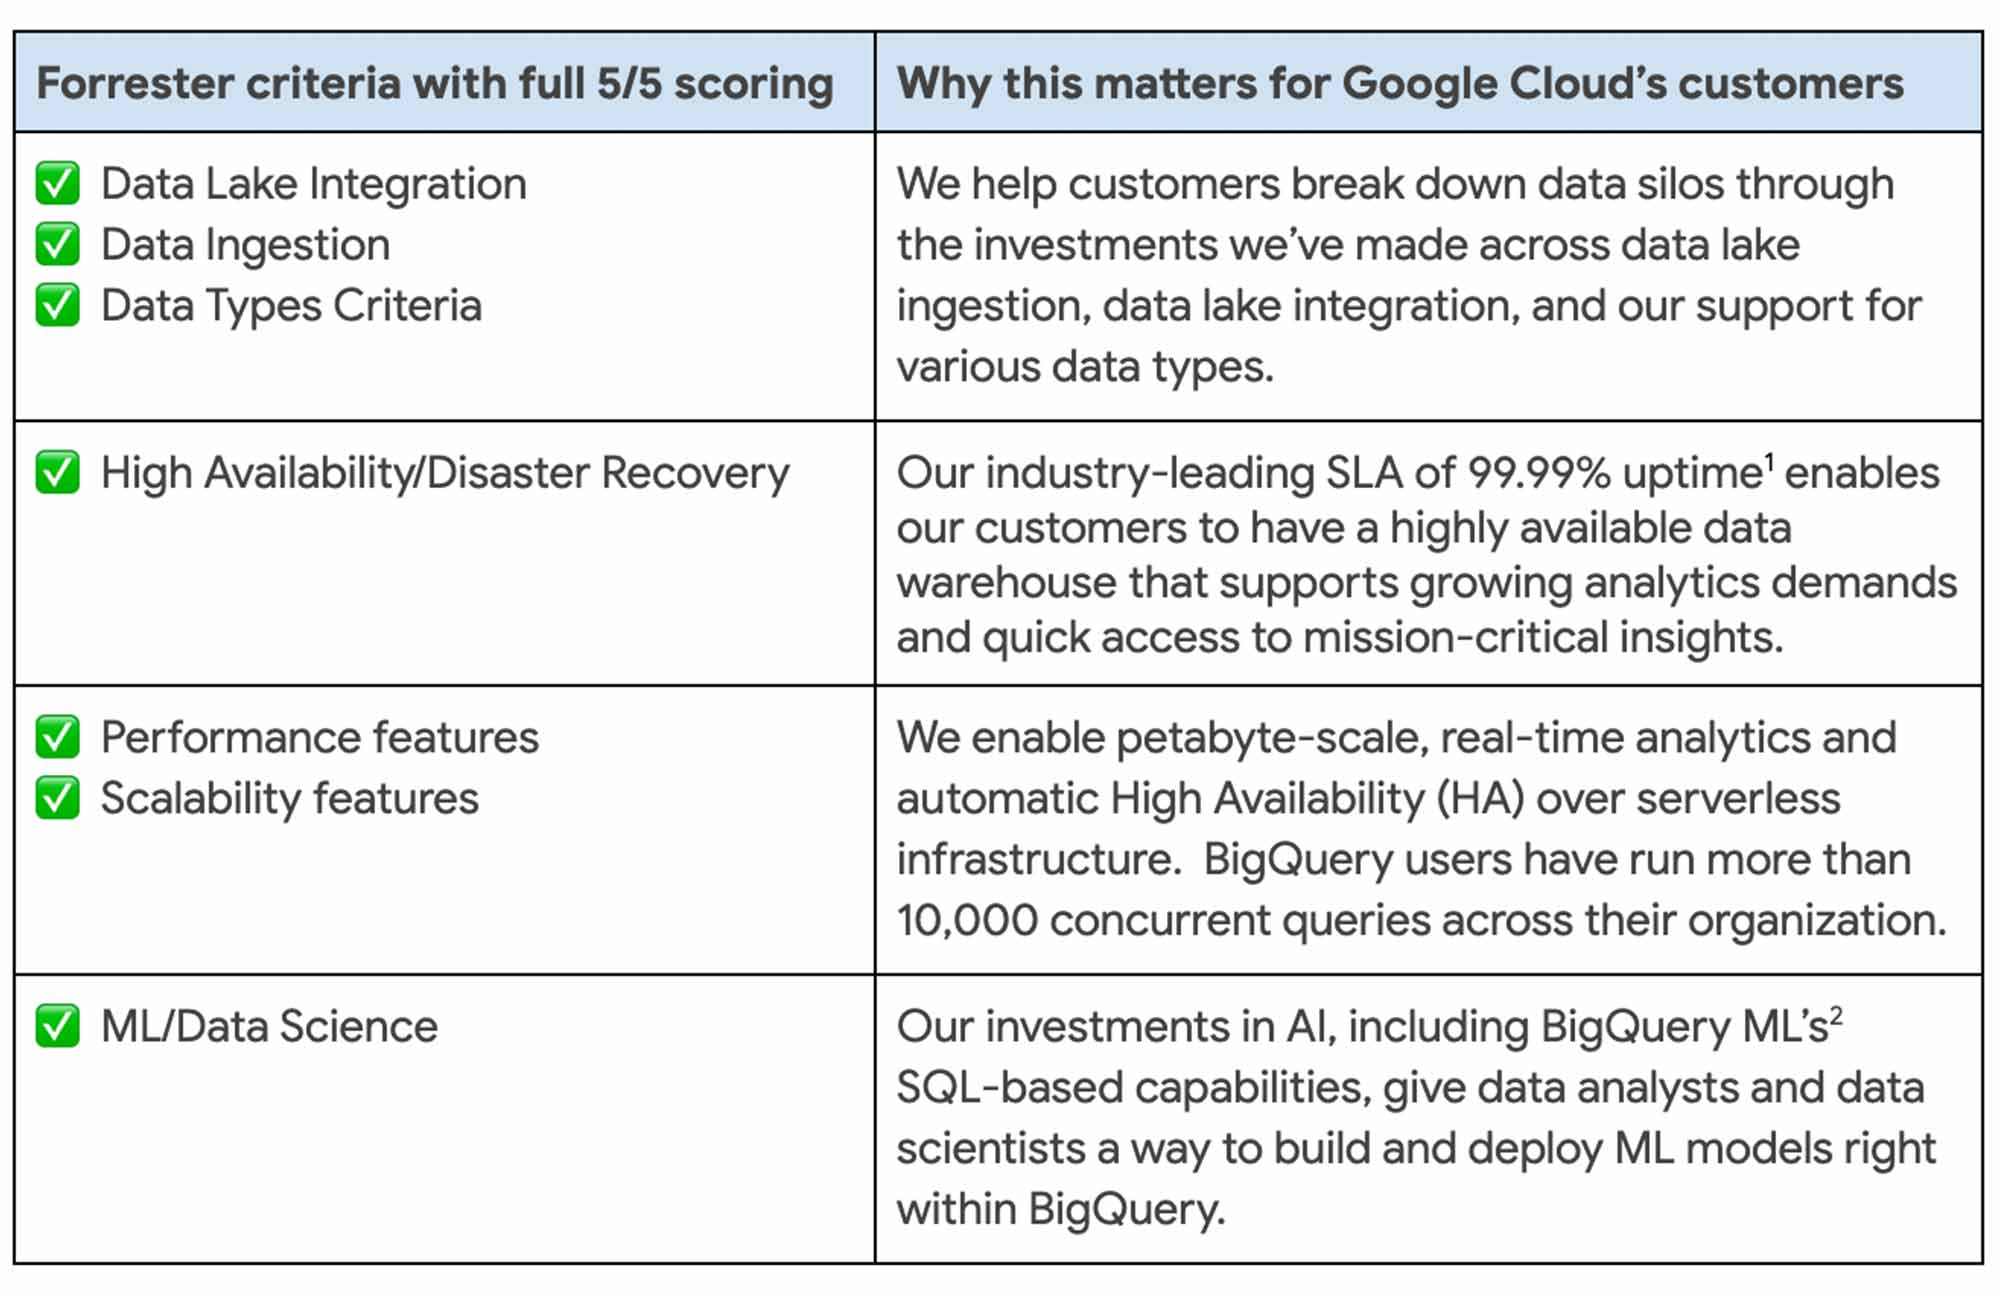
Today, customers across the globe use BigQuery to run business critical analytics workloads to enable BI acceleration, IoT analytics, customer intelligence, AI/ML-based analytics, data science, data collaboration, and data services. Customers such as Verizon, Wayfair, HSBC, Twitter, AirAsia, KeyBank, The Home Depot, and Vodafone have anchored their digital transformation efforts on BigQuery—unlocking deeper insights for their people.
Customers use BigQuery across all industries, to solve issues like credit card fraud detection, predictive forecasting, anomaly detection, log analytics and many more. Forrester recognized this work and gave BigQuery a 5/5 score for supporting vertical and horizontal use cases.
More BigQuery advantages
Google is the first hyperscale provider to offer a multi cloud data analytics solution. With BigQuery Omni, customers can perform cross-cloud analytics with ease, and drive business outcomes they couldn’t achieve with the siloed approach offered by other vendors.
We designed BigQuery to be highly scalable and more open and interoperable so that customers can join data across SQL databases, traditional unstructured data lakes in object storage, and even spreadsheets using any analysis tool.
Recent innovations like BigQuery BI Engine lets us provide the best analytics experience by delivering sub-second query response times from any business intelligence tool, from Google’s Looker and Connected Sheets to Tableau, Microsoft Power BI, ThoughtSpot, and others. Our goal is to meet customers where they are rather than force them into a one-size-fits-all approach to data analysis.
With BigQuery, organizations gain both breadth and depth of capabilities to transform their analytics strategy. Forrester also gave BigQuery 5 out of 5 in:
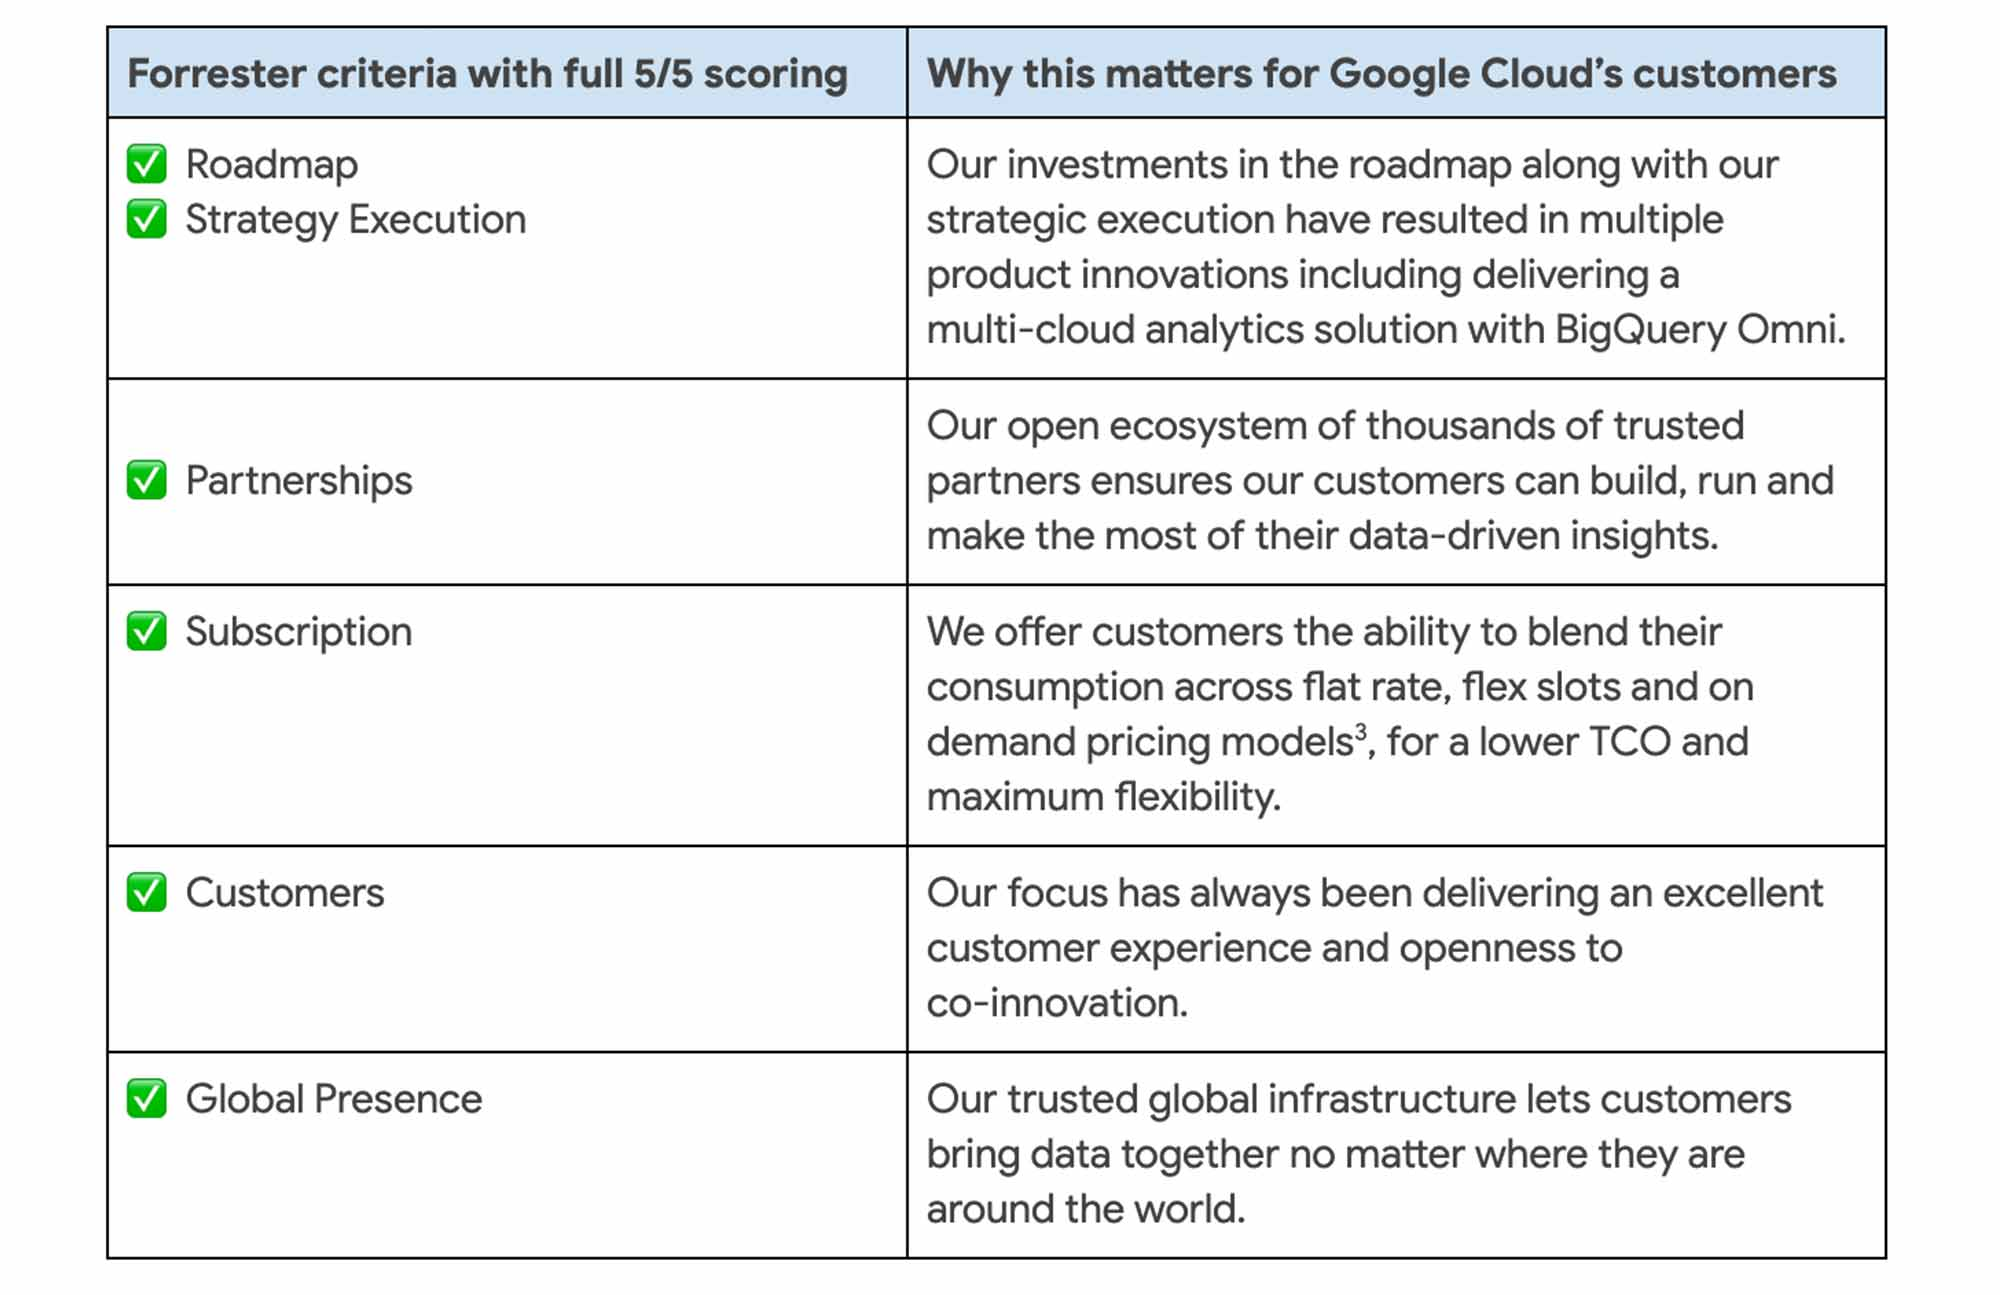
Data-powered innovation
These advantages enable our customers to accelerate their digital transformation and reimagine their business through data-powered innovation. Google’s leadership across AI, analytics, and databases comes together in a single data cloud platform that provides everyone with the ability to get value out of their data faster.
We bring decades of research and innovation in AI to our customers through industry-leading AI solutions, that in turn helps our customers solve their biggest problems. Our support of open standards and APIs enables interoperability between a variety of services for ingestion, storage, processing and analytics across the data cloud platform. And finally, we believe our multi-layered security approach throughout the data stack ensures redundancy and reliability so that customers can have the peace of mind that their data is always protected.
We are honored to be a leader in this Forrester Wave™ and look forward to continuing to innovate and partner with you on your digital transformation journey.
Download the full Forrester Wave™ :Cloud Data Warehouse, Q1 2021 report. And check out these smart analytics reference patterns. To learn more about BigQuery, visit our website, and get started immediately with the free BigQuery Sandbox.
More Relevant Stories for Your Company

BigQuery Explainable AI for Demystifying the Inner Workings of ML Models. Now GA!
Explainable AI (XAI) helps you understand and interpret how your machine learning models make decisions. We're excited to announce that BigQuery Explainable AI is now generally available (GA). BigQuery is the data warehouse that supports explainable AI in a most comprehensive way w.r.t both XAI methodology and model types. It does this at




How adidas’s Marketing Team Benefits from Google Cloud Marketing Platform
We live in a world where the consumer journey is no longer linear, making it difficult to know when to deliver a brand message or a product message. “We talk a lot about the consumer journey no longer being linear. It’s very difficult to know when the consumer is going

Modernize the Data Stack to Transform the Data Experience
As organizations look to revolutionize how they analyze and utilize data, modernizing the data-centric technology stack is critical to success. Today, the traditional stack poses several challenges—too many steps, too many tools, and too many integrations—all leading to operational complexity, time delays, and high cost. Simplifying the data pipeline, data

Principles to Make Organizations Data Engineering Driven
In the “What type of data processing organisation” paper, we examined that you can build a data culture whether your organization consists mostly of data analysts, or data engineers, or data scientists. However, the path and technologies to become a data-driven innovator are different and success comes from implementing the right
