





Held Back by Database Scalability, This Financial Services Company Switches to Google Cloud and Cloud Spanner

11586
Of your peers have already read this article.
4:30 Minutes
The most insightful time you'll spend today!
Azimut Group operates an international network of companies handling investment and asset management, mutual funds, hedge funds, and insurance. Founded in Milan, Italy in 1988, Azimut Group today has branches in fifteen countries, including Brazil, China, and the USA.
“We have subsidiaries and manage funds all over the world,” explains Simone Bertolotti, IT Manager at Azimut Holding S.p.a. “That means that any technology that we put in place has to cover needs from many different countries.”
“When complicated analysis has to be executed, we have to increase our table space in a couple of minutes so that the AI can drill down into the data and deliver the information we need.”
—Simone Bertolotti, IT Manager, Azimut Holding S.p.a.
Azimut manages its funds with investment advisors who use information sourced from Bloomberg, Reuters and others. “They use a huge amount of data,” says Simone. “They work with spreadsheets, algorithms, formulae and they analyse data in minutes.” In finance, every second is crucial, which is why Azimut decided to develop a risk management dashboard that can process information even more quickly, then distribute it worldwide.
“When an advisor manages data, that data is used to make immediate decisions on funds, capital movements or whether to sell stock,” says Simone. “They have to be ready to make recommendations for any amount of data that comes to them. For our dashboard, that means that when additional information arrives or complicated analysis has to be executed, we have to increase our table space in a couple of minutes so that the AI can drill down into the data and deliver the information we need.”
Generating insights at speed
Investors and investment managers make decisions based on the most accurate, up-to-date information possible. For Azimut Group, information sourced through financial data vendors such as Bloomberg and Reuters provided only part of the data that the group required.
“We looked to collect information from a range of different providers,” explains Simone, “then analyse it to develop a predictive algorithm that could work faster than an advisor stationed at the terminal. We set ourselves the challenge to try to manipulate that data to add new insights into our matrix, so that every one of our branches across the world can see risk information about the funds in real-time.”
“We compared Google Cloud Platform’s performance with our previous cloud provider, and saw huge benefits of switching to Google. For me, the key performance issue is scaling. With Google Cloud Platform I know that I can increase and decrease my infrastructure quickly, when I need it.
—Simone Bertolotti, IT Manager, Azimut Holding S.p.a.
The first cloud provider Azimut used to build its system struggled to scale quickly to meet different kinds of data challenges. “If we wanted to add more cores, that was fine,” says Simone. “But the previous cloud provider made it complicated to raise the amount of space in a database infrastructure and scale up to demand. Scaling up for more in-depth analysis would take a day, and our need was immediate.”
That’s why Azimut switched one year ago to Google Cloud Platform to run the 150 VMs on its risk analysis platform. “We compared Google Cloud Platform’s performance with our previous cloud provider, and saw huge benefits of switching to Google. For me, the key performance issue is scaling,” says Simone. “With Google Cloud Platform I know that I can increase and decrease my infrastructure quickly, when I need it. Instead of waiting a day to scale up infrastructure, we can request and add space to our database in a couple of minutes.”
The infrastructure of Azimut’s solution handles around 800TB of data per month, and Google’s global network of servers and high-speed connections ensure that it gets to where it’s most needed by the most direct route. Impressed by the speed, security and availability of Google Cloud Platform, Azimut has moved its intranet on to Google Cloud Platform, too, eliminating the need for staff to login with VPNs.
“Instead of waiting a day to scale up infrastructure, we can request and add space to our database in a couple of minutes.”
—Simone Bertolotti, IT Manager, Azimut Holding S.p.a.
Driving ahead with Noovle
For Azimut, migrating the risk management dashboard is the latest of many Google product collaborations with cloud consultancy Noovle. “Everything started five years ago,” says Simone, “when Noovle assisted us in migrating to Gmail from our on-premise email solution. From G Suite to Google Cloud Platform, we’ve had a great relationship. Noovle provides consultancy services, support for mobility, and external advisors who work on our premises, such as when they trained us how to broadcast our meetings on Google Hangouts. As an independent company, we know we can trust them for transparent advice. All they care about is the best way to get a job done and to help us reach our goals.”
New app, new customers
In a business case comparison, Google Cloud Platform cost Azimut 35% less to run than the previous cloud provider. Now the group is building a major new mobile application on Google App Engine to be released in 2018.
“The new mobile application will allow customers to trade directly, without human advisors, by proposing different investment solutions depending on targets the customers set,” says Simone. “So if a customer aims to make money with investments, they enter their relevant personal information and we carry out the necessary regulatory checks and suggest what they could buy. The entire project will be based on Google Cloud Platform, so customers can control their investments through the app while we manage the fund, using Google Cloud Spanner on the backend.”
Want to Code for the Cloud? Get Started with the Native App Development Track

6741
Of your peers have already read this article.
2:00 Minutes
The most insightful time you'll spend today!
Earlier this year, we launched the Google Cloud skills challenge, which provides 30 days of free access to training to build your cloud knowledge and an opportunity to earn skill badges that showcase your Google Cloud competencies. Today, we’re adding a Native App Development track to the skills challenge, joining the Getting Started, Data Analytics, Kubernetes, Machine Learning (ML) and Artificial Intelligence (AI) tracks.
The Native App Development track is designed for cloud developers who want to learn to build serverless web apps and Google Assistant applications on Google Cloud using Cloud Run and Firebase. Specifically, you’ll have an opportunity to earn three skill badges in the Native App Dev track: Serverless Firebase Development, Serverless Cloud Run Development, and Build Interactive Apps with Google Assistant. To earn a skill badge, you complete a series of hands-on labs and take a final assessment challenge lab to test your skills.
Here’s an overview of each badge.
Serverless Firebase Development
To earn this skill badge, you’ll learn how to build serverless web apps, import data into a serverless database, and build Google Assistant applications using Firebase, Google’s backend-as-service platform for creating mobile and web applications.
Serverless Cloud Run Development
For this badge, you’ll discover how to use Cloud Run, a fully managed serverless platform, to connect and leverage data stored in Cloud Storage. You’ll learn how to use Cloud Run to build a resilient, asynchronous system with Pub/Sub, build a REST API gateway as well as build and expose services.
Build Interactive Apps with Google Assistant
To earn the final skills badge, you’ll build Google Assistant applications by creating a project in the Actions console, integrating Dialogflow, testing your action in the Actions simulator, and adding Cloud Translation API to your assistant application.
Ready to jump into the skills challenge? Sign up here.
You can also check out this quick video below to learn how to join the skills challenge.

Takeaways from Forrester’s Cloud Data Warehouse Q1 2021 Report
DOWNLOAD RESEARCH REPORTS5141
Of your peers have already downloaded this article
20:00 Minutes
The most insightful time you'll spend today!
Cloud data warehouse (CDW) solutions have transformed the delivery of modern analytics and are known to have the capabilities to provision data warehouse of any size in a matter of minutes, autotune queries, scale resources including compute and storage on demand and auto-upgrade to the latest version. As the need for integrated, real-time and self-service analytics scale, CDW vendors continue to focus on native integration with data lakes and object stores; self-service to simplify access and administration for larger and more complex warehouses; and advanced capabilities on parallel processing, compression, partitioning, indexing, query optimization, and dynamic resource provisioning. The most common CDW use cases include customer analytics, AI/machine learning (ML)-based analytics, vertical-specific analytics, and real-time analytics. Customers that are looking to select a CDW vendor need to consider couple of factors.
Download the report learn more 13 leading CDW providers in the Forrester Wave: Cloud Data Warehouse, Q1 2021 report and also explore Google Cloud’s BigQuery for data warehousing.
Datashare for Financial Services: Securing the Publishers and Consumers’ Access to Market Data

8575
Of your peers have already read this article.
4:30 Minutes
The most insightful time you'll spend today!
Access to the cloud has advanced the distribution and consumption of financial information on a global scale. In parallel, the global financial data landscape has been transformed by an influx of alternative data sources, including social media, meteorological data, satellite imagery, and other data. Exchanges and market data providers now find they need to include these new datasets to enrich their products and compete, which has meant they now must consider cloud-based models to keep up with the demands of their customers who expect easy, quick, flexible and cost-efficient ways to consume market data.
To address these needs, today we’re announcing the general availability of Datashare for financial services, a new Google Cloud solution that brings together the entire capital markets ecosystem—data publishers, and data consumers—to exchange market data securely and easily.
Datashare helps organize third-party financial information, making it accessible and useful to market data publishers and data consumers. We open-sourced the entire Datashare solution so market data publishers can now onboard their licensed datasets to Google Cloud securely, quickly and easily, while data consumers can consume that data as a service in tools of their preference, such as BigQuery.
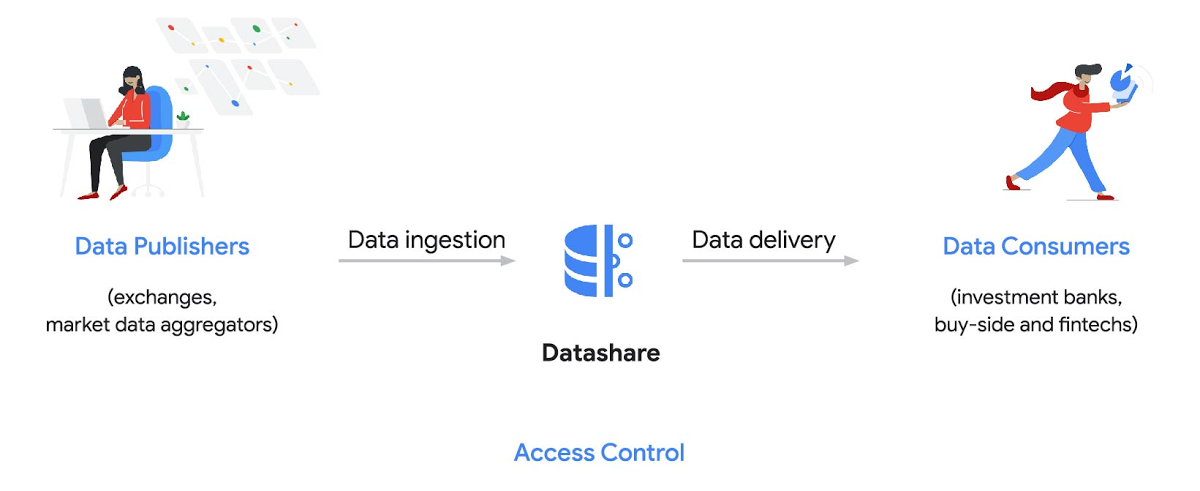
Three ways to distribute and consume your data
Batch data delivery
Datashare provides a batch data delivery mechanism for data publishers to deliver their reference data, historical tick data, alternative market data sources and more via BigQuery, reducing the administrative burden on data consumers to extract insights from data.
Real-time data streaming delivery
By using this event-based data delivery channel for rapidly changing instrument prices, tick data, orders, news and others via Pub/Sub, data consumers can reliably process individual messages or rewind to a point in time to replay a prior market scenario and test model changes.
Monetizing licensed datasets
Market data publishers can onboard their licensed datasets to Google Cloud and make them available via a one-stop-shop on Google Cloud Marketplace, enabling a new sales channel to expand market reach.
Reference architecture
Check out the diagram below to see how you can share your batch and real-time data directly to your Google Cloud customers with BigQuery and Pub/Sub.

As you can see in the above reference architecture, both publishers and consumers can derive several benefits from the solution:
Benefits for data publishers
- You no longer have to maintain your own delivery and licensing infrastructure.
- You can easily package and deliver granular data products and experiments with SQL.
- You can have a solution that scales with your business as data volumes and number of customers grow.
Benefits for data consumers
- Your data is ready for analysis and machine learning (ML)— you no longer have to maintain extract, transform, and load (ETL) pipelines to load files and transform data.
- You can avoid the expense and burden of maintaining multiple copies of large data files.
- You can be more targeted with consumption of data using BigQuery queries, improving performance, and compliance, and reducing cost.
Accessing the datasets
Google Cloud has been working with multiple industry firms on innovating in the market data space. By using Datashare for publishing, data publishers can make their entire datasets available on Google Cloud. Early adopters of Datashare include firms such as OneTick and Accern. OneTick’s datasets include reference and historical futures data (that can be accessed in our console with your login). Accern’s datasets include alternative data such as market sentiment and credit analysis data (that can be accessed in our console with your login).
To make it more helpful, we partnered with Accern to create a hypothetical scenario to describe the data acquisition and analytics process step-by-step.
Accern use case
As a sustainability analyst, you require an economic, social and governance (ESG) dataset to determine which sector is the most widely covered ESG sector by analysts, and to also identify the sector with the lowest ESG sentiment score. Now, you can discover and acquire an ESG dataset in Google Cloud.
Step 1. Navigate to the Financial Services solutions page in the Google Cloud console:

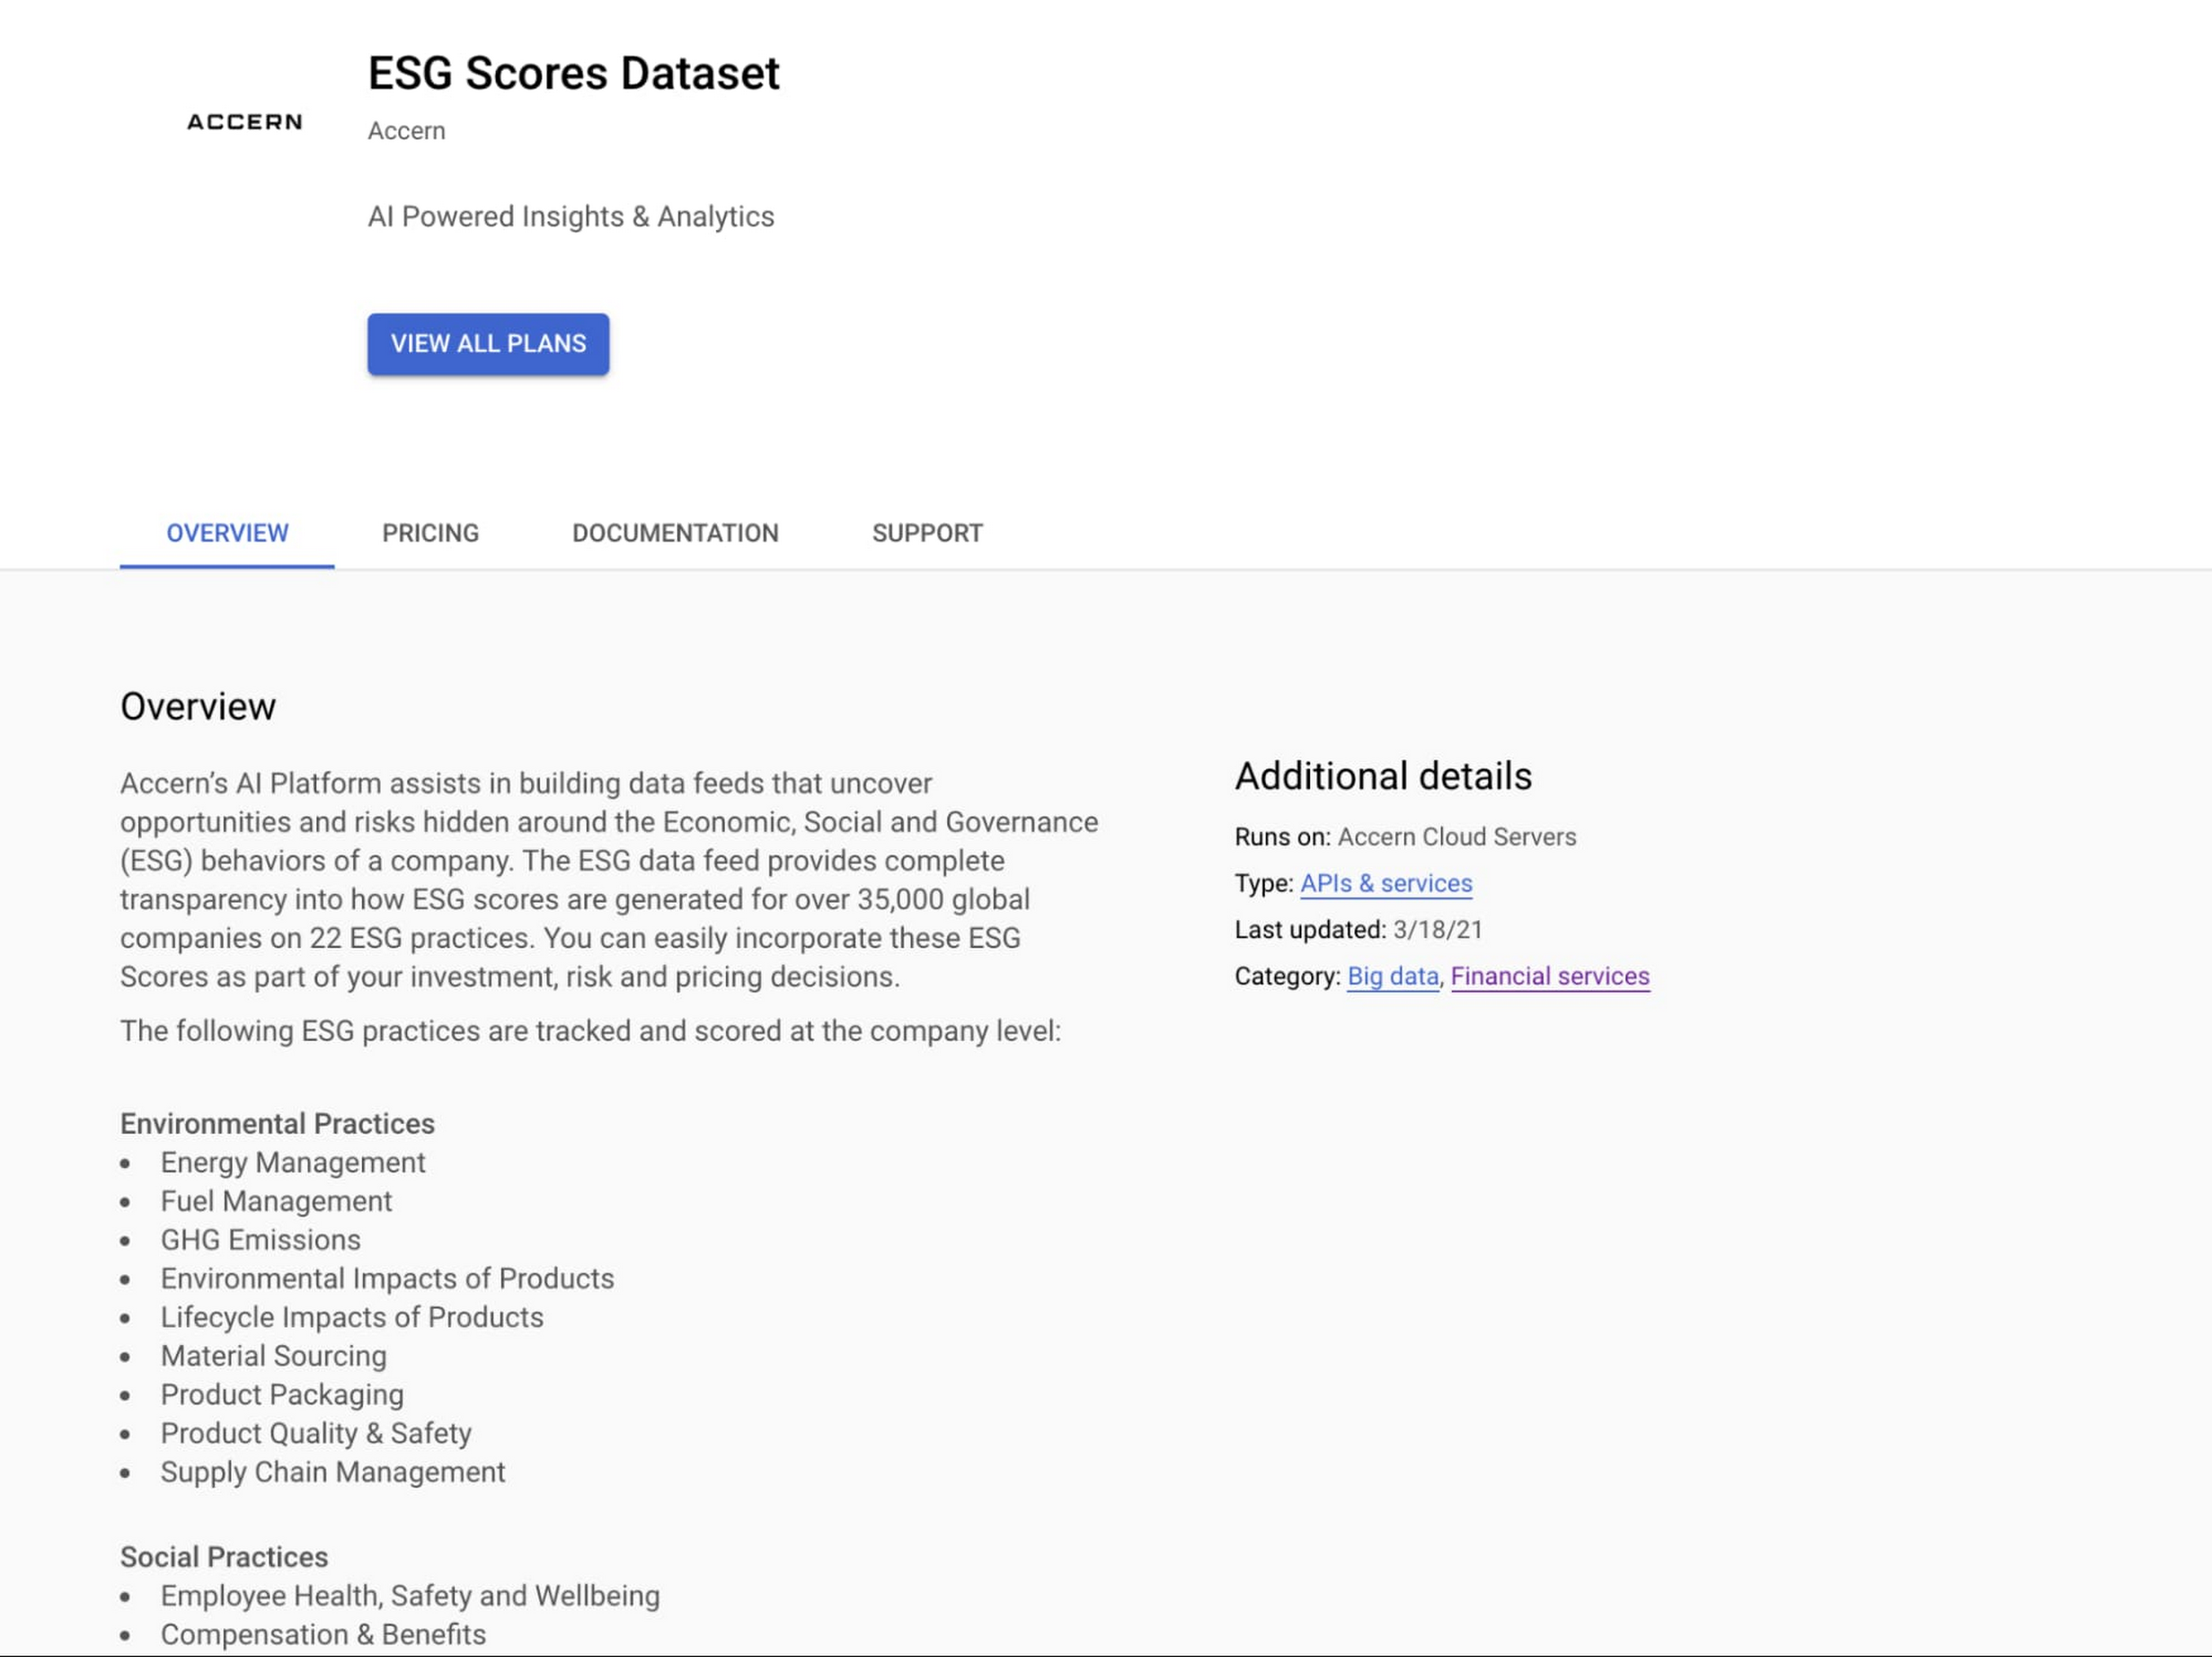
Step 2. Click a dataset, for example Accern AI-Generated ESG Insights, then review the overview details, plans and pricing, documentation and support information. To view the available pricing tiers, click ‘View All Plans’. Once you’ve decided on a tier that you would like to subscribe to, click ‘Select’, choose a billing account and review and accept the terms of service to complete the subscription. Once the steps are complete, click ‘Subscribe’ at the bottom. An overlay window will appear, click ‘Register with Accern’ to activate and complete the subscription.

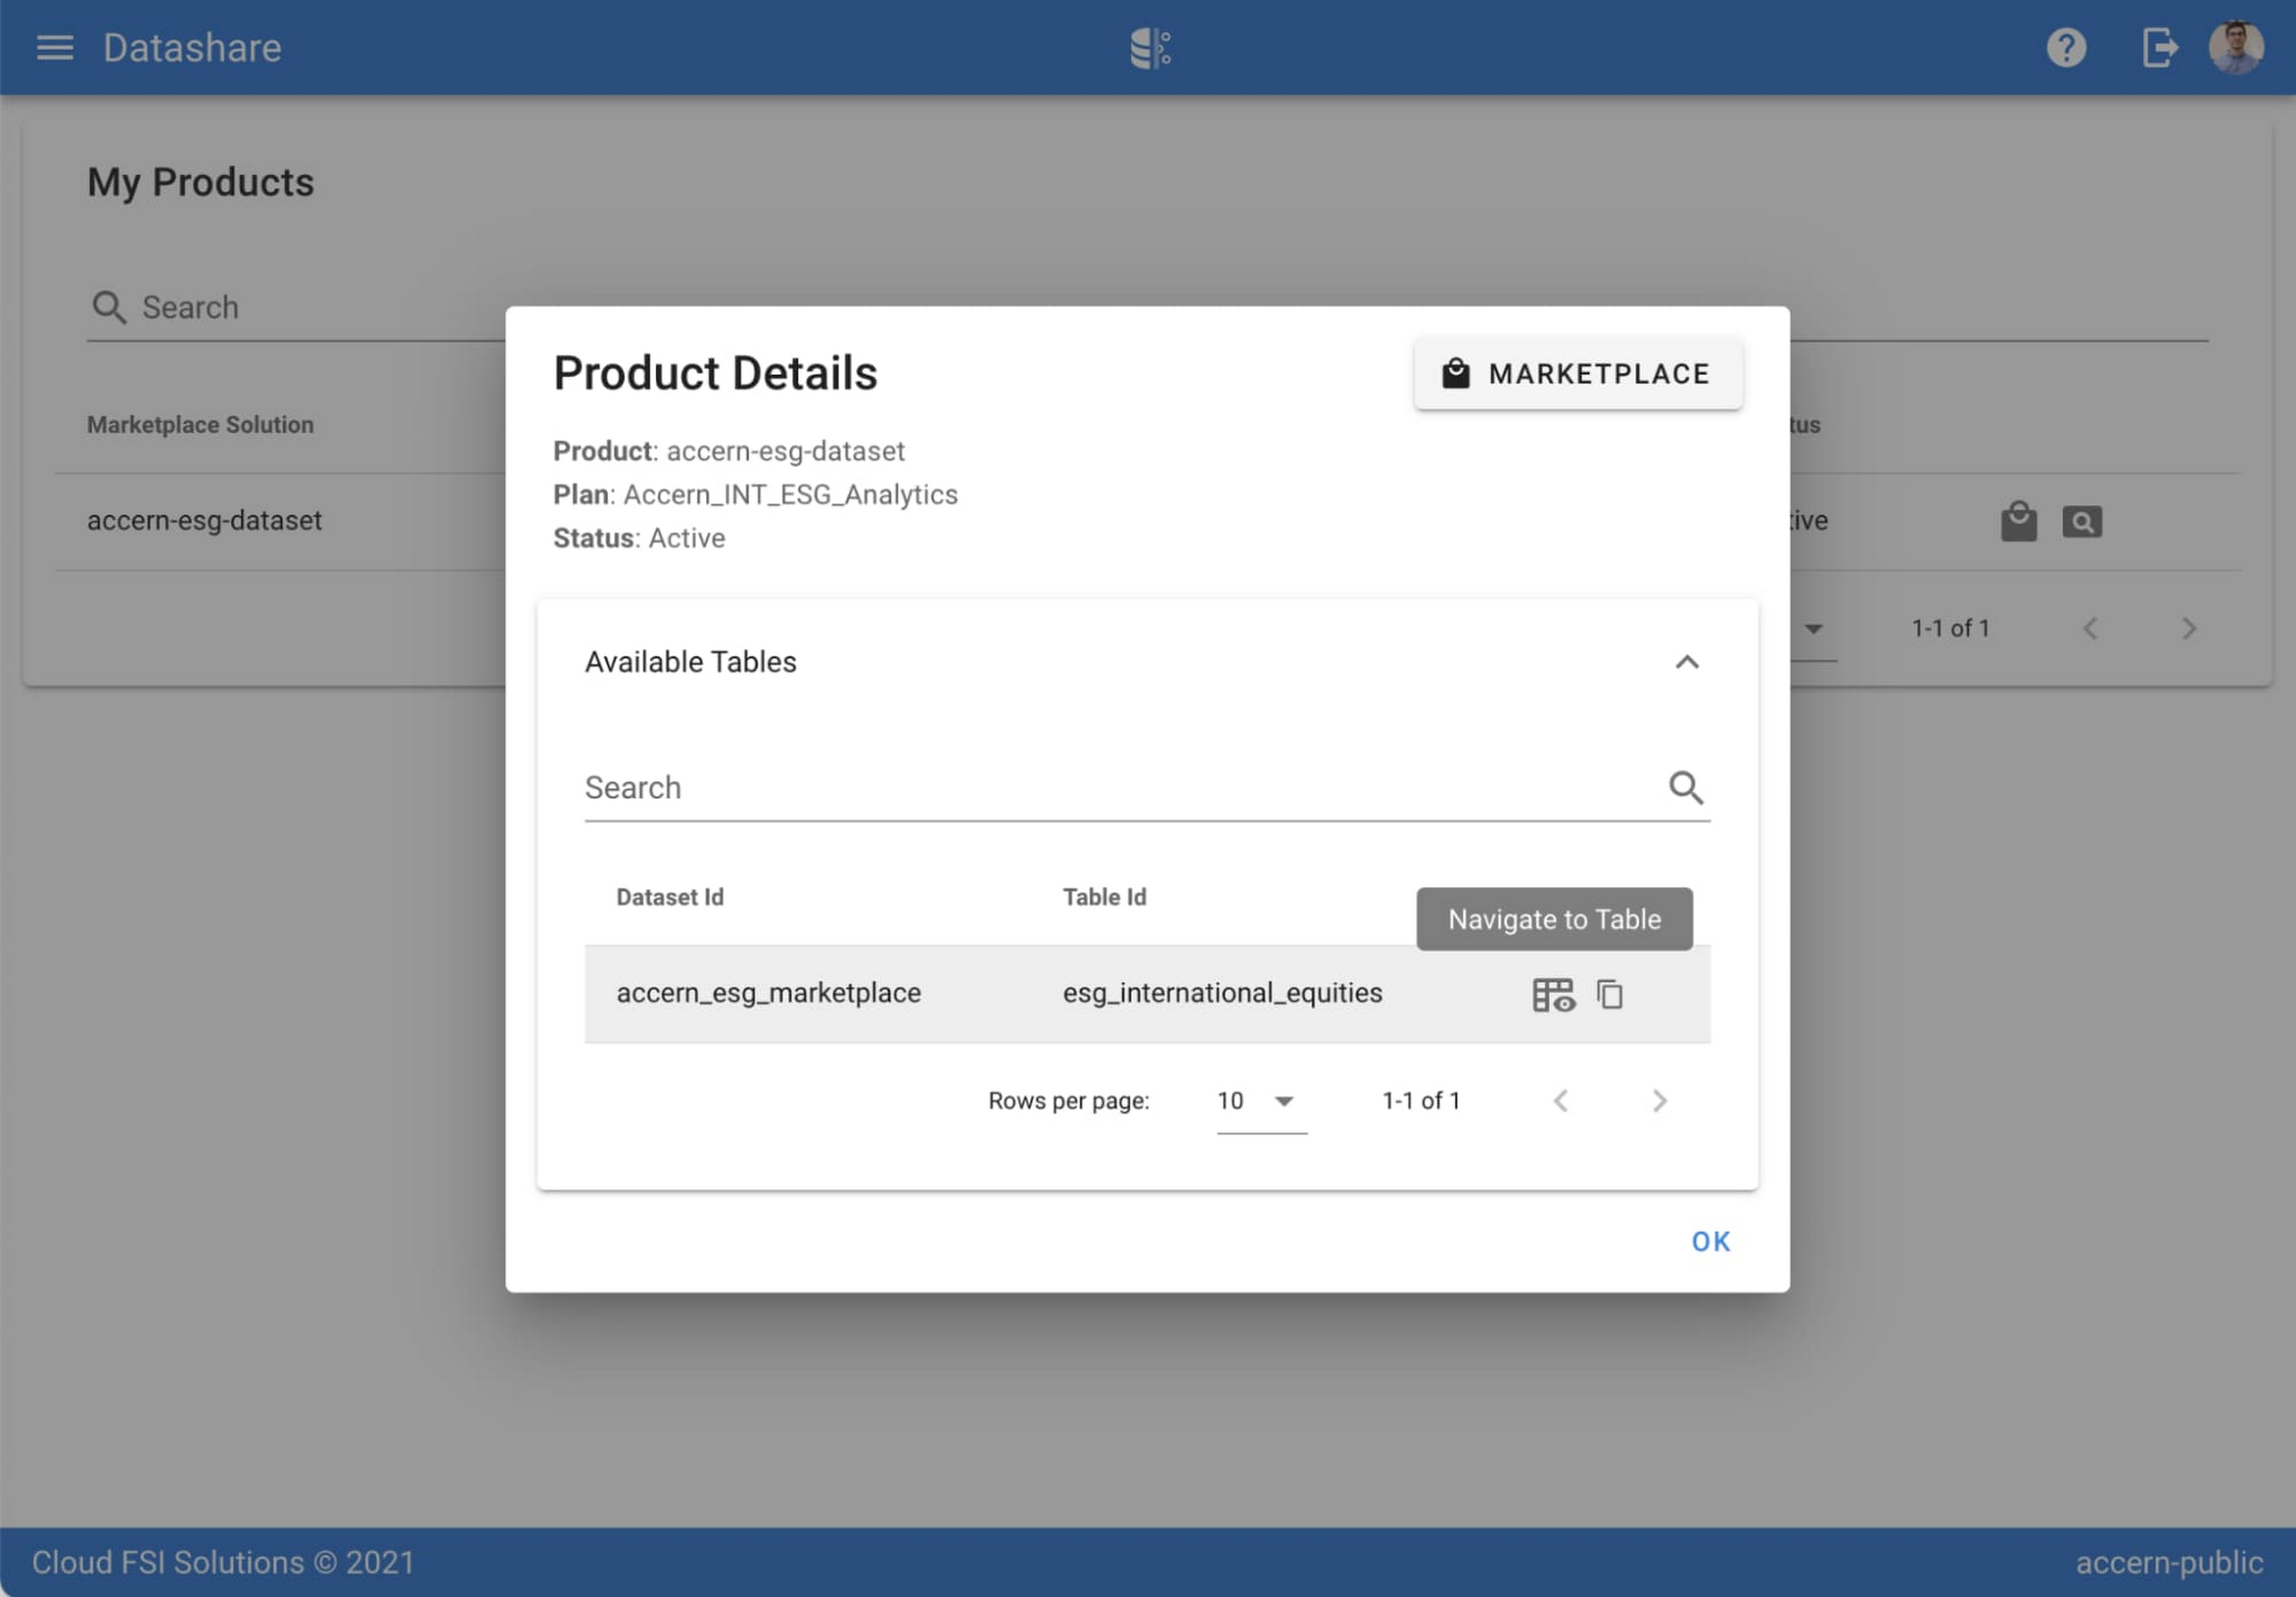
Step 3. Once activation is complete, you’ll be directed to the Datashare ‘My Products’ screen. Voila! You are now subscribed to Accern’s ESG Scores dataset and can access it in your Google Cloud instance using BigQuery. To access the data, click the hour glass icon on the corresponding ‘My Products’ record that you just purchased. An overlay will present you with the details on the dataset and/or table. Click the ‘Navigate to Table’ button to navigate through to the BigQuery console.


Step 4. Now that you have access and are in the BigQuery console, it’s time to generate data insights.
For this example, we’ve eliminated the company identifying information that is included as part of the subscription and aggregated company ESG in a view where each row represents a day, an industry sector, a specific identified ‘ESG Issues’ (event_group and event) and the respective ‘ESG Sentiment’ per issue.

For example, row 1 indicates that within the ‘Healthcare’ sector, there was a ‘Social – Civil Society’ issue identified and it had a negative ESG sentiment score of -15.35.
Step 5. Generate a report by exporting it to Data Studio to build visualizations and conduct additional analysis on the ESG data.
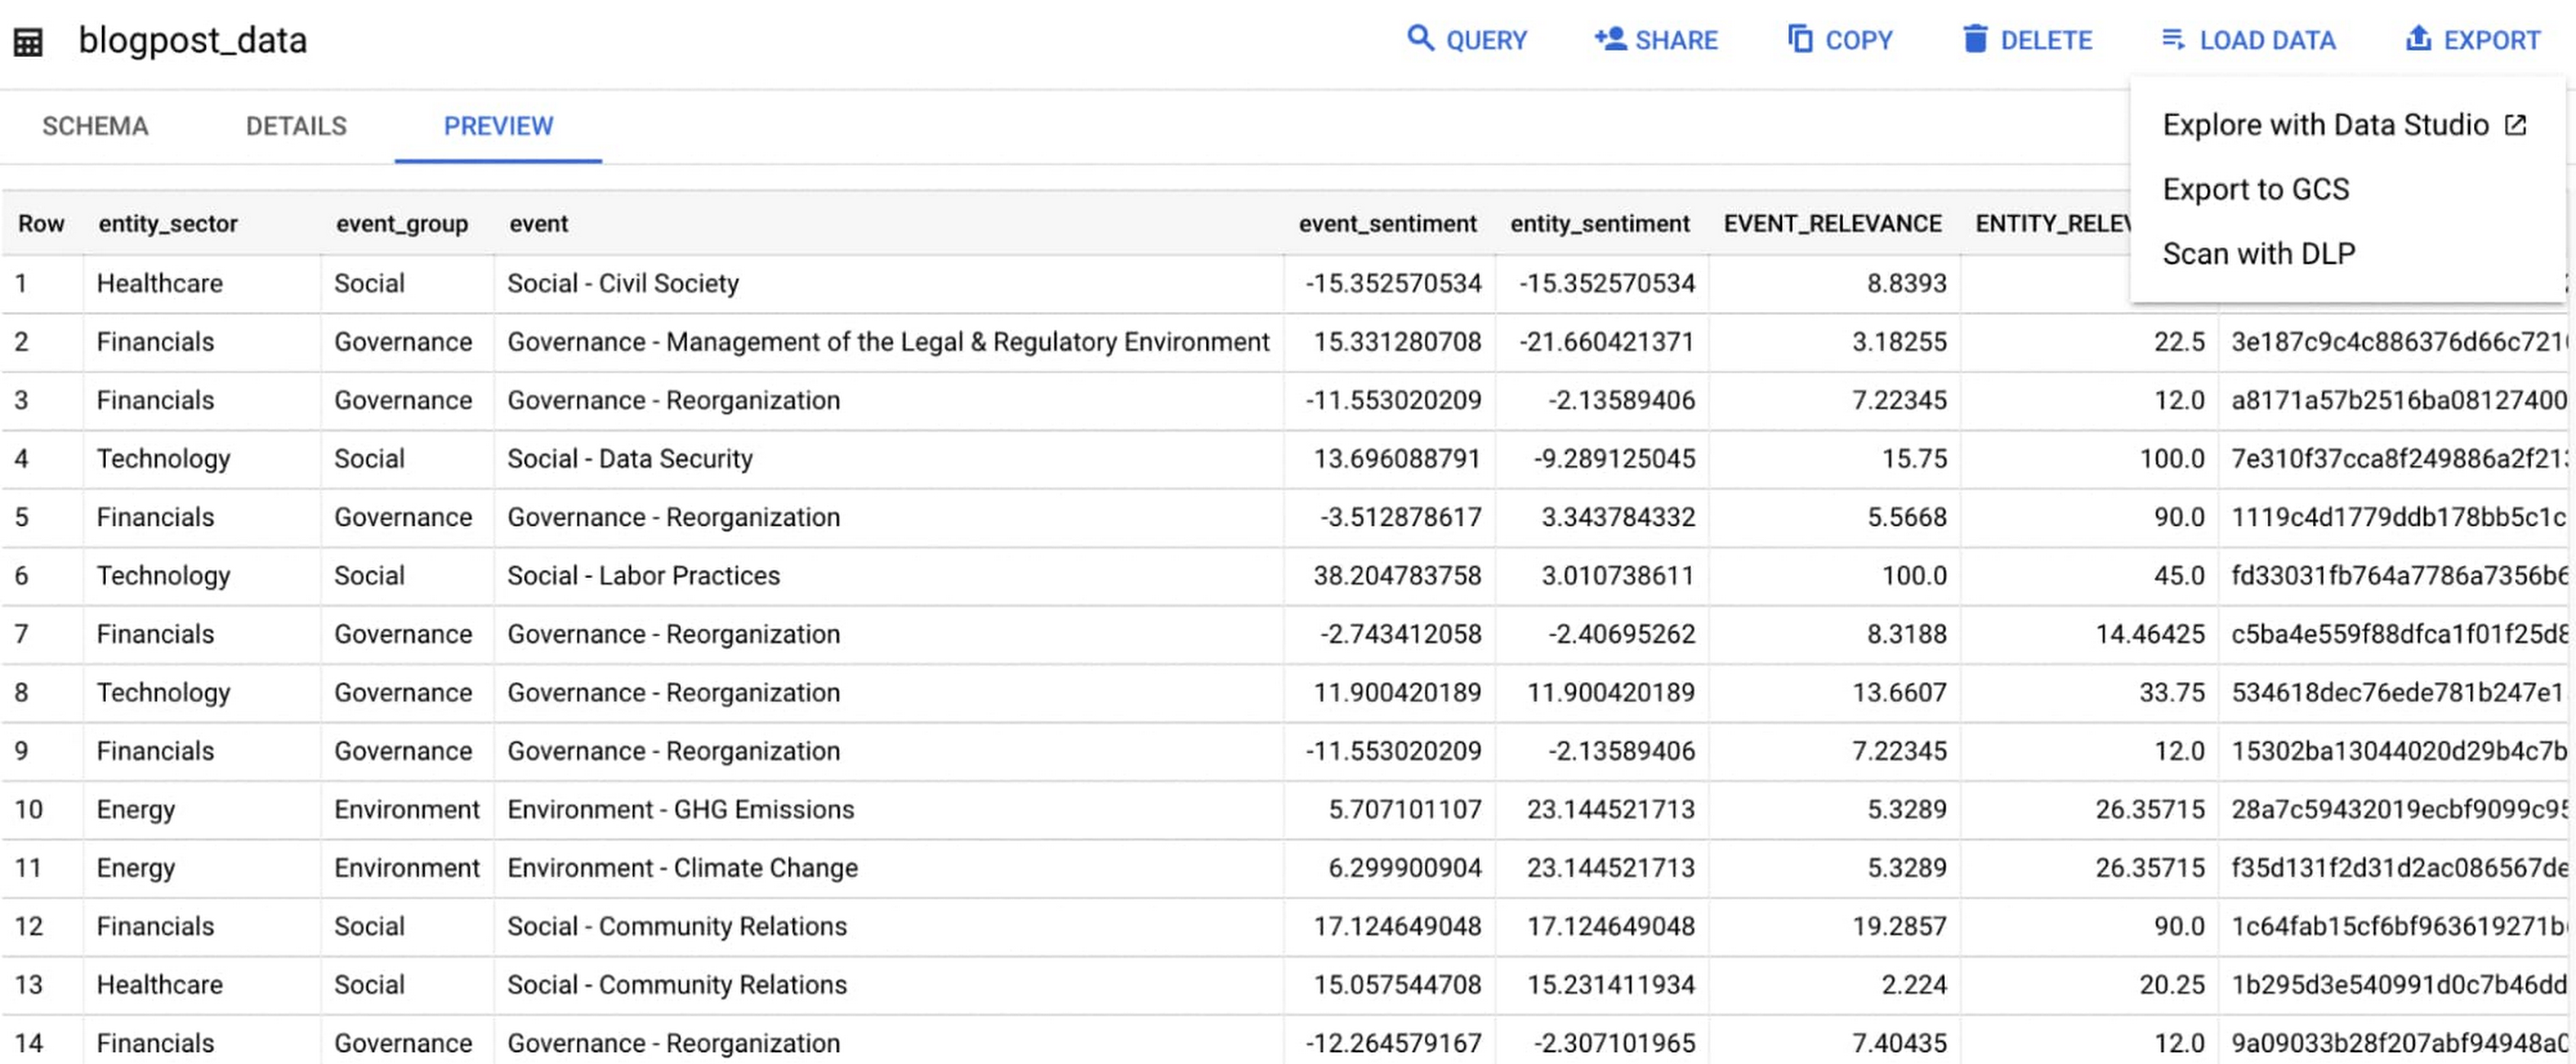
Select ‘Export’ and ‘Explore with Data Studio’.
Step 6. Build a simple/basic report.
Now that the ESG data appears in Data Studio, you can start by building a simple chart to help you understand which industry sectors have the highest volume of discussions around ESG and the overall ESG Sentiment per industry sector.
To build the chart:
- Select the chart type ‘Table’.
- Include
Entity_Sectoras your dimension to aggregate results by ‘Industry Sector.’ - Include
Signal_IDas a measure to count the number of ESG passages identified per ‘Industry Sector.’ - Include
AVG(Event_Sentiment)as a measure to display the overall ESG Sentiment per ‘Industry Sector’ across ESG Issues.

You can see sectors that are most discussed when it comes to ESG related topics and their corresponding ‘ESG Sentiment’ scores.
Step 7. Build your final report in Data Studio.
As a next step you can further drill into the data to understand ESG data specific to each ‘Industry Sector’ and identify positive and negative ESG practices.
Accern has built a more complex sample dashboard and made it available publicly here. You can interact with this report and play around with the data. The dashboard can help to identify material ESG insights for each sector to inform your investment and risk processes. If you have additional questions, you can reach out to Accern directly.

Discovering, accessing and analyzing licensed datasets is quick and easy. Stay tuned for more updates on new licensed datasets.
Publishing your data via Datashare
If you are a publisher of market data, alternative, or exotic data, you can use Datashare to get it published on Google Cloud Marketplace.
Start by joining the Partner Advantage program by registering for the Partner Advantage Portal and applying for the Partner Advantage Build Model engagement. Visit our getting started guide for information to get started on publishing licensed datasets in the Marketplace. Stay tuned for a future blog post about using Datashare to publish datasets in the Marketplace.
More solutions for capital markets
Check out other Google Cloud solutions for capital markets.
Unlocking the Potential of Advanced Analytics with BigQuery and Connected Vehicle Data

2875
Of your peers have already read this article.
2:30 Minutes
The most insightful time you'll spend today!
As software-defined vehicles continue to advance and the quantity of digital services grows to meet consumer demand, the data required to provide these services continue to grow as well. This makes automotive manufacturers and suppliers look for capabilities to log and analyze data, update applications, and extend commands to in-vehicle software.
The challenges the automotive sector faces can be quantified. A modern vehicle contains upwards of 70 electronic control units (ECUs), most of which are connected to one or more sensors. Not only is it now possible to exactly measure many aspects of vehicle performance, but new options become available. Using LIDAR (light detection and ranging), for example, vehicles are achieving higher levels of autonomy; this leads to a data stream from such demanding applications that may reach 25 GB per hour. For the in-vehicle processing of data, 100 million lines of software code may be present — more than a fighter jet. This in-vehicle code will have to be maintained with updates and new functionalities.
Access to the data will allow manufacturers to gain valuable insights into operational details of their vehicles. The use of this data can help to reduce costs and risks, increase ROI, support ESG initiatives, and provide valuable insights to develop innovative solutions and shorten the time to value for Electric Vehicle innovations.
Sibros’ Deep Connected Platform (DCP) makes it possible for these manufacturers to build and launch new connected vehicle use cases from production to post-sale at scale by connecting and managing all software and data throughout every life cycle stage. A key component of this platform is the Sibros Deep Logger that provides capabilities like the following:
- Full configurability of what to record, when to record it, and how fast to record it.
- High resolution timestamps of all Controller Area Network (CAN) messages.
- Dynamic application of live log configurations to receive new data points without deploying new software.
For example, properly analyzed engine data enables true predictive maintenance for the first time, which creates the option to repair or replace components before failure happens. Another example would be the evaluation of data regarding the use of certain in-car features with the goal to redesign its interior.
Two other components of the DCP are software updates and remote commands to ECUs. The DCP on Google Cloud enables seamless integration with any vehicle architecture and provides OEMs and suppliers with the platform to manage connected vehicle data at rest and in transit using a proven and secure way on a global scale.
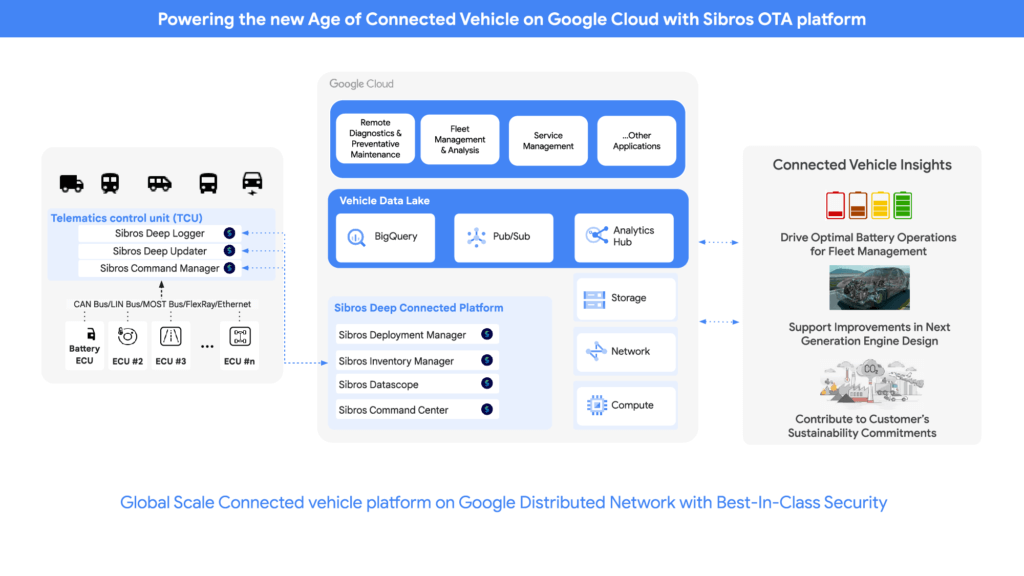
OEMs can pull data through APIs provided by Sibros into Google Data Cloud (including BigQuery) to gain access to the rich information data sets provided by the DCP within their environment and blend this data with their first party data sets to provide value insights for their business. Some of the Connected Vehicle insights that DCP information enables are:
- Damage prevention, improved operation, or development of the next generation of engines with insights from complex analyses that could consider parameters like model, engine type, mileage, overall speed, temperature, air pressure, load, services, and more.
- The combination of electric vehicle battery usage data like charging cycles, engine performance, and battery age with contributing factors as the use of the air conditioning to determine if such factors contribute to hazardous battery conditions and for improved battery development.
- Cross-organization collaboration in R&D by the provision of information on all these metrics and more from real-world driving, like engine knock data and even tire pressure.
- Google Cloud’s unified data cloud offering provides a complete platform for building data-driven applications like those from Sibros — from simplified data ingestion, processing, and storage to powerful analytics, AI, ML, and data sharing capabilities — integrated with Google Cloud. With a diverse partner ecosystem and support for multi-cloud, open-source tools and APIs, Google Cloud provides Sibros the portability and the extensibility they need to avoid data lock-in.
“Software has an ever increasing importance in the automotive world, even more so with electric vehicles and new mobility services. Google Cloud is partnering with Sibros to bring their award winning Deep Connected Platform to deliver high frequency, low latency over-the-air software updates, data logging & diagnostics capabilities to our automotive customers, leveraging the security and scale of Google Cloud. This is revolutionizing everything from development cycles to business models and customer relationships.” — Matthias Breunig, Director, Global Automotive Solutions, Google Cloud
Through Built with BigQuery, Google Cloud is helping tech companies like Sibros build innovative applications on Google’s Data Cloud with simplified access to technology, helpful and dedicated engineering support, and joint go-to-market programs.
“Sibros is looking forward to partnering with Google Cloud, which will enable vehicle manufacturers and suppliers to reach the next level in their use of data. Sibros solutions for Deep Data Logging and Updating on the Google Data Cloud, combined with Google BigQuery, will help them to mitigate risks, reduce costs, add innovative products, and introduce value-added use cases.” — Xiaojian Huang, Chief Digital Officer, Software, Sibros
Sibros and Google Cloud are driving Connected Mobility transformation to help our customers accelerate R&D innovation, power efficient operations, and unlock software-defined vehicle use cases with a full stack connected vehicle platform. Click here to learn more about Sibros on Google Cloud.
Scaling Ad Personalization with Bigtable

3001
Of your peers have already read this article.
2:30 Minutes
The most insightful time you'll spend today!
Cloud Bigtable is a popular and widely used key-value database available on Google Cloud. The service provides scale elasticity, cost efficiency, excellent performance characteristics, and 99.999% availability SLA. This has led to massive adoption with thousands of customers trusting Bigtable to run a variety of their mission-critical workloads.
Bigtable has been in continuous production usage at Google for more than 15 years now. It processes more than 5 billion requests per second at peak and has more than 10 exabytes of data under management. It’s one of the largest semi-structured data storage services at Google.
One of the key use cases for Bigtable at Google is ad personalization. This post describes the central role that Bigtable plays within ad personalization.
Ad personalization
Ad personalization aims to improve user experience by presenting topical and relevant ad content. For example, I often watch bread-making videos on YouTube. If ads personalization is enabled in my ad settings, my viewing history could indicate to YouTube that I’m interested in baking as a topic and would potentially be interested in ad content related to baking products.
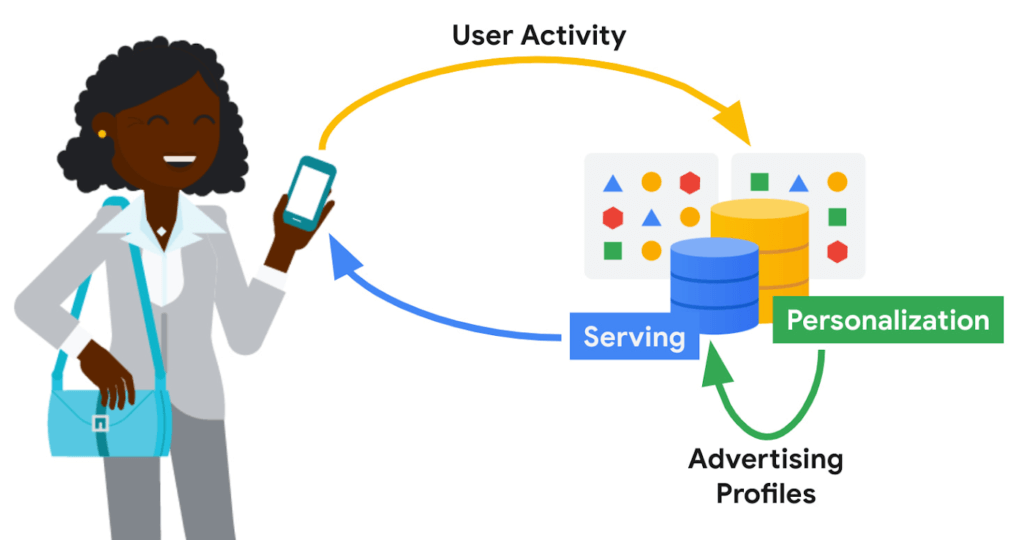
Ad personalization requires large-scale data processing in near real-time for timely personalization with strict controls for user data handling and retention. System availability needs to be high, and serving latencies need to be low due to the narrow window within which decisions need to be made on what ad content to retrieve and serve. Sub-optimal serving decisions (e.g. falling back to generic ad content) could potentially impact user experience. Ad economics requires infrastructure costs to be kept as low as possible.
Google’s ad personalization platform provides frameworks to develop and deploy machine learning models for relevance and ranking of ad content. The platform supports both real-time and batch personalization. The platform is built using Bigtable, allowing Google products to access data sources for ads personalization in a secure manner that is both privacy and policy compliant, all while honoring users’ decisions about what data they want to provide to Google
The output from personalization pipelines, such as advertising profiles are stored back in Bigtable for further consumption. The ad serving stack retrieves these advertising profiles to drive the next set of ad serving decisions.
Some of the storage requirements of the personalization platform include:
- Very high throughput access for batch and near real-time personalization
- Low latency (<20 ms at p99) lookup for reads on the critical path for ad serving
- Fast (i.e. in the order of seconds) incremental update of advertising models in order to reduce personalization delay
Bigtable
Bigtable’s versatility in supporting both low-cost, high-throughput access to data for offline personalization as well as consistent low-latency access for online data serving makes it an excellent fit for the ads workloads.
Personalization at Google-scale requires a very large storage footprint. Bigtable’s scalability, performance consistency and low cost required to meet a given performance curve are key differentiators for these workloads.
Data model
The personalization platform stores objects in Bigtable as serialized protobufs keyed by Object ids. Typical data sizes are less than 1 MB and serving latency is less than 20 ms at p99.
Data is organized as corpora, which correspond to distinct categories of data. A corpus maps to a replicated Bigtable.
Within a corpus, data is organized as DataTypes, logical groupings of data. Features, embeddings, and different flavors of advertising profiles are stored as DataTypes, which map to Bigtable column families. DataTypes are defined in schemas which describe the proto structure of the data and additional metadata indicating ownership and provenance. SubTypes map to Bigtable columns and are free-form.
Each row of data is uniquely identified by a RowID, which is based on the Object ID. The personalization API identifies individual values by RowID (row key), DataType (column family), SubType (column part), and Timestamp.
Consistency
The default consistency mode for operations is eventual. In this mode, data from the Bigtable replica nearest to the user is retrieved, providing the lowest median and tail latency.
Reads and writes to a single Bigtable replica are consistent. If there are multiple replicas of Bigtable in a region, traffic spillover across regions is more likely. To improve the likelihood of read-after-write consistency, the personalization platform uses a notion of row affinity. If there are multiple replicas in a region, one replica is preferentially selected for any given row, based on a hash of the Row ID.
For lookups with stricter consistency requirements, the platform first attempts to read from the nearest replica and requests that Bigtable return the current low watermark (LWM) for each replica. If the nearest replica happens to be the replica where the writes originated, or if the LWMs indicate that replication has caught up to the necessary timestamp, then the service returns a consistent response. If replication has not caught up, then the service issues a second lookup—this one targeted at the Bigtable replica where writes originated. That replica could be distant and the request could be slow. While waiting for a response, the platform may issue failover lookups to other replicas in case replication has caught up at those replicas.
Bigtable replication
The Ads personalization workloads use a Bigtable replication topology with more than 20 replicas, spread across four continents.
Replication helps address the high availability needs for ad serving. Bigtable’s zonal monthly uptime percentage is in excess of 99.9%, and replication coupled with a multi-cluster routing policy allows for availability in excess of 99.999%.
A globe-spanning topology allows for data placement that is close to users, minimizing serving latencies. However, it also comes with challenges such as variability in network link costs and throughputs. Bigtable uses Minimum Spanning Tree-based routing algorithms and bandwidth-conserving proxy replicas to help reduce network costs.
For ads personalization, reducing Bigtable replication delay is key to lowering the personalization delay (the time between a user’ action and when that action has been incorporated into advertising models to show more relevant ads to the user). Faster replication is preferred but we also need to balance serving traffic against replication traffic and make sure low-latency user-data serving is not disrupted due to incoming or outgoing replication traffic flows. Under the hood, Bigtable implements complex flow control and priority boost mechanisms to manage global traffic flows and to balance serving and replication traffic priorities.
Workload Isolation
Ad personalization batch workloads are isolated from serving workloads by pinning a given set of workloads onto certain replicas; some Bigtable replicas exclusively drive personalization pipelines while others drive user-data serving. This model allows for a continuous and near real-time feedback loop between serving systems and offline personalization pipelines, while protecting the two workloads from contending with each other.
For Cloud Bigtable users, AppProfiles and cluster-routing policies provide a way to confine and pin workloads to specific replicas to achieve coarse-grained isolation.
Data residency
By default, data is replicated to every replica—often spread out globally—which is wasteful for data that is only accessed regionally. Regionalization saves on storage and replication costs by confining data to the region where it is most likely to be accessed. Compliance with regulations mandating that data pertaining to certain subjects are physically stored within a given geographical area is also vital.
The location of data can be either implicitly determined by the access location of requests or through location metadata and other product signals. Once the location for a user is determined, it is stored in a location metadata table which points to the Bigtable replicas that read requests should be routed to. Migration of data based on row-placement policies happens in the background, without downtime or serving performance regressions.
Conclusion
In this blog post, we looked at how Bigtable is used within Google to support an important use case—modeling user intent for ad personalization.
Over the past decade, Bigtable has scaled as Google’s personalization needs have scaled by orders of magnitude. For large-scale personalization workloads, Bigtable offers low cost storage with excellent performance characteristics. It seamlessly handles global traffic flows with simple user configurations. Its ease at handling both low-latency serving and high-throughput batch computations make it an excellent option for lambda-style data processing pipelines.
We continue to drive high levels of investment to further lower costs, improve performance, and bring new features to make Bigtable an even better choice for personalization workloads.
Learn more
To get started with Bigtable, try it out with a Qwiklab and learn more about the product here.
Acknowledgements
We’d like to thank Ashish Awasthi, Ashish Chopra, Jay Wylie, Phaneendhar Vemuru, Bora Beran, Elijah Lawal, Sean Rhee and other Googlers for their valuable feedback and suggestions.
More Relevant Stories for Your Company

How to Decide Whether to Run a Database on Kubernetes
Today, more and more applications are being deployed in containers on Kubernetes—so much so that we’ve heard Kubernetes called the Linux of the cloud. Despite all that growth on the application layer, the data layer hasn’t gotten as much traction with containerization. That’s not surprising, since containerized workloads inherently have
Google Cloud Leads the Landscape for Unstructured Data Security Platform: Forrester
As organizations expand their use of cloud computing services, more of their sensitive data inevitably moves to and lives in the cloud. Much of this sensitive data is unstructured and can be challenging to secure. Despite this potential challenge, the usefulness of cloud for data storage and processing is too

Bigtable’s High Performance and Low Opex is Great for Building Personalization
Customer expectations have shifted as a result of evolving needs. Across industries, customers expect that you treat them as individuals, and demonstrate how well you understand and serve their unique needs. This concept—personalization—is the idea that you’re delivering a tailored experience to each customer corresponding to their needs and preferences;

ActivStat: Enhancing Live Sports Broadcast with Real-time Stats and Metrics
Millions of people annually view esports, as top players and teams compete in thrilling, fast-paced tests of reflexes, strategy, and teamwork. Fans are a diverse group, sharing a passion for action. A new, revolutionary project we’re working on with Call of Duty League just made that action a lot better.
