






Gartner Identifies Critical Capabilities for Data Management Solutions
READ FULL INTRODOWNLOAD AGAIN3998
Of your peers have already downloaded this article
3:30 Minutes
The most insightful time you'll spend today!
How BigQuery’s Unique Features Support Your Data at Petabyte-scale

4799
Of your peers have already read this article.
3:00 Minutes
The most insightful time you'll spend today!
Organizations rely on data warehouses to aggregate data from disparate sources, process it, and make it available for data analysis in support of strategic decision-making. BigQuery is the Google Cloud enterprise data warehouse designed to help organizations to run large scale analytics with ease and quickly unlock actionable insights. You can ingest data into BigQuery either through batch uploading or by streaming data directly to unlock real-time insights. As a fully-managed data warehouse, BigQuery takes care of the infrastructure so you can focus on analyzing your data up to petabyte-scale. BigQuery supports SQL (Structured Query Language), which you’re likely already familiar with if you’ve worked with ANSI-compliant relational databases.
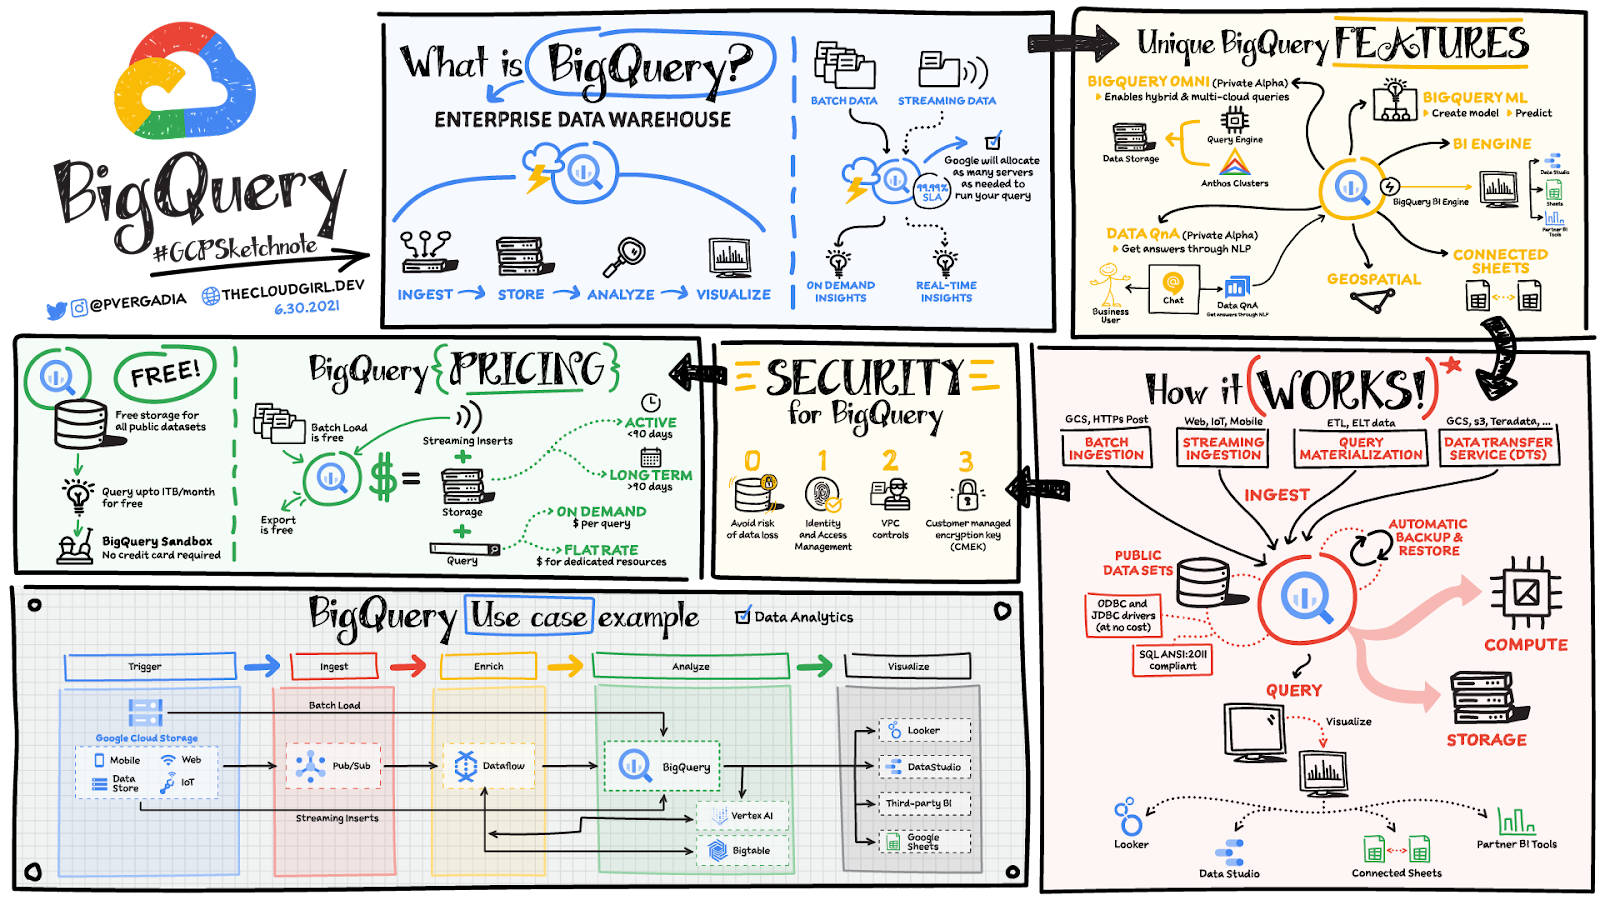
BigQuery unique features
BI Engine – BigQuery BI Engine is a fast, in-memory analysis service that provides subsecond query response times with high concurrency. BI Engine integrates with Google Data Studio and Looker for visualizing query results and enables integration with other popular business intelligence (BI) tools.
BigQuery ML: BigQuery ML is unlocking machine learning for millions of data analysts. It enables data analysts and data scientists to build and operationalize machine learning models directly within BigQuery, using simple SQL.
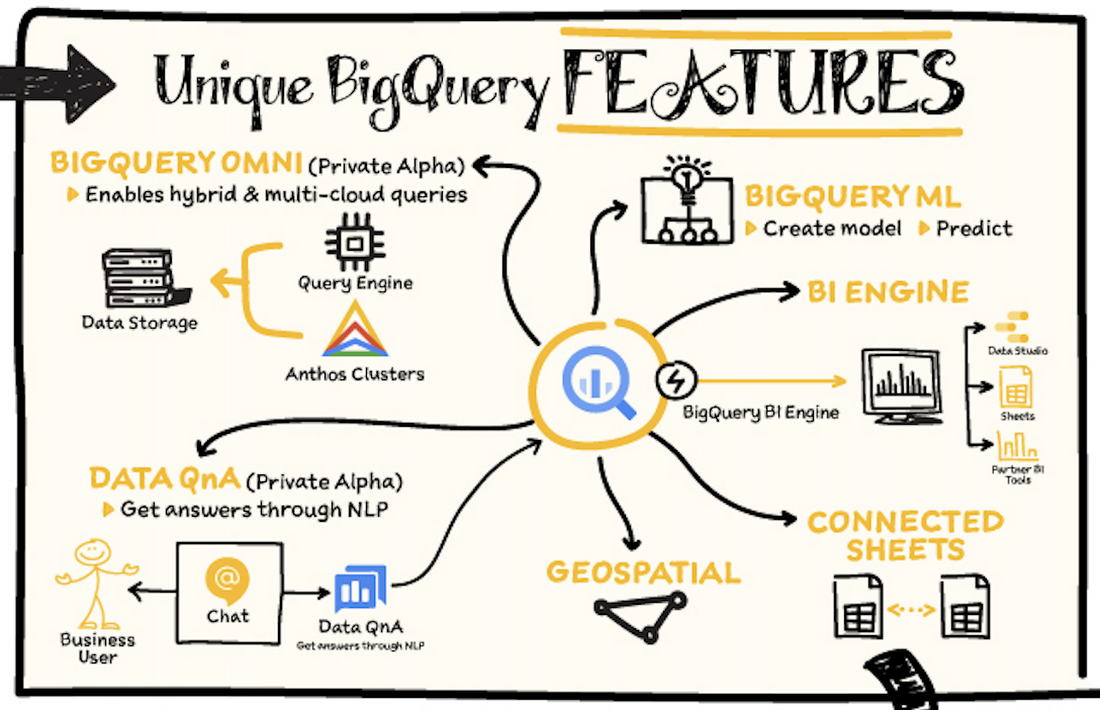
BigQuery Omni – BigQuery Omni is a flexible, multi-cloud analytics solution powered by Anthos that lets you cost-effectively access and securely analyze data across Google Cloud, Amazon Web Services (AWS), and Azure, without leaving the BigQuery user interface (UI). Using standard SQL and familiar BigQuery APIs, you can break down data silos and gain critical business insights from a single pane of glass.
Data QnA: Data QnA enables self-service analytics for business users on BigQuery data as well as federated data from Cloud Storage, Bigtable, Cloud SQL, or Google Drive. It uses Dialogflow and enables users to formulate free-form text analytical questions, with auto-suggested entities while users type a question.
Connected Sheets -The native integration between Sheets and BigQuery makes it possible for all business stakeholders, who are already quite familiar with spreadsheet tools, to get their own up-to-date insights at any time.
Geospatial data – BigQuery offers accurate and scalable geospatial analysis with geography data types. It supports core GIS functions – measurements, transforms, constructors, and more – using standard SQL.
How does it work?
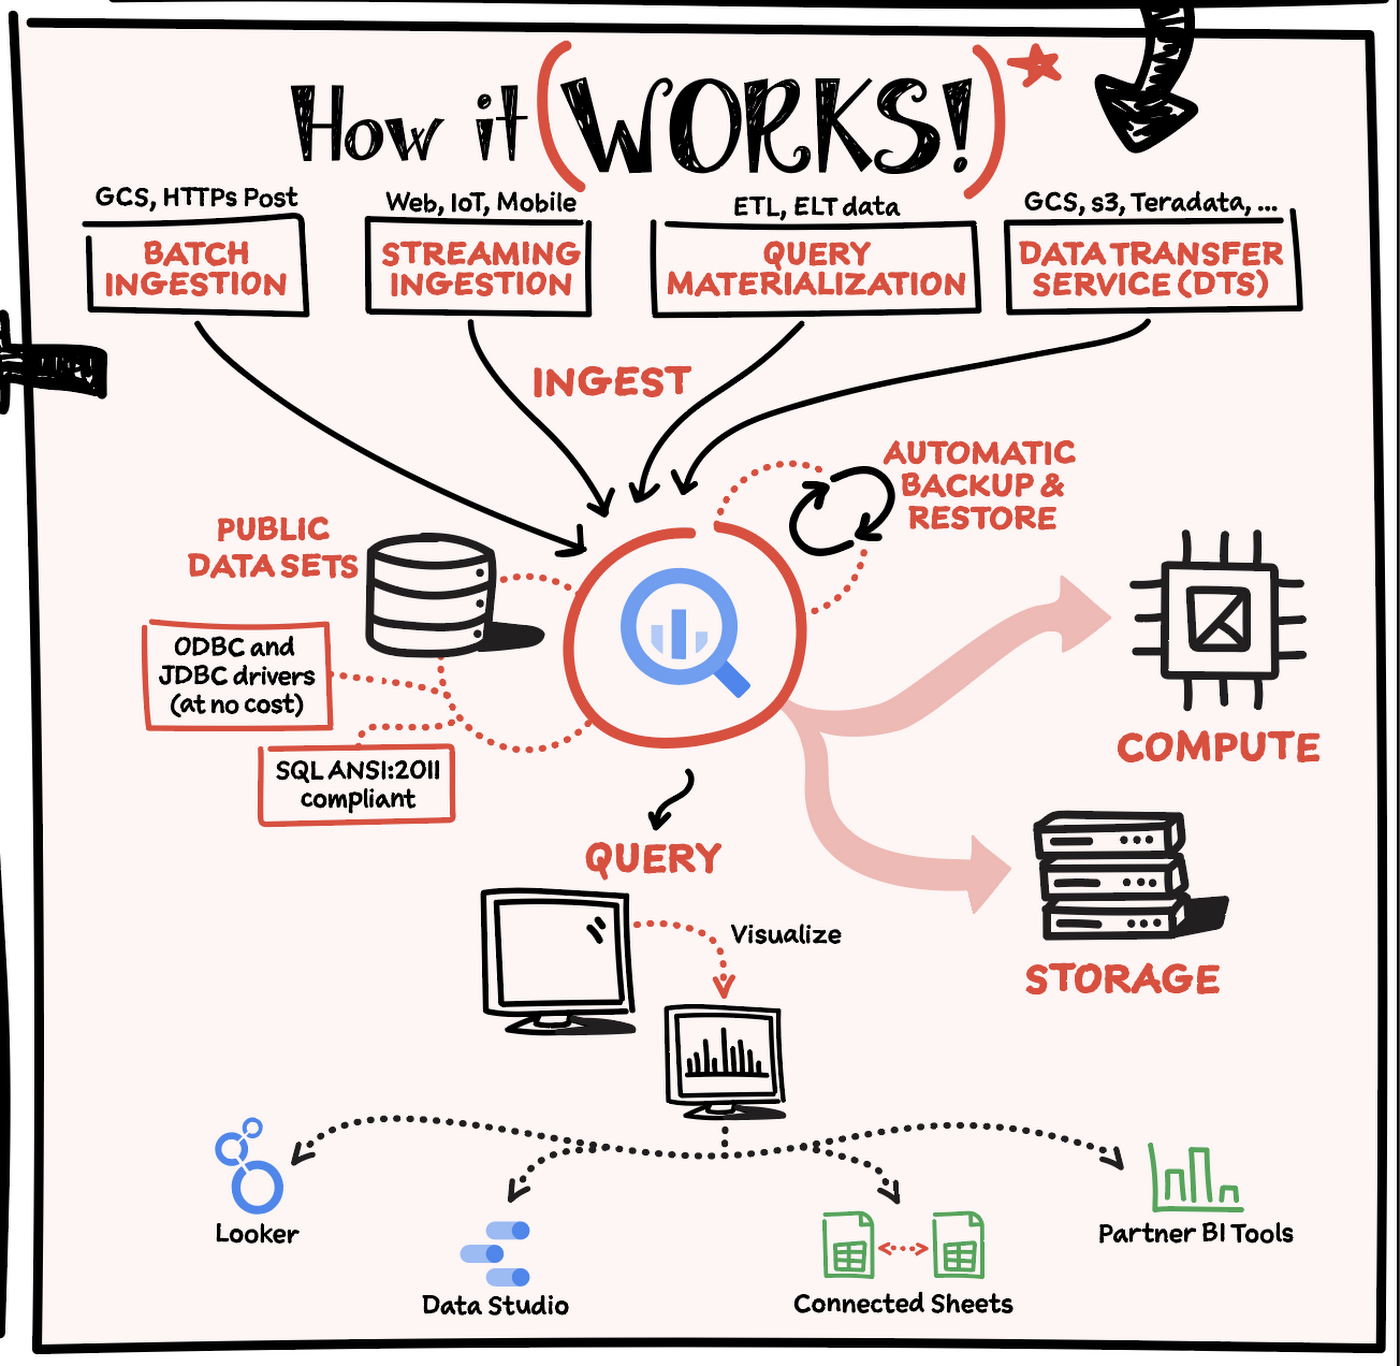
Here’s how it works: You ingest your own data into BigQuery or use data from the public datasets. Storage and compute are decoupled and can scale independently on demand. This offers immense flexibility and cost control for your business as you don’t need to keep expensive compute resources up and running all the time. As a result, BigQuery is much more cost-effective than traditional node-based cloud data warehouse solutions or on-premises systems. BigQuery also provides automatic backup and restore of your data.
You can ingest data into BigQuery in batches or stream real-time data from web, IoT, or mobile devices via Pub/Sub. You can also use Data Transfer Service to ingest data from other clouds, on-premises systems or third-party services. BigQuery also supports ODBC and JDBC drivers to connect with existing tools and infrastructure.
Interacting with BigQuery to load data, run queries, or create ML models can be done in three different ways. You can use the UI in the Cloud Console, the BigQuery command-line tool, or the API via client libraries available in several languages.
When it comes time to visualize your data, BigQuery integrates with Looker as well as several other business intelligence tools across the Google partner ecosystem.
What about security?
BigQuery offers built-in data protection at scale. It provides security and governance tools to efficiently govern data and democratize insights within your organization.
- Within BigQuery, users can assign dataset-level and project-level permissions to help govern data access. Secure data sharing ensures you can collaborate and operate your business with trust.
- Data is automatically encrypted both while in transit and at rest, ensuring that your data is protected from intrusions, theft, and attacks.
- Cloud DLP helps you discover and classify sensitive data assets.
- Cloud IAM provides access control and visibility into security policies.
- Data Catalog helps you discover and manage data.
How much does it cost?
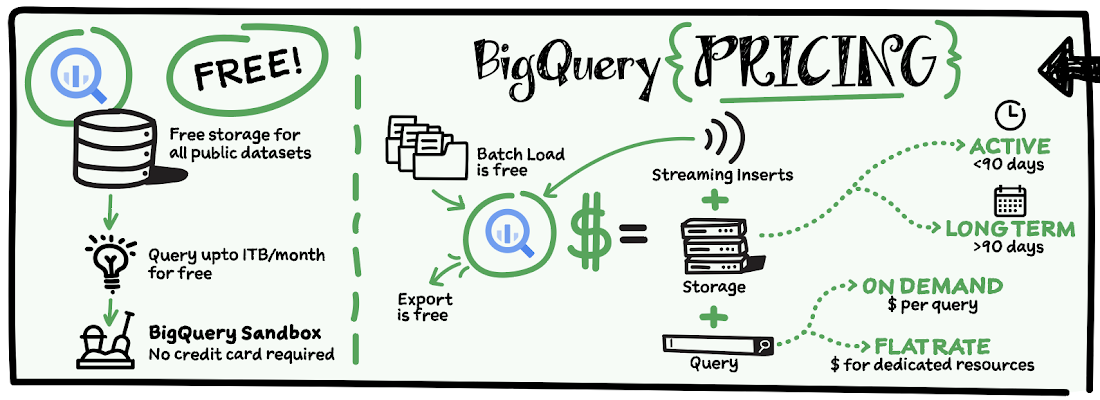
The BigQuery sandbox lets you explore BigQuery capabilities at no cost and confirm that BigQuery fits your needs. With BigQuery you get predictable price-performance: you pay for storing and querying data, and for streaming inserts. Loading and exporting data are free of charge. Storage costs are based on the amount of data stored, and have two rates based on how often the data is changing. Query costs can be either:
- On-demand – you are charged per query by the amount of data processed
- Flat-rate – if you prefer to purchase dedicated resources
You can start with the pay-as-you-go, on-demand option and later move to flat-rate if that better suits your usage. Or, start with flat-rate, get a better understanding of your usage and move to the pay-as-you-go models for additional workloads.
To explore BigQuery and its capabilities a bit more, check out the sandbox; and when you’re ready to modernize your data warehouse with BigQuery then check out the documentation to streamline your migration process here. https://www.youtube.com/embed/So-tVyBQt8E?enablejsapi=1&
For more #GCPSketchnote, follow the GitHub repo. For similar cloud content follow me on Twitter @pvergadia and keep an eye out on thecloudgirl.dev.
Mid-Sized B2B Firm Achieves the Business Trifecta with a Single Strategy

6905
Of your peers have already read this article.
2:45 Minutes
The most insightful time you'll spend today!
Thirteen years’ experience in e-commerce has given Teddy Chan, Chief Executive Officer and Chief Technology Officer, AfterShip, a deep understanding of the challenges of shipping and tracking packages to customers worldwide.
“The key problem many merchants face is customers asking ‘where is my order?’ and ‘when I will get the package?’” Chan says. “When I considered this issue, I came up with the idea of AfterShip.” Chan helped found AfterShip in 2011 to enable merchants to keep track of packages sent to customers via a web portal or an API. AfterShip also allows merchants to notify customers of anticipated delivery times.
“Using AfterShip, merchants can provide the same experience to buyers regardless of which couriers they use,” Chan says. “Merchants can also improve their customer engagement by including up-selling or marketing content with their delivery notifications.”
Hong Kong-headquartered AfterShip continues to grow quickly and now has a 40-person team. Thirty members of this team are based on the China special administrative region and 10 are based in India.
“Google Cloud Platform has a network of global datacentres with deep connectivity that enables us to put our infrastructure close to our customers. In addition, the ability to horizontally scale our global database using tools such as Google Cloud Spanner eliminates any limits on our geographic expansion.”
—Teddy Chan, Chief Executive Officer and Chief Technology Officer, AfterShip
By October 2017, the business was tracking about 30 million packages per month and had expanded its services to include label and rate calculation and self-service return. Revenue, package transaction numbers and team size have doubled every year for the past three years, while more than 300,000 merchants and 426 couriers are signed up to the service. Key customers include Wish, Etsy and Groupon.
Close to half AfterShip’s customers are based in the United States, about one third in Europe and the remainder are located in Asia. AfterShip had initially delivered its applications and services from an incumbent public cloud service. However, the company wanted to continue its growth trajectory while automating key infrastructure processes, implementing a continuous deployment model and controlling costs.
The business needed to achieve these objectives while maintaining a global presence and high-quality service. AfterShip started reviewing its options and decided to migrate to Google Cloud Platform (GCP). “Google Cloud Platform has a network of global datacentres with deep connectivity that enables us to place our infrastructure close to our customers,” Chan says.
“In addition, the ability to horizontally scale our global database using tools such as Google Cloud Spanner eliminates any limits to our geographic expansion. Furthermore, the managed services provided through GCP would allow us to focus on building better features for online merchants.” The reliability provided by GCP would also enable AfterShip to meet the stringent service level requirements of large digital marketplaces in the United States, Asia and elsewhere.
“Google Cloud Platform could manage the high volumes and enable us to deliver the service levels that would realise our ambition of becoming the number one tracking API platform in the world,” Chan says. “For example, with Google Cloud Platform, we can provide a 99.95% monthly uptime service level to our customers.” Finally, GCP provided managed solutions, including Google Kubernetes Engine powered by open source container orchestrator Kubernetes, that would enable AfterShip to automate processes such as scaling and enable its team to focus on developing applications.
AfterShip has moved its websites into GCP infrastructure in three datacentres around the world and anticipates completing the migration in Q4 2017. “Google provided a lot of assistance, particularly early in the project when we needed it,” Chan says. “They briefed us on several services we hadn’t known about that could replace the equivalents in the public cloud we were using previously.” The business then completed the migration using its own skilled team members. As well as Google Kubernetes Engine and Google Cloud Spanner, AfterShip is using Google BigQuery to store and analyse transaction information.
“Google Cloud Platform could manage the high volumes and enable us to deliver the service levels that would realise our ambition of becoming the number one tracking API platform in the world.”
—Teddy Chan, Chief Executive Officer and Chief Technology Officer, AfterShip
Deployment times down from one hour to two minutes
With deployment times falling from up to one hour in its previous cloud environment to about two minutes in GCP, AfterShip has been able to adopt a continuous deployment model. “This has improved our service levels,” Chan says. “If there are any issues we can fix them quickly, while we can iterate faster to create new features in response to customer requests or changes in the market. “This enables us to continue to lead our competitors.”
Targeting a 30 percent reduction in costs
AfterShip is now targeting a 30% reduction in costs by optimising its use of Docker containerisation technology on GCP.
“By using Docker with Kubernetes, we have been able to fine-tune our use of compute resources and better control our costs,” Chan says. “We’re extremely pleased with Google Cloud Platform as it really is built for engineers,” he adds. “In addition, its documentation is extremely clear, allowing us to troubleshoot or carry out activities on the platform ourselves. “We look forward to continuing to grow and extend our package tracking and associated services with Google Cloud Platform.”
New Enterprise Capabilities and Changes to Cloud Spanner Reduces Cost of Running Workloads by 90 Percent

5397
Of your peers have already read this article.
3:00 Minutes
The most insightful time you'll spend today!
Customers love Cloud Spanner because it gives them the benefits of relational semantics and SQL while also delivering the scale and availability of non-relational databases. Many of these customers want to move even more of their work to Spanner, and have requested smaller instance sizes to support development, testing and small production workloads. We’re happy to announce that they’ll soon get what they asked for: more granular instance sizing is coming to Spanner.
Granular instance sizing will be available in Public Preview soon. With this feature, you can run workloads on Spanner at as low as 1/10th the cost of regular instances, equating to approximately $65/month.
In addition, we are launching new enterprise capabilities to break down operational silos for real-time insights and provide greater database observability to developers:
- Datastream, now in public preview, is a change data capture (CDC) service that allows enterprises to synchronize data across heterogeneous databases and applications. With Spanner support in Datastream, users will be able to stream data from MySQL or Oracle to Spanner reliably and with minimal latency.
- BigQuery federation to Spanner (coming soon) lets users query transactional data residing in Spanner, from BigQuery, without moving or copying data.
- Key Visualizer, available now in public preview, provides interactive monitoring so developers can quickly identify trends and usage patterns in Spanner.
Democratizing access with more granular instance sizing
Today, customers provision Spanner instances by specifying the number of nodes they need to run their workloads. Each node can provide up to 10,000 queries per second (QPS) of reads or 2,000 QPS of writes (writing single rows at 1 KB of data per row) and 2 TB of storage. A Spanner node is replicated across 3 zones for regional instances, and 5 or more zones for multi-regional instances. The choice of node count determines the amount of serving and storage resources that are available to the databases in a given instance.
Historically, the most granular unit for provisioning resources on Spanner has been one node. To enable more granular control, we are introducing Processing Units (PUs); one Spanner node is equal to 1,000 PUs. Customers can now provision in batches of 100 PUs, and get a proportionate amount of compute and storage resources. This will allow teams to run smaller workloads on Spanner at much lower cost. With this feature, customers can start at 100 PUs and scale up as needed in batches of 100 PUs, to up to 1,000 PUs (1 node), all with zero downtime. Subsequently, customers can continue to scale up by adding more nodes, just like what they do today. Customers do have the choice of using either PUs or nodes to provision resources within workloads, when those workloads occupy multiple nodes of capacity.
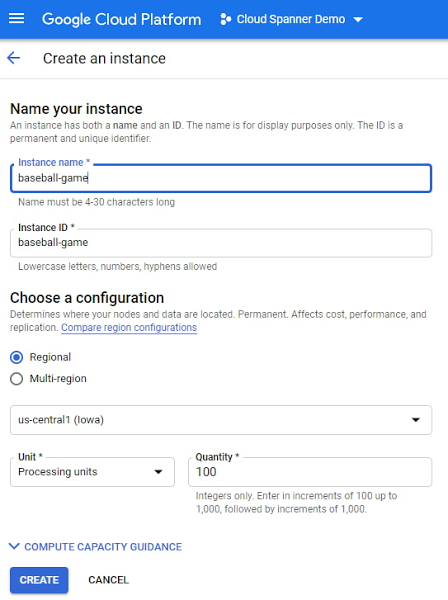
To illustrate with an example, let’s say a game developer creates a Spanner instance called “baseball-game” in us-central1, with 100 PU compute capacity at $65/month price.
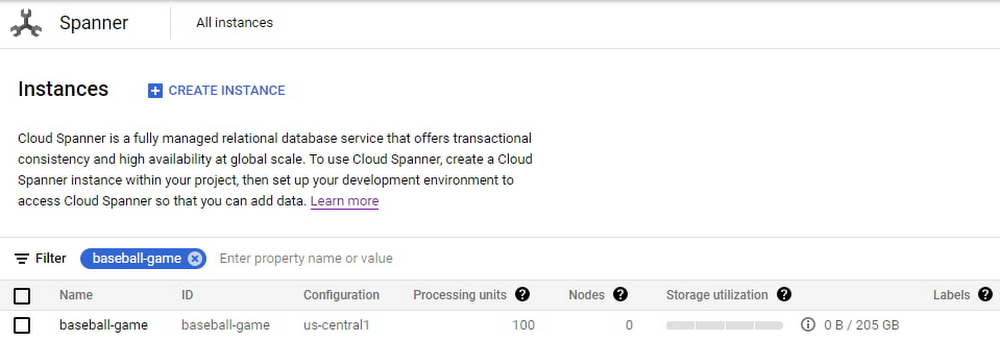
As you can see below, proportional maximum storage of 205 GB is assigned to the 100 PU instance.
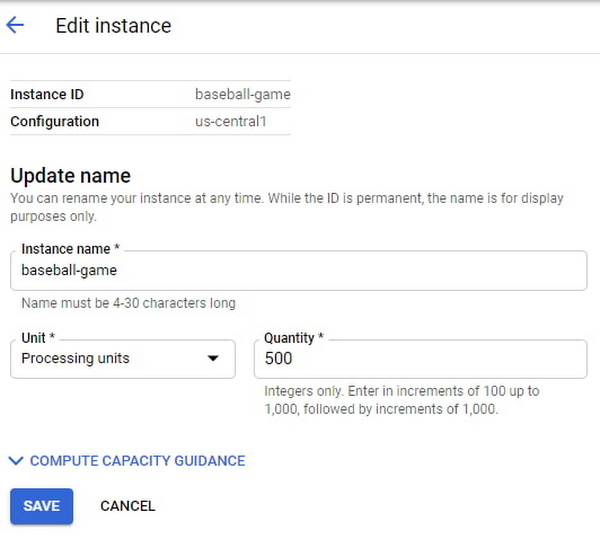
Once the game starts becoming popular and resource demands increase, the user edits the instance to increase the compute capacity to 500 PUs with proportional maximum 1 TB of storage.
The game grows in popularity, and the gaming company prepares to launch a much-awaited capability in the game. Anticipating a sharp increase in usage at launch day, the game developers increase the compute capacity to 3,000 PUs. Compute capacity assigned to the instance over a period of time can be viewed in Cloud Monitoring graphs:

Request Access
You can request early access to granular instance sizing feature by filling this form.
Breaking down operational silos with Datastream CDC and BigQuery federation
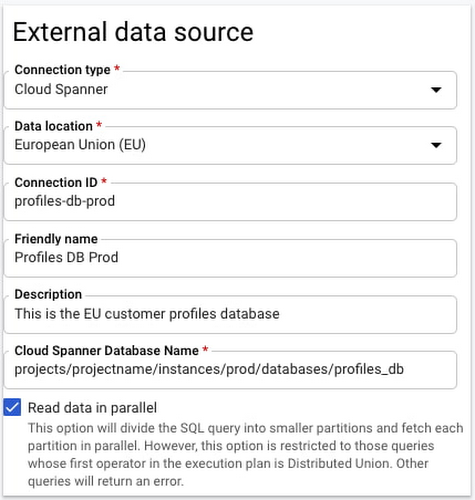
BigQuery Federation. BigQuery has made analytics easy by bringing together data from multiple sources for seamless analysis. Soon you’ll also be able to analyze data in Spanner directly in BigQuery. With Spanner’s BigQuery federation, you’ll be able to instantly query data residing in Spanner in real-time without moving or copying the data. Simply set up the Spanner as an external data source in BigQuery, as shown below.
Change Data Capture ingest. Now in public preview, Datastream lets you stream change data into Google Cloud from MySQL and Oracle databases. As of today, you can ingest this change data directly into Spanner using a built-in Dataflow template. This lets you migrate data from MySQL and Oracle databases into Spanner in near-real time.
Understanding performance and resource usage with Key Visualizer
Key Visualizer is a new interactive monitoring tool that lets developers and administrators analyze usage patterns in Spanner. It reveals trends and outliers in key performance and resource metrics for databases of any size, helping to optimize queries and reduce infrastructure costs. Designed for performance tuning and instance sizing, Key Visualizer is available today in public preview in the web-based Cloud Console for all Spanner databases at no additional cost. Learn more in the Key Visualizer blog.
Learn more
- To request early access to granular instance sizing in Spanner, fill out this form.
- To get started with Spanner today, create an instance or try it out with a Spanner Qwiklab.
Neo4J & Google Cloud: Graph Data in Cloud to Address Challenges in FinServ Industry

6904
Of your peers have already read this article.
3:00 Minutes
The most insightful time you'll spend today!
Over the last decade, financial service organizations have been adopting a cloud-first mindset. According to InformationWeek, lower costs and enhanced scalability were the biggest drivers for cloud adoption in financial services, and cloud-native applications allow access to the latest technology and talent, enabling adopters to rebuild transaction processing systems capable of supporting very high volumes and low latency.
Both Neo4j and Google Cloud have been using relationship-based data representations since the beginning, and we’re dedicated to using this technology to help financial services customers drive business transformation. We are excited about the prospects of financial services (FinServ) cloud systems and believe that graph data in the cloud can help solve significant challenges in the industry.
Data Challenge #1: Risk Management and Compliance
First among the top concerns for any CIO moving to the cloud is risk management and compliance. Disconnected, uncontextualized, or stale data create opportunities for fraud and financial crimes to occur. The fact is when it comes to FinServ, the question is not “if” but rather how often an attack will occur. Unfortunately, incidents have been trending upward over the last decade, and COVID has only exacerbated this reality. Financial crimes affect the bottom line both in the remediation of these crimes and in intangibles like brand value.
Add to this the complexity of international banking, which makes “compliance” a moving target. Penalties due to noncompliance are a constant concern to any FinServ organization.
The tabular representation of information with a fixed number of columns that never change prevents a description of an ever changing world with changing characteristics. Relational databases are great if the world you describe does not move fast but have limitations when data structures are highly interlinked and not homogeneous.
Neo4j Aura on Google Cloud provides a foundation for creating dynamic, futureproof, scalable applications that adhere to the security standards and protocols today’s financial services organizations require to meet the challenges of finding and preventing bad actors. This also includes enterprise scalability; reaching over 1 Billion nodes and relationships to streamline queries and provide solutions that meet regulatory and privacy compliance across geographies. Neo4j has helped some organizations save billions of USD in fraud in the first year of deployment alone.
What makes graph technology the best choice for fraud detection use cases is that the relationships between the data-points are as important as the data-points themselves. Let’s take as an example, one John Smith approaches a multi-national banking institution to manage the primary account for his new holding corporation.
While no one has any record of John R Smith Holdings LLC, the bank’s application built on graph technology understands that there are several well-known entities owned by John Smith Holdings. The application also identifies several well-known board members who bank with this institution. Due to this relationship-driven approach, the bank now understands John R Smith is not “John Smith,” who previously attempted to open an account for his holding corporation, which had no information associated with it prior to two months ago.
Data Challenge #2 Manual Processes and Inefficiencies
The ubiquity of the cloud offers an opportunity to deploy automation at unprecedented levels to tackle the errors and inefficiencies that manual processing allows to creep into processes. When data comes from disparate, perhaps legacy systems – which may have become siloed and “untouchable” over the years – further complexity arises. As an example, if someone in sales types “John Smith” into a CRM system not knowing that John R Smith is the spelling in the customer data master, it may result in two separate and potentially conflicting records. Being able to join those records together in a mastered view helps to solve this problem. In addition, low data quality equates to an increase in risk, costs, and implementation times for new systems.
Neo4j Aura on Google Cloud provides automation and artificial intelligence (AI) that reduces manual processes and the errors that accompany them. In this graph architecture each node, which can represent a person, will have labels, relationships, and properties associated with it. This allows for the use of AI which can easily understand that John Smith in the CRM is the same John R Smith in the customer master. The information contained in Neo4j can be connected bi-directionally to ensure consistency across applications and data sources.
One of the benefits of this approach is that linking information allows organizations to keep the full value of the data, rather than forcing the data into predetermined tabular representations, with the risk of losing valuable information and insights.
Data Challenge #3: Customer Engagement and Insight
Another significant concern is the high expectations today’s customers have for every interaction. End users are accustomed to predictable experiences on their digital devices, and FinServ apps are no exception. Added to this, the “Covid economy” has driven digital adoption significantly across demographics; even among customers who might traditionally have used in-person services. This also equates to increased expectations for personalized, predictable experiences with every digital interaction. We know that latency has always been a key consideration for financial trading, but a recent ComputerWeekly study showed that every financial organization should ensure their visible latency is at 10 milliseconds or less. Customers no longer accept their broadband is at fault.
Finally, blind spots in the customer journey often result in dissatisfaction, which ultimately leads to increased churn. Without gaining actionable insights from your customers, there is no room to innovate and iterate on what they are looking for in your products and services. And this translates to losing market share and competitive advantage.
The NoSQL architecture, specifically the dynamic schema and structure of Neo4j Aura gives you the ability to take charge of your data and make changes according to your development cycles or newer data models. This equates to faster builds, more comprehensive releases and a wider, richer data-set that can be contextualized and understood instantly. Graph technology is the logical choice for building a Customer 360 application. Under this approach organizations not only get valuable insight into the individual client’s behavior and patterns, but also those of their family, friends and colleagues. This allows for stronger personalization, targeted campaigns and successful execution, resulting in increased customer satisfaction and retention levels.
Graph Technology on Google Cloud

Neo4j is a recognized leader in graph database technology and the only fully integrated graph solution on Google Cloud, helping to fill a common need for Google Cloud customers. Both Neo4j and Google Cloud are invested in continuing to grow our partnership and mutual product direction.
You can find and deploy the Neo4j graph database straight from the Google Cloud marketplace, whether you want to download the software for an on-premises deployment, use the virtual machine image, or use the hosted solution, Aura on Google Cloud, the graph database-as-a-service. In any deployment, you get the same enterprise-grade scalability, reliability, and connectivity along with successful, repeatable use cases you can rely on to resolve your particular challenges and integrated billing.
For a real-world example of how graph technology can optimize financial services, you can read our Case Study with fintech Current. Current, a leading U.S. financial technology platform with over three million members, used Neo4j Aura on Google Cloud to create a personalization engine based on client relationships.
To learn more about Neo4j Aura on Google Cloud for FinServ organizations, register for our webinar on Thursday, December 16 with Jim Webber, Chief Scientist, CTO Field Ops at Neo4j and Antoine Larmanjat, Technical Director, Office of the CTO, Google Cloud.
Statsig’s Journey to Seamless Data Management with Google BigQuery

1202
Of your peers have already read this article.
3:30 Minutes
The most insightful time you'll spend today!
Statsig is a modern feature management and experimentation platform used by hundreds of organizations. Statsig’s end-to-end product analytics platform simplifies and accelerates experimentation with integrated feature gates (flags), custom metrics, real-time analytics tools, and more, enabling data-driven decision-making and confident feature releases. Companies send their real-time event-stream data to Statsig’s data platform, which, on average, adds up to over 30B events a day and has been growing at 30-40% month over month.
With these fast-growing event volumes, our Spark-based data processing regularly ran into performance issues, pipeline bottlenecks, and storage limits. In turn, this rapid data growth negatively impacted the team’s ability to deliver product insights on time. The sustained Spark tuning efforts that we were dealing with made it challenging to keep up with our feature backlog. Instead of spending time building new features for our customers, our engineering team was controlling significant increases in Spark’s runtime and cloud costs.
Adopting BigQuery pulled us out of Spark’s recurring spiral of re-architecture and into a Data Cloud, enabling us to focus on our customers and develop new features to help them run scalable experimentation programs.
The growing data dilemma
At Statsig, our processing volumes were growing rapidly. The assumptions and optimizations we madea month ago would become irrelevant the next month. While our team was knowledgeable in Spark performance tuning, the benefits of each change were short lived and became obsolete almost as quickly as it was implemented. As the months passed, our data teams were dedicating moretime to optimizing and tuning Spark clusters instead of building new data products and features. We knew we needed to change our data cloud strategy.
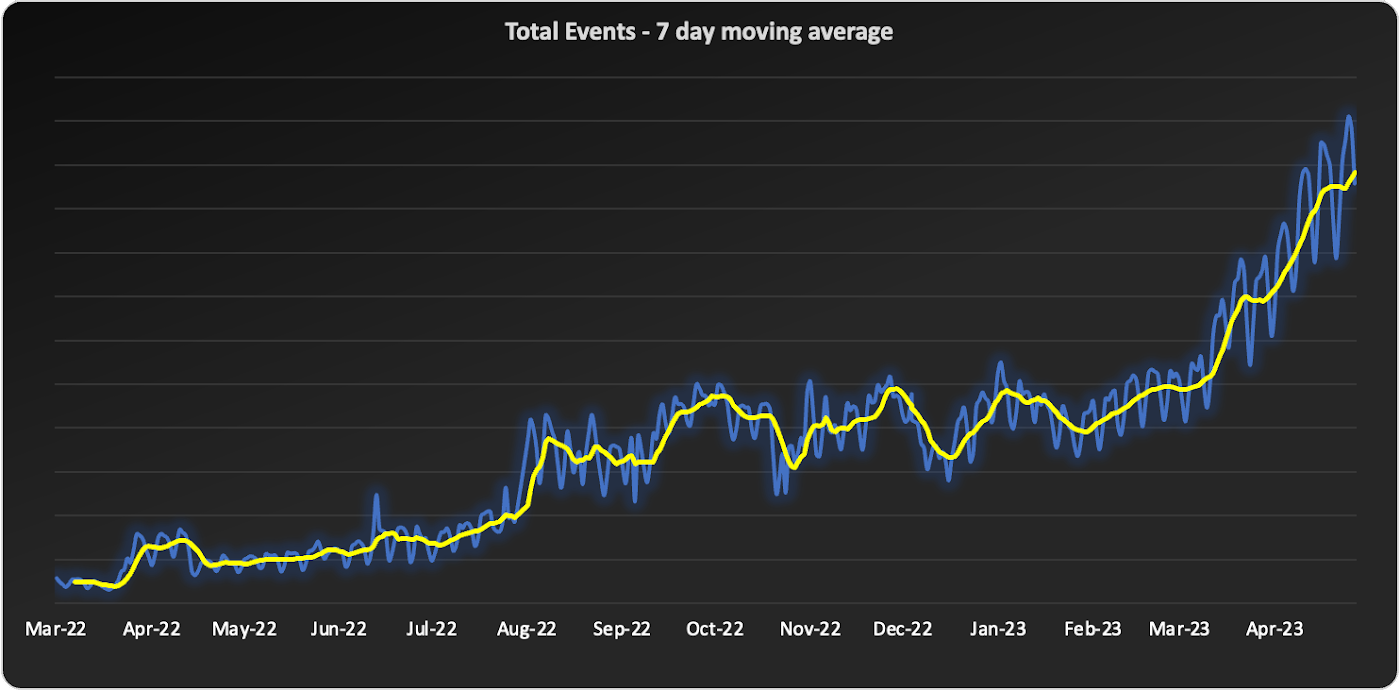
We started to source advice from companies and startups who had faced similar data scaling challenges – the resounding recommendation was “Go with BigQuery.” Initially, our team was reluctant. For us, a BigQuery migration would require an entirely new data warehouse and a cross-cloud migration to GCP.
However, during a company-wide hackathon, a pair of engineers decided to test BigQuery with our most resource-intensive job. Shockingly, this unoptimized job finished much faster and at a lower cost than our current finely-tuned setup. This outcome made it impossible for us to ignore a BigQuery migration any longer. We set out to learn more.
Investigating BigQuery
When we started our BigQuery journey, the first and obvious thing we had to understand was how to actually run jobs. With Spark, we were accustomed to daunting configurations, mapping concepts like executors back to virtual machines, and creating orchestration pipelines for all the tracking and variations required.
When we approached running jobs on BigQuery, we were surprised to learn that we only needed to configure the number of slots allocated to the project. Suddenly, with BigQuery, there were no longer hundreds of settings affecting query performance. Even before running our first migration test, BigQuery had already eliminated an expensive and tedious task list of optimizations our team would typically need to complete.
Digging into BigQuery, we learned about additional serverless optimizations that BigQuery offered out of the box that addressed many of the issues we had with Spark. For example, we often had a single task get stuck with Spark because virtual machines would be lost or the right VM shape needed to be attainable. With BigQuery’s autoscaling, SQL jobs are much more granularly defined and can move resources as needed between multiple jobs. As another example, we sometimes encountered a storage issue with Spark due to the shuffled data overwhelming a machine’s disk. On BigQuery, there is a separate in-memory shuffle service that eliminates the need for our team to worry about predicting and sizing shuffle disk sizes.
At this point, it was clear that the migration away from the DevOps of Spark and into the serverless BigQuery architecture would be worth the effort.
Spark to BigQuery migration
When migrating our pipelines over, we ran into situations where we had to rewrite large blocks of code, making it easy to introduce new bugs. We needed a way to simultaneously stage this migration without committing to huge rewrites . Dataproc is a very useful tool for this purpose. Dataproc provides us with a simple yet flexible API to spin up Spark clusters and gives us access to the full swath of configurations and optimizations that we’re accustomed to from our previous Spark deployments.
Additionally, BigQuery offers a direct Spark integration through stored procedures with Apache Spark, which provides a fully managed and serverless Spark experience native to BigQuery and allows you to call Spark code directly from BigQuery SQL. It can be configured as part of the BigQuery autoscaler and called from any orchestration tool that can execute SQL, such as dbt.
This ability to mix and match BigQuery SQL and multiple options for Spark gave us the flexibility to move to BigQuery immediately but roll out the entire migration on our timeline.
With BigQuery, we’re back to building features
With BigQuery, we could to tap into performance improvements, direct cost savings, and experienced a reduction in our data pipeline error rates. However, BigQuery really changed our business by unlocking new real-time features that we didn’t have before. A couple of examples are:
1. Fresh, fast data results
On our Spark cluster, we needed to pre-compute tens of thousands of possible results each day if a customer wanted to look at a specific detail. While only a small percentage of results would get viewed each day, we couldn’t predict which results would be needed, so we had to pre-compute it all. With BigQuery, the queries run much faster, so we now compute specific results when customers need them. We benefit from avoiding expensive jobs. To our customers, this translates into fresher data.
2. Real-time decision features
Since our migration to BigQuery began, we have rolled out several new features powered by BigQuery’s ability to compute things in near real-time, enhancing our customers’ ability to make real-time decisions.
1) A metrics explorer that lets our customers query their metric data in real-time.
2) A deep dive experience that lets our customers instantly dig into a specific user’s details instead of waiting on a 15-minute Spark job to process.
3) A warehouse-native solution that lets our customers use their own BigQuery project to run analysis.
Migrating from Spark to BigQuery has simplified many of our workflows and saved us significant money. But equally importantly, it has made it easier to work with massive data, reduced the strain on our perpetually stretched-thin data team, and allowed us to build awesome products faster for our customers.
Getting started with BigQuery
There are a few ways to get started with BigQuery. New customers get $300 in free credits to spend on BigQuery. All customers get 10GB storage and up to 1TB queries free per month, not charged against their credits. You can get these credits by signing up for the BigQuery free trial. Not ready yet? You can use the BigQuery sandbox without a credit card to see how it works.
The Built with BigQuery advantage for ISVs
Google is helping tech companies like Statsig build innovative applications on Google’s data cloud with simplified access to technology, helpful and dedicated engineering support, and joint go-to-market programs through the Built with BigQuery initiative.
More on Statsig
Companies want to understand the impact of their new features on the business, test different options, and identify optimal configurations that balance customer success with business impact. But running these experiments is hard. Simple mistakes can cause you to make wrong decisions, and lack of standardization can make results hard to compare, and reduce user trust. When implemented poorly, an experimentation program can become a bottleneck, causing feature releases to slow down or, in some cases, causing teams to skip experimentation altogether. Statsig provides an end-to-end product experimentation and analytics platform that makes it simple for companies to leverage best-in-class experimentation tooling.
If you’re looking to improve your company’s experimentation process, visit statsig.com and explore what our platform can offer. We have a generous free tier and a community of experts on Slack to help ensure your efforts are successful. Boost your business’s growth with Statsig and unlock the full potential of your data.
More Relevant Stories for Your Company

BigQuery Reference Guide: Understanding Tables within and Routine for Data Transformation
Last week in our BigQuery Reference Guide series, we spoke about the BigQuery resource hierarchy - specifically digging into project and dataset structures. This week, we’re going one level deeper and talking through some of the resources within datasets. In this post, we’ll talk through the different types of tables

Unlocking the Potential of Advanced Analytics with BigQuery and Connected Vehicle Data
As software-defined vehicles continue to advance and the quantity of digital services grows to meet consumer demand, the data required to provide these services continue to grow as well. This makes automotive manufacturers and suppliers look for capabilities to log and analyze data, update applications, and extend commands to in-vehicle

Dataflow is getting better with Dataflow Prime, Dataflow Go, and Dataflow ML
By the end of 2024, 75% of enterprises will shift from piloting to operationalizing artificial intelligence according to IDC, yet the growing complexity of data types, heterogeneous data stacks and programming languages make this a challenge for all data engineers. With the current economic climate, doing more with cheaper costs

Brazilian Insurer Uses Google BigQuery to Underwrite Critical Decisions
To stay competitive in the rapidly changing insurance marketplace, Mitsui Sumitomo Seguros (MSS) recognized the need to leverage its available data to stabilize and scale existing operations, improve sales decisions and better engage employees. MSS managers required frequent and easy access to newly organized data (including performance metrics and market
