





6521
Of your peers have already watched this video.
46:30 Minutes
The most insightful time you'll spend today!
The Inside Story of How Home Depot Migrated to Google BigQuery From an On-prem DW Solution
In the media, you will often hear story of how born-in-the-cloud companies manage with massive infrastructure.
But it is one thing is to be a startup, and build infrastructure with bespoke requirements. And quite another to have a complex, multinational organization with online, with mobile, with brick-and-mortar presence, and hundreds of thousands of SKUs and professional services, and many, many years of technology, innovation, and really smart engineers.
This is the second story. The story of how The Home Depot, the number-one home improvement retailer in the US pulled of that feat.
The Home Depot has over 2,200 stores, over 4 lakh associates, and 2017 revenues of over a $100 billion.
In this video, Rick Ramaker, technology director, data analytics at The Home Depot, and Kevin Scholz, distinguished engineer, The Home Depot, talk about how the company transformed and modernised its data warehousing, the challenges they faced and the benefits they accrued from the project.
It’s a fascinating watch!
6094
Of your peers have already watched this video.
1:30 Minutes
The most insightful time you'll spend today!
Explore the Innovations and Architecture Powering Spanner and BigQuery
Previously, databases had architectures with tightly coupled storage and compute. This resulted in higher latency, and with faster networks these constraints no longer surface. With Google Cloud’s BigQuery and CloudSpanner, the storage and compute architecture have been separated, allowing for better scalability and availability to address businesses’ high throughput data needs.
Watch the video to understand how these database and analysis products leverage Google’s distributed storage system, in-house custom network hardware and software, internal cluster management system and more!
11 Google Cloud Analytics Tools, Each Explained Simply in Under 2 Minutes

3566
Of your peers have already read this article.
22:00 Minutes
The most insightful time you'll spend today!
Need a quick overview of Google Cloud analytics technologies? Quickly learn these 11 Google Cloud products—each explained in under two minutes.
BigQuery in a minute
Storing and querying massive datasets can be time consuming and expensive without the right infrastructure. This video gives you an overview of BigQuery, Google’s fully-managed data warehouse. Watch to learn how to ingest, store, analyze, and visualize big data with ease.
Firestore in a minute
Cloud Firestore is a NoSQL document database that lets you easily store, sync, and query data for your mobile and web apps, at global scale. In this video, learn how use Firestore and discover features that simplify app development without compromising security.
Cloud Spanner in a minute
Cloud Spanner is a fully managed relational database with unlimited scale, strong consistency, and up to 99.999% availability. In this video, you’ll learn how Cloud Spanner can help you create time-sensitive, mission critical applications at scale.
Cloud SQL in a minute
Cloud SQL is a fully-managed database service that helps you set up, maintain, manage, and administer your relational databases on Google Cloud. In this video you’ll learn how Cloud SQL can help you with time-consuming tasks such as patches updates, replicas, and backups so you can focus on designing your application.
Memorystore in a minute
Memorystore is a fully managed and highly available in-memory service for Google Cloud applications. This tool can automate complex tasks, while providing top-notch security by integrating IAM protocols without increasing latency. Watch to learn what Memorystore is and what it can do to help in your developer projects.
Bigtable in a minute
Cloud Bigtable is a fully managed, scalable NoSQL database service for large analytical and operational workloads. In this video, you’ll learn what Bigtable is and how this key-value store supports high read and write throughput, while maintaining low latency.
BigQuery ML in a minute
BigQuery ML lets you create and execute machine learning models in BigQuery by using standard SQL queries. In this video, learn how you can use BigQuery ML for your machine learning projects.
Dataflow in a minute
Dataflow is a fully managed streaming analytics service that minimizes latency, processing time, and cost through autoscaling and batch processing. In this video, learn how it can be used to deploy batch and streaming data processing pipelines.
Cloud Pub/Sub in a minute
Cloud Pub/Sub is an asynchronous messaging service that decouples services that produce events from services that process events. In this video, you’ll learn how you can use it for message storage, real-time message delivery, and much more, while still providing consistent performance at scale and high availability.
Dataproc in a minute
Dataproc is a managed service that lets you take advantage of open source data tools like Apache Spark, Flink and Presto for batch processing, SQL, streaming, and machine learning. In this video, you’ll learn what Dataproc is and how you can use it to simplify data and analytics processing.
Data Fusion in a minute
Cloud Data Fusion is a fully managed, cloud-native, enterprise data integration service for quickly building and managing data pipelines. In this video, you’ll learn how Cloud Data Fusion can help you build smarter data marts, data lakes, and data warehouses.
A Look Back on Google Cloud’s Data Analytics Development Efforts from June

5982
Of your peers have already read this article.
4:00 Minutes
The most insightful time you'll spend today!
June is the month that holds the summer solstice, and some of us in the northern hemisphere get to enjoy the longest days of sunshine out of the entire year. We used all the hours we could in June to deliver a flurry of new features across BigQuery, Dataflow, Data Fusion, and more. Let’s take a look!
Simple, Sophisticated, and Secure
Usability is a key tenant of our data analytics development efforts. Our new user-friendly BigQuery improvements this month include:
- Flexible data type casting
- Formatting to change column descriptions
- GRANT/REVOKE access control commands using SQL
We hope this will delight data analysts, data scientists, DBAs, and SQL-enthusiasts who can find out more details in our blog here.
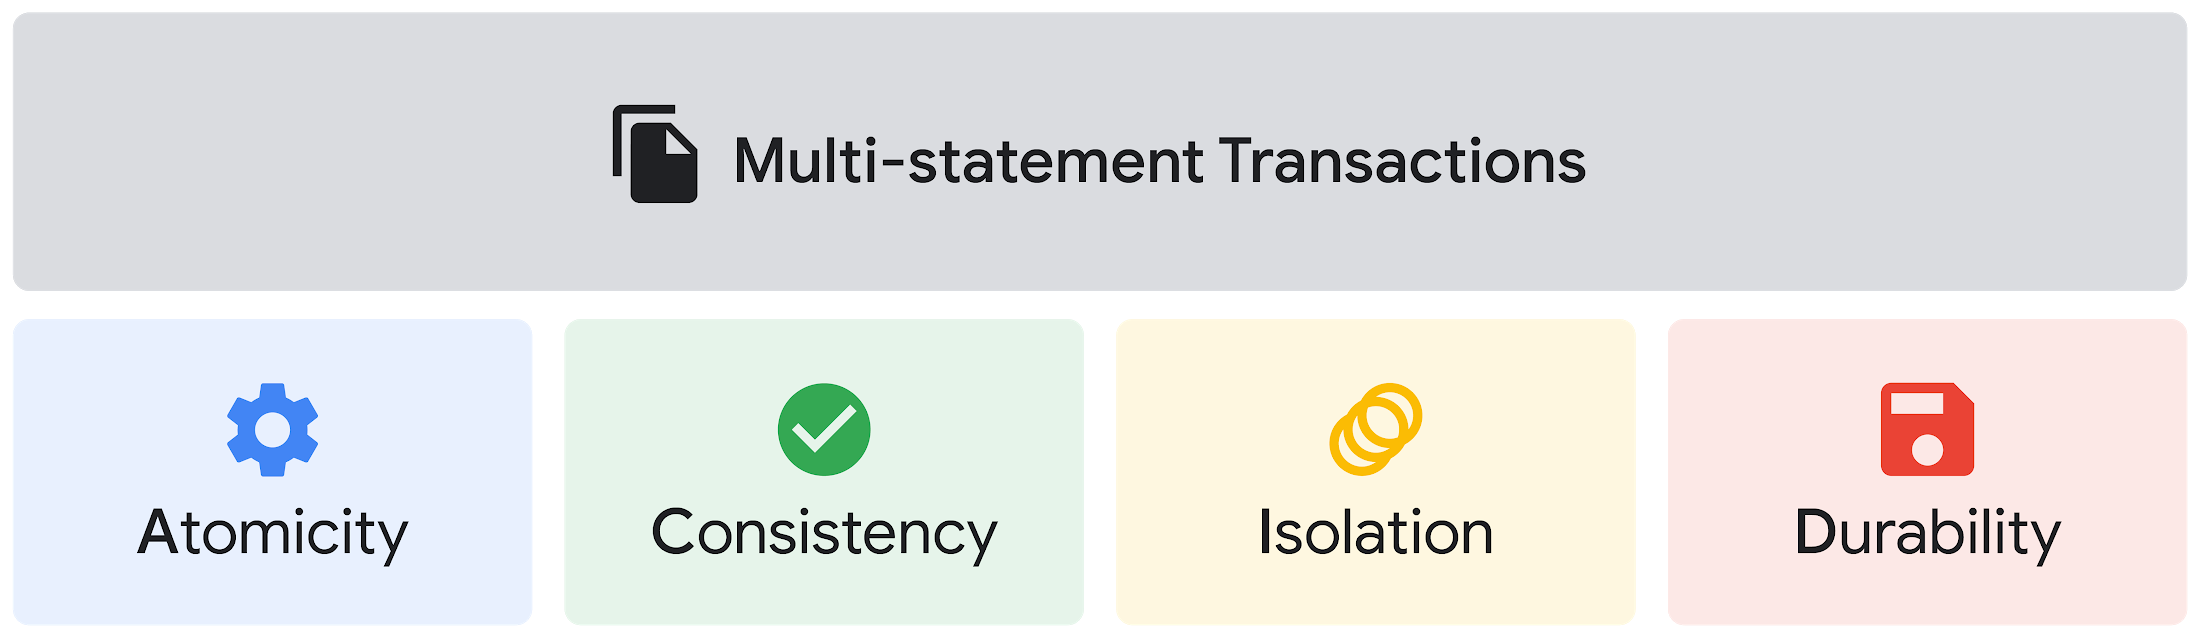
Beyond simplifying commands, we also recognize that it’s equally important to have more sophistication when dealing with transactions. That’s why we introduced multi-statement transactions in BigQuery.
As you probably know, BigQuery has long supported single-statement transactions through DML statements, such as INSERT, UPDATE, DELETE, MERGE and TRUNCATE, applied to one table per transaction. With multi-statement transactions, you can now use multiple SQL statements, including DML, spanning multiple tables in a single transaction.
This means that any data changes across multiple tables associated with all statements in a given transaction are committed atomically (all at once) if successful—or all rolled back atomically in the event of a failure.
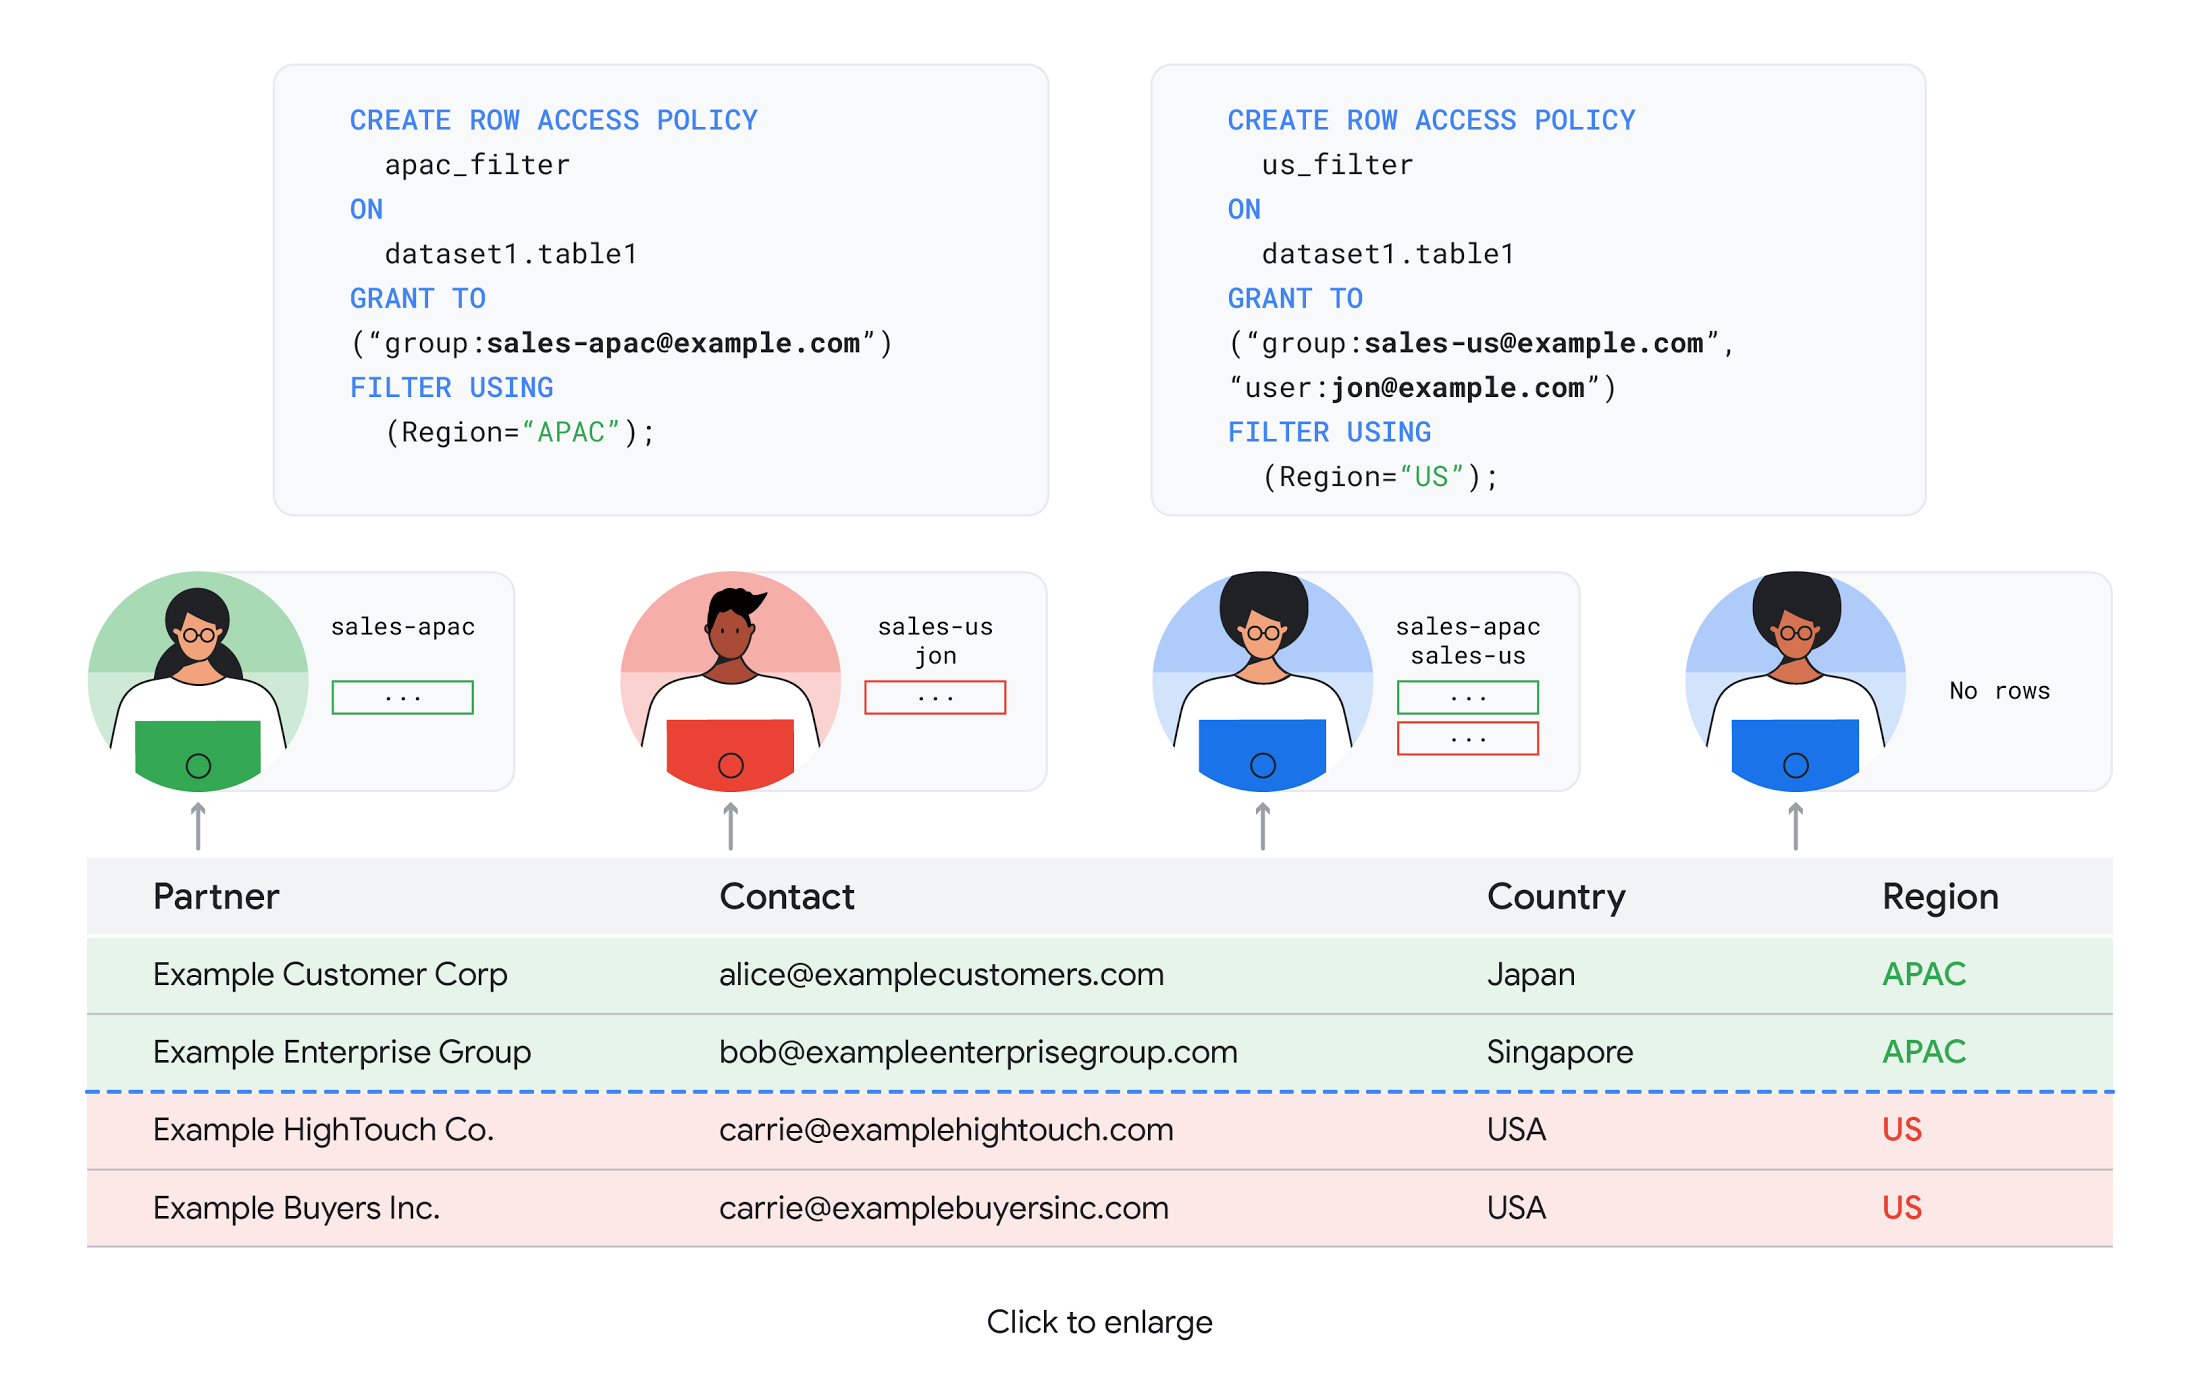
We also know that organizations need to control access to data, down to the granular level and that, with the complexity of data platforms increasing day by day, it’s become even more critical to identify and monitor who has access to sensitive data.
To help address these needs, we announced the general availability of BigQuery row-level security. This capability gives customers a way to control access to subsets of data in the same table for different groups of users. Row-level security in BigQuery enables different user personas access to subsets of data in the same table and can easily be created, updated, and dropped using DDL statements. To learn more, check out the documentation and best practices.
Simple, Safe, and Smart
Beyond building a simpler, more sophisticated and more secure data platform for customers, our team has been focused on providing solutions powered by built-in intelligence. One of our core beliefs is that for machine learning to be adopted and useful at scale, it must be easy to use and deploy.
BigQuery ML, our embedded machine learning capabilities, have been adopted by 80% of our top customers around the globe and it has become a cornerstone of their data to value journey.
As part of our efforts, we announced the general availability of AutoML tables in BigQuery ML. This no-code solution lets customers automatically build and deploy state-of-the-art machine learning models on structured data. With easy integration with Vertex AI, AutoML in BQML makes it simple to achieve machine learning magic in the background. From preprocessing data to feature engineering and model tuning all the way to cross validation, AutoML will “automagically” select and ensemble models so everyone—even non-data scientists—can use it.
Want to take this feature for a test drive? Try it today on BigQuery’s NYC Taxi public dataset following the instructions in this blog!
Speaking of public datasets, we also introduced the availability of Google Trends data in BigQuery to enable customers to measure interest in a topic or search term across Google Search. This new dataset will soon be available in Analytics Hub and will be anonymized, indexed, normalized, and aggregated prior to publication.
Want to ensure your end-cap displays are relevant to your local audience? You can take signals from what people are looking for in your market area to inform what items to place. Want to understand what new features could be incorporated into an existing product based on what people are searching for? Terms that appear in these datasets could be an indicator of what you should be paying attention to.
All this data and technology can be put to use to deploy critical solutions to grow and protect your business. For example, it can be difficult to know how to define anomalies during detection. If you have labeled data with known anomalies, then you can choose from a variety of supervised machine learning model types that are already supported in BigQuery ML.
But what if you don’t know what kind of anomaly to expect, and you don’t have labeled data? Unlike typical predictive techniques that leverage supervised learning, organizations may need to be able to detect anomalies in the absence of labeled data.
That’s why, we were particularly excited to announce the public preview of new anomaly detection capabilities in BigQuery ML that leverage unsupervised machine learning to help you detect anomalies without needing labeled data.
Our team has been working with a large number of enterprises who leverage machine learning for better anomaly detection. In financial services for example, customers have used our technology to detect machine-learned anomalies in real-time foreign exchange data.
To make it easier for you to take advantage of their best practices, we teamed up with Kasna to develop sample code, architecture guidance, and a data synthesizer that generates data so you can test these innovations right away.
Simple, Scalable, and Speedy
Capturing, processing and analyzing data in motion has become an important component of our customer architecture choices. Along with batch processing, many of you need the flexibility to stream records into BigQuery so they can become available for query as they are written.
Our new BigQuery Storage Write API combines the functionality of streaming ingestion and batch loading into a single API. You can use it to stream records into BigQuery or even batch process an arbitrarily large number of records and commit them in a single atomic operation.
Flexible systems that can do batch and real-time in the same environment is in our DNA: Dataflow, our serverless, data processing service for streaming and batch data was built with flexibility in mind.
This principle applies not just to what Dataflow does but also how you can leverage it—whether you prefer using Dataflow SQL right from the BigQuery web UI, Vertex AI notebooks from the Dataflow interface, or the vast collection of pre-built templates to develop streaming pipelines.
Dataflow has been in the news quite a bit recently. You might have noted the recent introduction of Dataflow Prime, a new no-ops, auto-tuning functionality that optimizes resource utilization and further simplifies big data processing. You might have also read that Google Dataflow is a Leader in The 2021 Forrester Wave™: Streaming Analytics, giving Dataflow a score of 5 out of 5 across 12 different criteria.
We couldn’t be more excited about the support the community has provided to this platform. The scalability of Dataflow is unparalleled and as you set your company up for more scale, more speed, and “streaming that screams”, we suggest you take a look at what leaders at Sky, RVU or Palo Alto Networks have already accomplished.
If you’re new to Dataflow, you’re in for a treat: this past month, Priyanka Vergadia (AKA CloudGirl) released a great set of resources to get you started. Read her blog here and watch her introduction video below!
https://youtube.com/watch?v=WRspZRG9e90%3Fenablejsapi%3D1%26
Simple structure that sticks together
We thrive to be the partner of choice for your transformation journey, regardless where your data comes from and how you choose to unify your data stack.
Our partners at Tata Consultancy Services (TCS) recently released research that highlights the importance of a unifying digital fabric and how data integration services like Google Cloud Data Fusion can enable their clients to achieve this vision.
We also announced SAP Integration with Cloud Data Fusion, Google Cloud’s native data integration platform, to seamlessly move data out of SAP Business Suite, SAP ERP and S4/HANA. To date, we provide more than 50 pipelines in Cloud Data Fusion to rapidly onboard SAP data.
This past month, we introduced our SAP Accelerator for Order to Cash. This accelerator is a sample implementation of the SAP Table Batch Source feature in Cloud Data Fusion and will help you get started with your end-to-end order to cash process and analytics.
It includes sample Cloud Data Fusion pipelines that you can configure to connect to your SAP data source, perform transformations, store data in BigQuery, and set up analytics in Looker. It also comes with LookML dashboards which you can access on Github.
Countless great organizations have chosen to work with Google for their SAP data. In June, we wrote about ATB Financial’s journey and how the company uses data to better serve over 800,000 customers, save over CA$2.24 million in productivity, and realize more than CA$4 million in operating revenue through “D.E.E.P”, a data exposure enablement platform built around BigQuery.
Finally, if you are an application developer looking for a unified platform that brings together data from Firebase Crashlytics, Google Analytics, Cloud Firestore, and third party datasets, we have good news!
This past month, we released a unified analytics platform that combines Firebase, BigQuery, Google Looker and FiveTran to easily integrate disparate data sources, and infuse data into operational workflows for greater product development insights and increased customer experience. This resource comes with sample code, a reference guide and a great blog! We hope you enjoy it. See you all next month!
https://youtube.com/watch?v=L25Vfzr2Ciw%3Fenablejsapi%3D1%26
S4 Agtech Transforms Agriculture with Google Cloud

7500
Of your peers have already read this article.
8:30 Minutes
The most insightful time you'll spend today!
Like countless other industries, farming is going digital and undergoing big changes—driven by access to more actionable information. The agriculture business can now gather and analyze georeferenced data from satellites, combined with data from IoT sensors in fields, crop rotation and yield histories, weather patterns, seed genotypes and soil composition to help increase the quantity and quality of crops.
This is essential for businesses in the agriculture industry, but it’s also critical to address growing food shortages around the world.
At S4, we create technology to de-risk crop production. We provide customers seeking agricultural risk management solutions with the tools to make better, data-driven decisions for their crop planning, based on machine learning and proprietary algorithms.
We interpret plant evolution on a global scale with predictive modeling and analytics, and offer super-efficient risk-transferring solutions. Our multi-cloud platform includes a petabyte-scale database, an open source stack, and—after 50 proof-of-concept evaluations—BigQuery for our data warehouse and the Cloud SQL database service to handle OLTP queries to our PostgreSQL database.
These PoCs included, among others, Microsoft Azure Data Lake Analytics, IBM Netezza, Postgres/PostGIS running on IBM bare-metal servers with SATA SSDs and on Google’s Compute Engine with NVMe disks, and on-premises memSQL, CitusData and Yandex ClickHouse.
Weeding out risk in an uncertain market
According to recent research, climate extreme events like drought, heat waves, and heavy precipitation are responsible for 18-43% of global variation in crop yields for maize, spring wheat, rice, and soybeans. This is a clear trend for other crops as well. Such variation poses risks of food shortages as well as large financial risks to farmers, insurers, and regions dependent on successful crop yields. Also, it creates vast humanitarian difficulties.
Our mission at S4 is to help de-risk crop production by matching the right data with analytics tools so farmers and other participants in the agricultural value chain can plan better, resulting in more reliable food supplies.
In a nutshell, we create indices out of biological assets. These indices measure yield losses on crops that are caused by the effects of weather and other factors, which are then used as underlying assets for products, such as swap/derivative contracts and parametric insurance policies, to transfer risk to the financial markets.
We enable insurers and lenders to buy and sell agricultural risks through the futures market. Also, our other products help farmers and seed and fertilizer companies provide customized genotype recommendations and fertilization requirements. This helps to optimize planting by geography, resources, and crop species, monitor phenological, pests and humidity evolution throughout the crop season, and estimate yields.
Local communities benefit from S4’s technology, as the ability to manage weather risks allows farmers to stabilize their cash flows, invest more to produce more with fewer risks, and develop in a more sustainable manner.
Growing data sources, reducing costs, accelerating performance
With the volume of diverse data sources and analytical complexity both growing at a very fast pace, we decided that using a major cloud services provider with a broad roadmap and global partnerships would be beneficial to S4’s future evolution.
At the same time, we wanted to bring our services to users faster and cut costs by consolidating our on-premises technology stack. When we started evaluating providers, our leading criteria included a powerful geospatial database and data analytics tools along with excellent support, all at a competitive price. GCP prevailed in nearly all criteria categories among the 50 companies we measured.
Our previous platform architecture included a hybrid relational database that used Compute Engine for virtual machines and Cloud Storage for database backup. The RDBMS was slow. Maintaining our own data warehouse was complex and expensive.
We wanted to use machine learning and neural networks, but couldn’t do so easily and affordably. The complexity of that system meant that products or services requiring small changes or additions to the data model translated to expensive expansions of infrastructure or project time.
Also, agronomical or product teams couldn’t test these changes by themselves, always requiring the intervention on no small part of the IT team, which led to further delays.
We added GCP services like BigQuery as S4’s cloud data warehouse and use BigQuery GIS for geospatial analysis, Cloud Dataflow for simplified stream and batch data processing, and Cloud SQL for queries to the S4 database platform, which have all made a huge impact on our services and bottom line.
Database and analytics costs have decreased by 40% and customers are receiving our analytical results 25% faster. In addition, we’ve eliminated the time-consuming downloading of images, reducing storage and processing costs by 80%, because we no longer need expensive tools licenses, and have greatly reduced classification processing times.
Our customers working in the agriculture industry are also benefiting from this infrastructure change. They are now able to speed up their data analytics using our GCP-based platform.
“S4 products and technologies unlock the full potential of satellite imagery for crop prescriptions, monitoring and yield estimates,” says Nicolás Loria, Manager of Marketing Services, Southern Cone, Corteva Agriscience.
“We’ve worked with S4 for the last three (and starting year number four) crop seasons as its team capabilities, data integration capacities, and analytics insights have allowed Corteva to perform an entire new solution. Thanks to S4’s customized 360° approach, fast response and delivery times, we have safely outsourced our remote crop analytic technical needs.”
Also, this new architecture has allowed us to scale our models and databases with almost no limits, at a fraction of the cost vs. the previous models.
We’ve saved a lot of time on executing processes and reduced work needed by our internal teams to do certain tasks, like preparing images, converting them, validating results, and more. Using Google Earth Engine has decreased the execution time of daily tasks anywhere from 50% to 90% of the previous time, going from an average time of 30 minutes to between four and 15 minutes, depending on the task.
In addition to saving money and time, we are able to focus on innovation with the GCP performance and features we’re using. We’re able to seamlessly add satellite data to analytics using both public datasets and our own private data, and deliver GIS data management, analytics, crop classification and monitoring in real time.
We can do semi-automatic crop classification and classification using spectral signatures with Google Earth Engine. Later this year, we’ll be using neural networks for pattern recognition and machine learning in new applications to improve crop yields and fine-tune risk models. And using GCP and Google Earth Engine infrastructure means we can run models for customers in South America and around the world, since Google Earth Engine has global satellite imagery available.
We’ve heard from our customer Indigo Argentina that they’re able to bring customers data insights faster.
“We are working with S4 in the development of two different applications for satellite crop monitoring and yield assessment,” says Carlos Becco, CEO, Indigo Argentina. “S4’s technology allowed us to manage and analyze multiple sources and layers of information in real time, letting us uncover valuable insights in Indigo’s own microbiome technologies, and at a very competitive cost.”
Analytical products and app development thrive with GCP
With GCP, we are updating and improving algorithms that we built manually with machine learning processes to develop drought indices for upcoming crop seasons. Algorithms can recognize specific phases of crop phenology (e.g., bud burst, flowering, fruiting, leaf fall) and correlate them with photosynthetic activity, light, water, temperature, radiation, and plant genetics factors. Other analytical products like crop monitoring, pre-planting recommendations, financial scoring, and yield estimation can now do a lot more for users by offering multiple layers and datasets, faster image processing, and real-time access via APIs.
We also replaced our bare-metal S4 app deployment with the App Engine serverless application platform. It provides tighter integration between the S4 platform and our BigQuery data warehouse for integration with marketplaces and third-party solutions.
We get all of these Google Cloud features with all the benefits of managed cloud services, from multiversioning and security to automatic backups and high availability.
At S4, we trust technology to decode plant growth and help protect farmers and their communities from climate change. With growing food shortages due to increasing populations and intensifying weather, data and analytics can have a huge impact in lowering financial risks and improving agricultural yields. It’s one sector where cloud, database, analytics, and other technologies are combining to improve business outcomes and affect the lives of billions of people. Learn more about S4’s work and learn more about data analytics on Google Cloud.
Google Cloud Helps Northwell Health to Boost Caregiver Productivity and Access to Right Care Using AI

7986
Of your peers have already read this article.
2:00 Minutes
The most insightful time you'll spend today!
Lung cancer is the leading cause of cancer death in the United States and like any cancer, early detection is crucial to survival. Screening at-risk populations is an important part of reducing mortality, and if concerning nodules are found on imaging, further testing may be required. Today, we’ll share how Northwell Health uses Google Cloud products such as Cloud Healthcare APIs and BigQuery to increase caregiver productivity and deliver better care for patients with findings that indicate potential development of lung cancer.
Northwell is New York’s largest healthcare provider
Northwell Health is New York’s largest healthcare provider with 23 hospitals and nearly 800 outpatient facilities. Northwell’s nearly 4,000 doctors care for millions of patients each year, and at this scale, there is an immense amount of healthcare data to manage. To better manage and leverage this data, Northwell Health partnered with Google Cloud starting in 2018.
Enabling caregivers to spend more time with patients
Nic Lorenzen, the lead developer of Northwell Emerging Technology and Innovation team, has a mission to put together data for caregivers in a way that makes sense. It is no secret that inefficient electronic health records systems have a negative impact on a physician’s ability to deliver quality care. Traditional EHRs have information distributed across many tabs, which forces caregivers to spend considerable time at the computer trying to find information. Moreover, speed of care matters. If care is delayed, patients may have to spend more time in the hospital and may suffer worse health outcomes.
To solve this problem, Nic’s team focused on giving caregivers the most relevant pieces of data at the right time by developing an intelligent clinician rounding app. The data needed to derive these insights can depend on the caregiver’s role–a nurse cares about different things than a cardiologist. This system aggregates multiple data sources, and provides patient-specific insights to caregivers.
This system would not have been possible before with traditional EHRs and data warehouses that have proprietary data models and rarely sync data in real time. Now with data easily accessible through Google Cloud’s Healthcare solutions, Nic’s team can deliver the right clinical information to the right people instantly. These days, Nic says, “instead of spending 75% of our time dealing with architecting the underlying platforms, we spend 75% of our time focused on higher value use cases for clinicians and patients. Google Cloud’s Healthcare solutions have greatly improved our developer productivity and time to value.”
Caregivers have found this new system to be a game changer.Before the implementation of this system, caregivers would spend, on average, seven to nine minutes finding the data needed to make medical decisions for one patient. Now, that aggregated information is delivered to a caregiver’s mobile device in less than a second.
Ensuring patients get the right care with the power of AI
There are a number of reasons why patients might not get the care that they need. For example, patients today can go to multiple hospitals and clinics settings, and coordinating care across multiple facilities is complex. Regional hospitals and clinics have their own siloed view of their data, so pertinent information gathered by one clinic might not be seen by another. These gaps in clinical data lead to gaps in patient care.
When a patient gets radiologic imaging, they may have findings unrelated to the reason they initially got the imaging. For example, a chest CT for a car accident might reveal an incidental lung nodule that could be cancerous. Unfortunately, research shows that a large portion of patients do not get follow up for these incidental findings because it isn’t the primary reason why the patient is seeing a doctor. Moreover, social determinants of health are a factor that affects which patients receive follow-up care. Identifying these patients and providing the necessary follow up care prevents adverse events related to delayed detection of cancer.

With Cloud Healthcare solutions, Northwell built an AI model to identify these patients so that oncologists can appropriately follow up with patients who have findings suspicious for lung cancer. The AI model detects incidental pulmonary nodules in radiology reports so that doctors can then contact the patients that need follow-up care. Nic says his team was able to build this system in a week: “Google Cloud did a lot of heavy-lifting for us and allowed us to get to the AI applications much faster. It allowed us to build a platform that just works.”
Healthcare systems can now rapidly generate healthcare insights with one end-to-end solution, Google Cloud Healthcare Data Engine. It builds on and extends the core capabilities of the Google Cloud Healthcare API to make healthcare data more immediately useful by enabling an interoperable, longitudinal record of patient data. Northwell Health uses Google Cloud as the core of their platform, enabling their developers to create solutions to the most pressing healthcare problems.
Special thanks to Kalyan Pamarthy, Product Management Lead on Cloud Healthcare and Natural Language APIs for contributing to this blog post.
More Relevant Stories for Your Company

IT Team Figures Out Easiest Way to Build Data Pipelines and Create ML Models
Building a strong brand in today's hyper-competitive business environment takes vision. It also requires a flexible, easily managed approach to digital asset management (DAM), so marketing professionals and other stakeholders can easily share, store, track, and manipulate assets to build the brand. Many of today's leading companies, including JetBlue, Slack,

Indian Retailer Figures Optimizes Hyperlocal Delivery to Increase Customer Experience
Anyone who follows the Indian e-commerce scene knows that one of the largest challenges these companies face is hyperlocal delivery. That was a problem facing Wellness Forever, a retail chain of pharmacies with 150-plus stores across India. “Exactly a year ago, we started our journey of hyperlocal deliveries. This optimization

Build Open Data Platform on GCP with Delta Lake, Presto and Dataproc
Organizations today build data lakes to process, manage and store large amounts of data that originate from different sources both on-premise and on cloud. As part of their data lake strategy, organizations want to leverage some of the leading OSS frameworks such as Apache Spark for data processing, Presto as a query engine and


Scaling Data-Driven Insights Across a Complex Global Organization with Looker and BigQuery
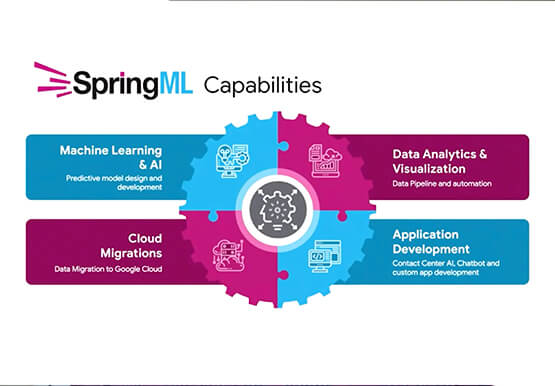
In this video, SpringML and Iron Mountain share how migrating data to Google Cloud not only saved hundreds of thousands of dollars in licensing consolidation but allows stakeholders across a complex global organization to: Consolidate 1,200 data management applications into one data lakeUnify information governance practices across disparate corporate verticals
