





Moving Your Data Warehouse to the Cloud? Here’s What You Need to Know
READ FULL INTRODOWNLOAD AGAIN5501
Of your peers have already downloaded this article
10:30 Minutes
The most insightful time you'll spend today!
Candidate360: Google Cloud and Deloitte Product Improves Universities’ Enrollment and Admission Processes

4822
Of your peers have already read this article.
2:00 Minutes
The most insightful time you'll spend today!
Given the May 1 deadline for students to enroll, colleges and universities have been carefully watching the numbers of students who put down deposits and commit to a school. Like nearly every other sector in the U.S., colleges and universities have been hit hard by the pandemic and economic downturn, making enrollment numbers more important than ever to maintain financial health and meet student body goals. Technology and AI-based models are providing a way for institutions to manage their admissions data efficiently and cost-effectively.
For example, an admissions officer may want to offset drops in international or out-of-state enrollment by attracting local talent so they can achieve their target class profile. Additionally, institutions have sought to increase the availability and access of higher ed and are intentionally recruiting more low-income and underrepresented populations. New technologies allow admissions officers to have a stronger grasp of the incoming class’ details. With the press of a button, users can switch between overall, in-state, out-of-state, and international enrollment figures. The “How Do Regions Compare to Last Year” tile lets users view the percentage of change and the total number of candidates by region, comparing 2020 and 2021 side-by-side. With access to data, regional recruiters can focus on individual candidates and develop a plan to change the numbers.
An innovative enrollment strategy at MSU
Michigan State University was looking to improve how they managed the recruiting process. They implemented an enrollment strategy that saw their out-of-state enrollment increase by over 20% and generate $5M in additional net tuition revenue in a single year. “We knew we needed better real-time and predictive insights about our enrollment pipeline, and we understood the value of bringing in external data on prospects, but we couldn’t do that by ourselves.
The solution really helped us be innovative with our analytics and improve our enrollment outcomes,” said someone close to the project at Michigan State University.
Data-driven insights support informed enrollment decisions
Student admissions and marketing groups are turning to Google Cloud and Deloitte to help support their enrollment decisions with predictive, actionable insights across recruiting and admissions processes. The partnership resulted in Candidate360, a solution that helps institutions process and analyze large amounts of data and develop meaningful insights to support their enrollment goals and mission. Part of Google’s Student Success Services offerings, Candidate360 uses artificial intelligence and predictive analytics to help higher education institutions improve enrollment and matriculation, as well as optimize financial aid decisions.
With nine AI/ML models, Candidate360’s capabilities help university leaders, enrollment teams and recruiters do things like:
- Identify regions with clusters of candidates or see dips in application numbers
- Deploy marketing resources and admissions staff to the right geographic areas
- Understand applicants’ needs in terms of academics, safety, and social activities
- Make intelligent financial aid decisions to recruit and retain talented students from underrepresented communities
- Respond faster to the students who are most likely to be accepted and then go on to enroll, stay enrolled, and graduate
- Work towards the ideal class composition and increase competitiveness with peer institutions
Enhancing the student experience
Enrollment is the first key touchpoint with incoming students, and tools like Candidate360 can help institutions build a student preferences profile throughout the application process. They can understand each student’s prospective major, areas of interest, dream job, and more, allowing colleges and universities to personalize recommendations and advising for enrolled students.
With integrated toolsets, Candidate360 and Google Cloud’s Student Success Services can help colleges and universities emerge from the pandemic stronger than ever.
To see a demonstration of Candidate360 in action, contact our sales team.
3810
Of your peers have already watched this video.
8:00 Minutes
The most insightful time you'll spend today!
Target Leverages Google Cloud to Create Market-defining Online Experience
In the hyper-competitive world of online retail sales, ease-of-use and transaction speed can make or break business outcomes. However, a few years ago US Retail giant Target was going through a period of uncertainty.
While the company had over 1800 stores across the US with an estimated 85% of US consumers shopping at a Target store and over 25 million people visiting the Target website or using its app each month, it was still losing ground.
In spite of having millions of loyal customers, the company was dangerously late on digital and its technology wasn’t keeping pace with unstable systems to boot. The company faced the twin challenges of trying to operate today’s business as efficiently as possible and creating tomorrow’s business as quickly as possible. On the one hand it needed productivity and stability and on the other it wanted speed and disruption. Not an easy task to accomplish.
That’s when Target decided to use Google Cloud to solve its challenges. See how Target leveraged Google Cloud to create a market-defining online experience that has made customers happier and more loyal.
NCR’s Emerald Leverages Google Cloud to Help Grocers Boost Operational Agility

8270
Of your peers have already read this article.
3:00 Minutes
The most insightful time you'll spend today!
In recent years, the grocery industry has had to shift to facilitate a wider variety of checkout journeys for customers. This has meant ensuring a richer transaction mix, including mobile shopping, online shopping, in-store checkout, cashierless checkout or any combination thereof like buy online, pickup in store (BOPIS).
What’s more, in the past year and a half alone grocers have had to enable consumers new ways to shop for essentials. This has included needing to rapidly integrate or build on-demand delivery apps, offer curbside pickup with near-instant fulfillment as well as support touchless and cashless checkout experiences. Searches on Google Maps for retailers in the US with curbside pickup options have increased by 9000% since March 2020, and we believe these trends from 2020 will continue to define the future of grocery shopping.
The future of grocery will require agility and openness
Firstly, the need to rapidly adapt to changing consumer habits will be the new normal. Grocers will increasingly look to digitally transform legacy retail systems and modernize point of sale (POS) platforms to deliver and scale omnichannel experiences as quickly as possible. This necessitates a more agile and open architectural approach to technology – one built on microservices and leverages APIs so that new applications and experiences can be built, integrated and delivered faster.
Automation and data-driven retailing will be table stakes
In order for retailers to blend what they’re offering in the store with digital experiences more efficiently, they will also need to automate more. For example, with automation and business intelligence, grocers can take labor that might have been tied up with tender operations and checkout and redistribute those resources to restocking shelves, curbside pick-up or improving customer experiences.
Automation and access to real-time in-store inventory & supply chain data can also help grocers avoid the supply chain challenges seen in the early days of COVID-19. Grocers will need to find ways to leverage automation to ingest, organize, and analyze data from physical store networks, digital channels, distribution centers to better forecast demand and manage future fluctuations.
How NCR and Google Cloud are helping grocers adapt to disruption with operational agility
Helping grocers improve operational agility to address changing consumer shopping habits and to thrive during times of disruption is something that NCR and Google Cloud have teamed up to do. NCR has over 135 years of experience in retail, having invented the cash register and are continuing to help grocers innovate. NCR Emerald builds upon the company’s leadership in POS software and has turned it into a unified platform that helps grocers operate the entire store from front to back. The solution supports cashier-led checkout, self-checkout, integrated payments, merchandising, and enables regional managers and corporate employees access to the analytics and tools needed to optimize loyalty programs and promotions.

NCR has invested in a comprehensive, agile, and API-led retail architecture that lets grocers continually innovate and design new experiences as customers and the industry evolve. By running Emerald on Google Cloud, NCR can offer the solution on a subscription basis, helping grocers lower upfront capital expenditures and ensuring scalability. What’s more, NCR can tap into Google Cloud’s strength in data, analytics, and openness to deliver three key imperatives. Let’s take a look at each of these below.
Run the way grocers need to while leveraging Google Cloud as a single source of logic
Traditionally the POS system lived in the store. If disaster strikes, people still need access to food and essentials so the grocery store still needs to operate. It hardly gets more mission-critical than that. NCR Emerald is built on microservices, leveraging Kubernetes for front-of-house compute, and VMs (See graphic 1 below). This makes it easy to support lightweight clients accessible by store employees via any range of mobile devices, computer terminals, self-service kiosks, peripheral devices like receipt printers as well as legacy applications.
What’s unique is that because Emerald runs on Google Cloud, it supports all those in-store and digital touchpoints mentioned above, but also allows grocers to run lean. Emerald leverages Google Cloud as a single source of truth and operates a lot of what it does out of logic. Every sales transaction coming from every channel, including e-commerce, can be logged via NCR’s Hosted Service and centralized in BigQuery and Bigtable as a transaction data master. This enables the grocer to manage any transactional use case very consistently, whether it e supporting customers who want to purchase in one store and return in another, offering digital receipts or the ability to exchange online purchases in store. Emerald on Google Cloud can help retailers extend capabilities through the power of the cloud but not need to live exclusively in the cloud. In other words, the solution allows grocers the ability to run the way they need to.

Enable data-driven and real-time decision making for grocers
Store managers, regional managers, category managers, and others all require different cuts of the data to do their jobs effectively. However, data silos persist and how data is formatted and arranged can still remain pretty static. Therefore allowing users with different roles the ability to view and analyze that data quickly and in different ways continues to be a challenge.
As mentioned above, Emerald leverages Google Cloud data management solutions as the central repository for transactional, behavioral, and merchandising data. Every transaction from every store and every channel can be stored via NCR Hosted Service on BigQuery and Bigtable. NCR Analytics then harnesses the advanced analytical and data visualization capabilities of Looker to help grocers get a consolidated view of their business across all channels and then allow employees to slice and dice the data they way they need to. NCR Analytics also leverages the power of Google Cloud AI and machine learning to add another level of intelligence to the retailer’s data. For example, store managers can visualize how well they’re using their real estate and see how productive lanes 1-3 are compared with 7-10 or compare self-service versus manned lanes. By mapping to the retailer’s own catalog, they can also break down category-level performance and trends.

NCR Analytics takes advantage of Google Cloud’s data pipeline to reduce processing time, with scaling and resource management provided out of the box. By letting the cloud store and process the data, NCR is providing the ability for retailers to analyze their data in near real-time across all platforms – a real game changer in the grocery business.
Open APIs let grocers continually enrich the retail experience
Finally, Emerald is built on an API-first architecture managed through Apigee. It uses the power of Apigee as an open API platform to expose how Emerald can work with other NCR applications like loyalty and promotions, and third party applications like mobile ordering and order delivery to enrich the grocery experience for employees and customers. Every API that Emerald uses is available on Apigee, allowing them to share code samples and giving developers the ability to run scripts. This approach can allow retailers the ability to innovate in a fraction of the time and cost, speeding up 3rd party integrations up front and as businesses grow.
Take, for example, Northgate Market, a chain of 40 stores in California, that were able to transform its digital operations and enable experiences that set it apart from competitors – quickly and simply with Emerald. It took less than 6 months to go from contract to live deployment in the first store. Since then, Northgate Market has been able to extend their intelligence by leveraging the power of Looker and NCR Analytics.
Learn more about how NCR has been able to leverage an open, cloud-enabled architecture to help customers innovate across the retail, hospitality, and banking industries on the webinar “Role of APIs in Digital Transformation”. You can also learn more about how Northgate uses e-commerce to transform customer experience and gain consumer insights.
How to Enhance Incremental Pipeline Performance while Ingesting Data into BigQuery

6342
Of your peers have already read this article.
3:00 Minutes
The most insightful time you'll spend today!
When you build a data warehouse, the important question is how to ingest data from the source system to the data warehouse. If the table is small you can fully reload a table on a regular basis, however, if the table is large a common technique is to perform incremental table updates. This post demonstrates how you can enhance incremental pipeline performance when you ingest data into BigQuery.
Setting up a standard incremental data ingestion pipeline
We will use the below example to illustrate a common ingestion pipeline that incrementally updates a data warehouse table. Let’s say that you ingest data into BigQuery from a large and frequently updated table in the source system, and you have Staging and Reporting areas (datasets) in BigQuery.

The Reporting area in BigQuery stores the most recent, full data that has been ingested from the source system tables. Usually you create the base table as a full snapshot of the source system table. In our running example, we use BigQuery public data as the source system and create reporting.base_table as shown below. In our example each row is identified by a unique key which consists of two columns: block_hash and log_index.
CREATE TABLE reporting.base_table --156 GB processedPARTITION BY TIMESTAMP_TRUNC(block_timestamp, DAY) ASSELECT log_index, data, topics, block_timestamp, block_hashFROM bigquery-public-data.crypto_ethereum.logsWHERE block_timestamp BETWEEN TIMESTAMP '2020-01-01' AND TIMESTAMP '2020-11-30';
In data warehouses it is common to partition a large base table by a datetime column that has a business meaning. For example, it may be a transaction timestamp, or datetime when some business event happened, etc. The idea is that data analysts who use the data warehouse usually need to analyze only some range of dates and rarely need the full data. In our example, we partition the base table by block_timestamp which comes from the source system.
After ingesting the initial snapshot you need to capture changes that happen in the source system table and update the reporting base table accordingly. This is when the Staging area comes into the picture. The staging table will contain captured data changes that you will merge into the base table. Let’s say that in our source system on a regular basis we have a set of new rows and also some updated records. In our example we mock the staging data as follows: first, we create new data, than we mock the updated records:
CREATE TABLE staging.load_delta AS --5 GB processedSELECT log_index, data, topics, block_timestamp, block_hashFROM bigquery-public-data.crypto_ethereum.logsWHERE block_timestamp BETWEEN TIMESTAMP '2020-12-01' AND TIMESTAMP '2020-12-07';INSERT INTO staging.load_delta --2 GB processedSELECT log_index, CONCAT(data, RAND()), topics, block_timestamp, block_hashFROM bigquery-public-data.crypto_ethereum.logs TABLESAMPLE SYSTEM (5 PERCENT)WHERE block_timestamp BETWEEN TIMESTAMP '2020-10-01' AND TIMESTAMP '2020-11-30';
Next, the pipeline merges the staging data into the base table. It joins two tables by unique key and than updates the changed value or inserts a new row
MERGE INTO reporting.base_table T --161 GB processedUSING staging.load_delta SON T.block_hash = S.block_hashAND T.log_index = S.log_indexWHEN MATCHED THEN UPDATE SETT.data = S.dataWHEN NOT MATCHED THEN INSERT (log_index, data, topics, block_timestamp, block_hash)VALUES (log_index, data, topics, block_timestamp, block_hash);
It is often the case that the staging table contains keys from various partitions but the number of those partitions are relatively small. It holds, for instance, because in the source system the recently added data may get changed due to some initial errors or ongoing processes but older records are rarely updated. However, when the above MERGE gets executed, BigQuery scans all partitions in the base table and processes 161 GB of data. You might add additional join condition on block_timestamp:
MERGE INTO reporting.base_table T --161 GB processedUSING staging.load_delta SON T.block_hash = S.block_hashAND T.log_index = S.log_indexAND T.block_timestamp = S.block_timestampWHEN MATCHED THEN UPDATE SETT.data = S.dataWHEN NOT MATCHED THEN INSERT (log_index, data, topics, block_timestamp, block_hash)VALUES (log_index, data, topics, block_timestamp, block_hash);
But BigQuery would still scan all partitions in the base table because condition T.block_timestamp = S.block_timestamp is a dynamic predicate and BigQuery doesn’t automatically push such predicates down from one table to another in MERGE.
Can you improve the MERGE efficiency by making it scan less data? The answer is Yes.
As described in the MERGE documentation, pruning conditions may be located in a subquery filter, a merge_condition filter, or a search_condition filter. In this post we show how you can leverage the first two. The main idea is to turn a dynamic predicate into a static predicate.
Steps to enhance your ingestion pipeline
The initial step is to compute the range of partitions that will be updated during the MERGE and store it in a variable. As was mentioned above, in data ingestion pipelines, staging tables are usually small so the cost of the computation is relatively low.
DECLARE src_range STRUCT<date_min TIMESTAMP, date_max TIMESTAMP> --115 MB processedDEFAULT(SELECT STRUCT(MIN(block_timestamp) AS date_min,MAX(block_timestamp) AS date_max) FROM staging.load_delta);
Based on your existing ETL/ELT pipeline, you can add the above code as-is to your pipeline or you can compute date_min, data_max as part of some already existing transformation step. Alternatively, date_min, data_max can be computed on the Source System side while capturing the next ingestion data batch.
After computing date_min, date_max you pass those values to the MERGE statement as static predicates. There are several ways to enhance the MERGE and prune partitions in the base table based on precomputed date_min, data_max.
If your initial MERGE statement uses a subquery, you can incorporate a new filter into it:
BEGINDECLARE src_range STRUCT<date_min TIMESTAMP, date_max TIMESTAMP> --115 MB processedDEFAULT(SELECT STRUCT(MIN(block_timestamp) AS date_min,MAX(block_timestamp) AS date_max) FROM staging.load_delta);MERGE INTO reporting.base_table T --41 GB processedUSING (SELECT *FROM staging.load_deltaWHERE block_timestamp BETWEEN src_range.date_min AND src_range.date_max) SON T.block_hash = S.block_hashAND T.log_index = S.log_indexAND T.block_timestamp = S.block_timestampWHEN MATCHED THEN UPDATE SETT.data = S.dataWHEN NOT MATCHED THEN INSERT (log_index, data, topics, block_timestamp, block_hash)VALUES (log_index, data, topics, block_timestamp, block_hash);END;
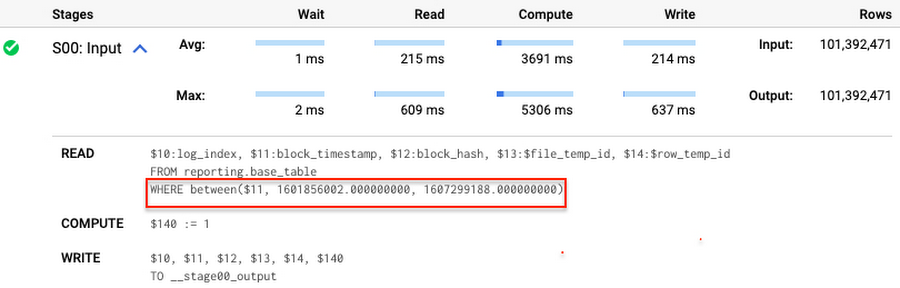
Note that you add the static filter to the staging table and keep T.block_timestamp = S.block_timestamp to convey to BigQuery that it can push that filter to the base table. This MERGE processes 41 GB of data in contrast to the initial 161 GB. You can see in the query plan that BigQuery pushes the partition filter from the staging table to the base table:
This type of optimization, when a pruning condition is pushed from a subquery to a large partitioned or clustered table, is not unique for MERGE. It also works for other types of queries. For instance:
SELECT * -- 41 GB processedFROM reporting.base_table TINNER JOIN staging.load_delta SON T.block_hash = S.block_hashAND T.log_index = S.log_indexAND T.block_timestamp = S.block_timestampWHERE S.block_timestamp BETWEEN TIMESTAMP '2020-10-05' AND TIMESTAMP '2020-12-07'
And you can check the query plan to verify that BigQuery pushed down the partition filter from one table to another.
Moreover, for SELECT statements, BigQuery can automatically infer a filter predicate on a join column and push it down from one table to another if your query meets the following criteria:
- The target table must be clustered or partitioned.
- The result size of the other table, i.e. after applying all filters, must qualify for broadcast join. Namly, the result set must be relatively small, less than ~100MB.
In our running example, reporting.base_table is partitioned by block_timestamp. If you define a selective filter on staging.load_delta and join two tables, you can see an inferred filter on the join key pushed to the target table
SELECT *FROM reporting.base_table TINNER JOIN staging.load_delta SON T.block_timestamp = S.block_timestampWHERE S.block_hash = '0x0c1caa16b34d94843aabfebc0d5a961db358135988f7498a6fdc450ad55f0870'
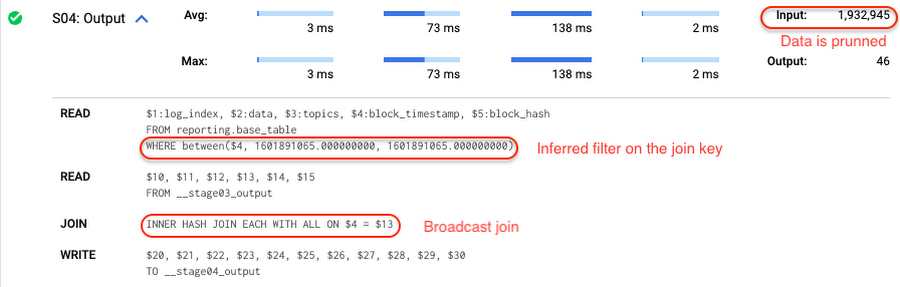
There is no requirement to join tables by partitioning or clustering key to kick off this type of optimization. However, in this case the pruning effect on the target table would be less significant.
But let us get back to the pipeline optimizations. Another way to enhance MERGE is to modify the merge_condition filter by adding static predicate on the base table:
BEGINDECLARE src_range STRUCT<date_min TIMESTAMP, date_max TIMESTAMP> --115 MB processedDEFAULT(SELECT STRUCT(MIN(block_timestamp) AS date_min,MAX(block_timestamp) AS date_max) FROM staging.load_delta);MERGE INTO reporting.base_table T --41 GB processedUSING staging.load_delta SON T.block_hash = S.block_hashAND T.log_index = S.log_indexAND T.block_timestamp BETWEEN src_range.date_min AND src_range.date_maxWHEN MATCHED THEN UPDATE SETT.data = S.dataWHEN NOT MATCHED THEN INSERT (log_index, data, topics, block_timestamp, block_hash)VALUES (log_index, data, topics, block_timestamp, block_hash);END;
To summarize, here are the steps that you can perform to enhance incremental ingestion pipelines in BigQuery. First you compute the range of updated partitions based on the small staging table. Next, you tweak the MERGE statement a bit to let BigQuery know to prune data in the base table.
All the enhanced MERGE statements scanned 41 GB of data, and setting up the src_range variable took 115 MB. Compare it with the initial 161 GB scan. Moreover, given that computing src_range may be incorporated into some existing transformation in your ETL/ELT, it results in a good performance improvement which you can leverage in your pipelines.
In this post we described how to enhance data ingestion pipelines by turning dynamic filter predicates into static predicates and letting BiQuery prune data for us. You can find more tips on BigQuery DML tuning here.
Special thanks to Daniel De Leo, who helped with examples and provided valuable feedback on this content.
How One Company Uses AI and Data Analysis to Boost Revenue

9484
Of your peers have already read this article.
4:30 Minutes
The most insightful time you'll spend today!
AI, deep learning, and image recognition is transforming the shopping experience. These technologies enable consumers to use product images or screenshots rather than text to search for similar products. This improves the customer experience and enables retailers with online and offline outlets to provide a genuine omnichannel experience.
The lack of complexity and the ease of use of BigQuery has enabled ViSenze to reduce its data infrastructure and management costs by 30%–50%, and scale up without incurring downtime.
—Renjie Yao, Data Platform Lead, ViSenze
Visual commerce provider ViSenze is helping some of the world’s leading retailers improve conversion rates through image-based search.
The business’s products also enable media companies to use the platform to turn images and videos into engagement opportunities—driving new and incremental revenues.
Created through NExT—a research center established by the National University of Singapore and Tsinghua University of China—ViSenze now operates in the United States, United Kingdom, India, China, and Singapore. The business is backed by Japan-based internet and ecommerce company Rakuten and cross-border investment specialist WI Harper Group.
Growth in SMB and Mobiles
Renjie Yao, Data Platform Lead at ViSenze, sees opportunities for growth in the small-to-medium business sector, where companies do not have the resources to build similar technologies, and with mobile device OEMs to integrate ViSenze natively on smartphones.
Phone owners can activate a “shopping lens” on camera and gallery apps to capture an image of a product. They then receive matching results from more than 800 partner merchants and retailers and can then click through to product pages on partner apps or mobile websites. Alternatively, they may use a photo to compare products sold on different sites or shop matching styles.
“Our research found Google Cloud provided a complete, integrated ecosystem rather than a disparate collection of tools and components, and so was ideal for our needs.”
—Renjie Yao, Data Platform Lead, ViSenze
The ViSenze API analyzes the contents of a selected or clicked image and sends the information back to the organization’s visual commerce platform. The platform feeds back similar results based on that information.
The ViSenze offering also extends to image analysis for the tagging of product attributes—such as a white turtleneck cardigan with full sleeves—to provide an improved search experience.
Data Vital to ViSenze
Capturing and analyzing large volumes of data is integral to ViSenze. “We have to understand how consumers interact with our customers’ ecommerce websites and apps,” says Yao. “For example, we need to know who has looked at a particular pair of jeans on a website and whether that visit led to a conversion. We can then tell that customer whether they need to make more stock available.”
ViSenze also relies on data to provide high-quality training for its image recognition models and its domain-specific models for online retail.
Protect Customer Data
Data is vital to ViSenze—but customer privacy is most important. “All the data we collect is transparent to our customers, meaning they can decide what they do not want us to collect. In addition, all personal data processing complies with privacy protection regulations in each region, such as the General Data Protection Regulation in Europe.”
A Quick Move to the Cloud
ViSenze started operations using servers, storage, networking, and associated systems in an on-premises data center operated by NExT.
However, to support rapid growth, the business decided to move its workloads to the cloud. ViSenze opted for a multi-cloud architecture, using in part a Google Cloud data infrastructure.
“Our research found Google Cloud provided a complete, integrated ecosystem rather than a disparate collection of tools and components, and so was ideal for our needs,” says Yao. “We could connect different components with the click of a mouse.” Further, the business found it could easily configure rules and pipelines to route data logs to relevant Google Cloud services.
The review found Google Cloud’s extensive managed services would also remove administration and maintenance tasks from ViSenze’s in-house technology team—freeing team members to focus on more valuable tasks.
In addition, Google Cloud provided the security features—including custom hardware running hardened operating systems and file systems and encryption of data at rest and in transit—needed to protect sensitive information. Finally, the location of Google Cloud regions in several countries would enable the business to meet regulatory and data sovereignty requirements.
A Three-Month Implementation
ViSenze opted to move to Google Cloud in mid-2017 and completed a three-month implementation using internal resources. “The process was very smooth and intuitive, and we had no problems building our entire data platform within Google Cloud,” says Yao.
The business now uses an architecture comprising Google Kubernetes Engine to manage and orchestrate Docker containers running in Google Cloud Platform; BigQuery to provide an analytics data warehouse, with Google Data Studio providing customizable visualization and reports; Stackdriver to monitor and manage virtual machine instances and services inside Google Cloud; Cloud SQL to manage its relational databases for real-time analytics; Compute Engine to provide compute resources; Cloud Storage to store files and objects; Cloud Pub/Sub to provide real-time messaging between applications; and Cloud Functions to build event-driven applications.
After collecting the request logs of users in virtual machine instances and Docker containers, ViSenze distributes them in three directions. “We export raw logs into Cloud Pub/Sub for indexing inside an Elasticsearch search engine, and to a BigQuery data warehouse for further analytics,” explains Yao. “We also use Cloud Functions-created applications to obtain the logs from Cloud Pub/Sub to perform some real-time calculations.”
“We are currently using Airflow workflow management on Compute Engine as our hosted ETL platform, but are likely to move to Cloud Composer in future.”
500 Million Records Per Day
With Google Cloud providing its data infrastructure, ViSenze is well positioned to meet internal and customer demands for more granular insights. The business is now processing 500 million records per day through BigQuery and saves up to one year’s aggregated data—excluding any personal data—in the data warehouse for analysis.
The nature of ViSenze’s business means most reports are generated for data processed on an hourly, daily, or monthly basis. “BigQuery is extremely stable and performance optimized, regardless of the volume of data it processes,” says Yao. “Across BigQuery and other Google Cloud Platform services, we’ve recorded 99.99% availability over the past year.”
The lack of complexity and the ease of use of BigQuery has enabled ViSenze to reduce its data infrastructure and management costs by 30%–50%, and scale up without incurring downtime.
“With BigQuery, we have saved the equivalent of two full-time engineers and now need only half of one person’s time to maintain our whole data platform,” says Yao.
“In addition, BigQuery integrates closely with Data Studio, enabling non-technical people in our product and business teams to create dynamic, detailed analysis dashboards. We now use Data Studio to create nearly 50 separate reports.”
The business has now grown to offer access to more than 1 billion users and a listing of more than 400 million purchasable products.
Next Steps
ViSenze is now researching the potential of the Cloud AutoML suite of machine learning products to improve the training of its models and run a fully managed NoSQL database through Cloud Datastore.
“A NoSQL database service is the only missing piece of our architecture for now, and using Cloud Datastore would enable us to focus almost exclusively on our business,” says Yao. “With Google Cloud Platform, we are ideally positioned to continue providing support to our business team and help them continue expanding into new markets.
“In addition, we can help retailers and consumers to unlock the potential of the web and apps to transform the purchasing experience.”
More Relevant Stories for Your Company

How the City of Memphis Uses Technology to Identify 75 Percent More Potholes
At 340 square miles, the City of Memphis is among the largest in the United States in terms of land area. Memphis has over 6,800 lane-miles of city streets, enough to drive back and forth to Los Angeles four times. Keeping these streets well maintained and safe for citizens and visitors is
Google and AI Researchers Work towards Building Data-centric AI
AI researchers and engineers need better data to enable better AI solutions. The quality of an AI solution is determined by both the learning algorithm (such as a deep-neural network model) and the datasets used to train and evaluate that algorithm. Historically, AI research has focused much more on algorithms

Largest Beauty Retailer in the US Powers Digital Transformation with Google Cloud Smart Analytics
Digital technology offers increasing flexibility and choice to consumers. As a result, the retail industry is dramatically shifting toward more tailored and personalized experiences for shoppers, and businesses are rethinking how they deliver value to customers. This couldn’t be more true for the beauty retailing industry where leading companies are




The New and Upcoming Infrastructure for Google Cloud’s AI and ML Solutions
How does Google manage to provide its customers a differentiated compute platform experience and define ways to fully leverage its infrastructure supporting its cutting-edge AI and ML offerings? Easy-to-use, scalable and ability to create innovative products and services to end-users at low cost of ownership is the narrative behind Google
