





Bitly’s Big Move: A Story of Massive Data Migration to Google’s Cloud Bigtable

958
Of your peers have already read this article.
3:30 Minutes
The most insightful time you'll spend today!
Editor’s note: Bitly, the link & QR Code management platform, migrated 80 billion rows of link data to Cloud Bigtable. Here’s how and why they moved this data from a MySQL database, all in just six days.
Our goal at Bitly is simple: Make your life easier with connections. Whether you’re sharing links online, connecting the physical and digital worlds with custom QR Codes or creating a killer Link-in-bio, we’re here to help make that happen.
Bitly customers run the gamut from your local middle school to most of the Fortune 500 with every use case you can think of in play. On a typical day, we process approximately 360 million link clicks and QR Code scans and support the creation of 6-7 million links or QR Codes for more than 350,000 unique users.
At the heart of our platform is link data consisting of three major datasets for the approximately 40 billion active links in our system (and counting). For years we stored this data in a self-managed, manually sharded MySQL database. While that setup served us well over time, it did present some challenges as we looked to expand and move into the future.
MySQL: Challenges and growing pains
First, performing operational actions like software and security upgrades or database host provisioning — all while keeping the databases 100% available for our customers — was challenging to say the least.
Additionally, the backup and restore process was both costly and time-consuming. Daily backups for the growing dataset took almost an entire day to complete. And if we ever had to restore the entire data set, it would have undoubtedly taken at least two people working for several days — not a fun prospect and thankfully something we never had to do.
While manual sharding for MySQL offers good key distribution across physical and logical shards, it’s pretty high-maintenance — we tried to avoid touching our sharding config because of how error-prone making changes was. And even with a forward-thinking shard allocation, we found this approach to have a limited lifespan.
And finally, when we turned our attention towards multi-region and global distribution, manually sharded MySQL proved to be a major hurdle, especially compared to the convenience of a managed service that handles geo-distribution for us.
As we thought about the future of our data and how to best meet our expansion goals, we determined that an update was necessary. We needed a system more set up for growth and increased reliability, preferably one with built-in functionality for replication and scaling. Investigation and research brought us to Cloud Bigtable, Google Cloud’s enterprise-grade NoSQL database service.
The Bitly link, in a nutshell
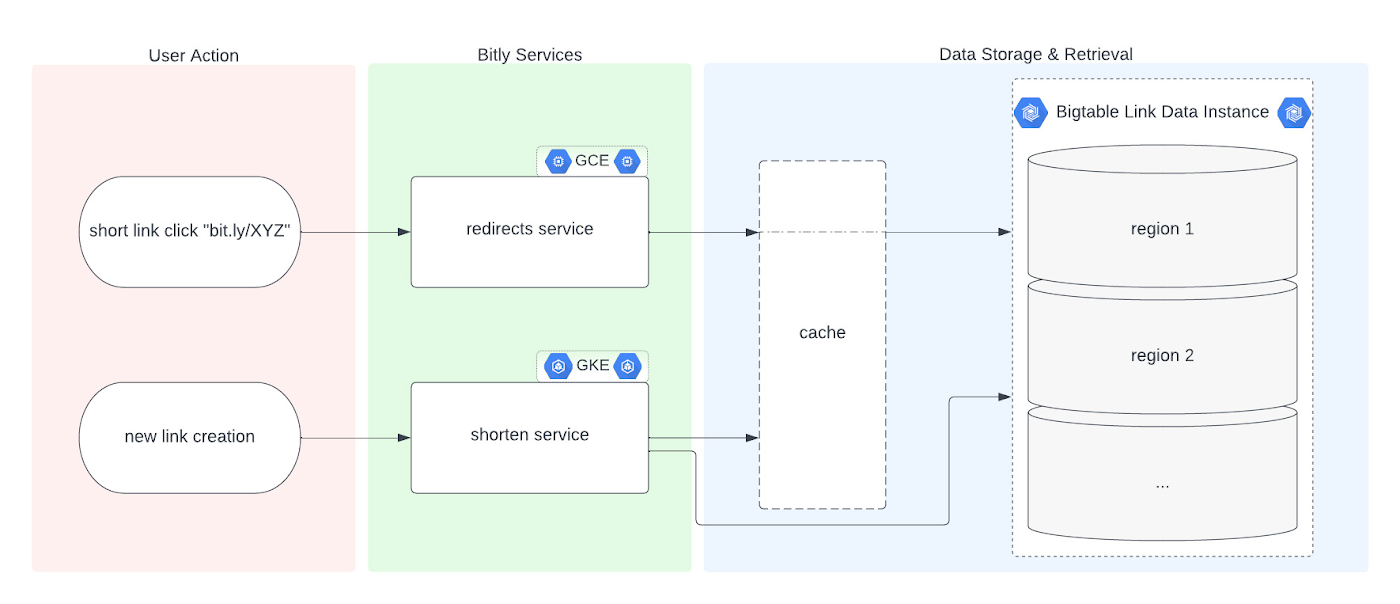
Before we dive into the Bigtable migration, it’s useful to understand the basics of our link management system. When a user shortens a long URL with Bitly, information is saved to the backend data stores through our API layer. This information consists of a Bitly short link and the corresponding destination link for proper routing, as well as some additional metadata. When a user clicks the Bitly short link, our services query these same backend data stores for the redirect destination for the request. This basic flow, which also includes other Bitly link options like custom back-halves, is the backbone of the Bitly link management platform.
Where Bigtable comes in
As mentioned, after researching our options, the solution that best fit our needs was Bigtable. It offered the features we were looking for, including:
- A 99.999% SLA
- Limitless scale
- Single-digit millisecond latency
- A built-in monitoring system
- Multi-region replication
- Geo-distribution, which allows for seamless replication of data across regions and reduces latency
- On-demand scaling of compute resources and storage, which adjusts to user traffic and allows our system to grow and scale as needed
- Seamless integration with our general architecture; we use Google Cloud services for many other parts of our system, including the APIs that interact with these databases
- A NoSQL database that doesn’t require relational semantics, as the datasets we’re migrating are indexed on a single primary key in our applications
Making the move
We targeted three of our major, self-managed datasets to migrate. The larger two were organized in a sharded database architecture. The first thing we did for migration was prepare the new Bigtable database. We iterated over a schema design process and conducted a thorough performance analysis of Bigtable to ensure an uninterrupted user experience during and after the migration. After that, we made minor adjustments to our application code so that it could seamlessly integrate and interact with Bigtable. Finally, we implemented a robust post-migration disaster recovery process to mitigate any potential risks.
During the actual migration, we enabled our applications to start a “dual writes” phase. This involved concurrently writing new link data to both our existing MySQL and the new Bigtable tables. Once data started writing to our Bigtable instance, we ran our migration scripts. We used a Go script to walk each of the existing MySQL datasets and insert each row into Bigtable. This enabled us to clean up outdated information and backfill older records with newer field data.
Cleaning up clutter along the way
In the process of migration, we were actually able to free up a huge amount of storage. Because of the elimination of an early feature of the Bitly platform, we were able to exclude from the migration to Bigtable a little less than half of the total data stored in MySQL. Since we were creating a completely clean dataset, we had the opportunity simply to skip those unneeded rows during the migration.
Altogether, the migration process walked through 80 billion MySQL rows, which resulted in just over 40 billion records finding their new home in Bigtable. In the end, our starting point with Bigtable is a 26 TB dataset, not including replication. A set of concurrent Go scripts running in parallel on a handful of machines allowed us to complete this migration project in six days. (Go rarely disappoints.)
Write twice, cut once – validation before migration
Next up was the data validation and cutover period when we started returning data from Bigtable, but continued to write to MySQL as a precaution in case we needed to roll back at any point.
As we dove into the validation process, we compared the data between MySQL and Bigtable and noted any discrepancies whenever a link was clicked or created. After verifying that all our responses were stable, we proceeded with a gradual cutover process, rolling out in percentages until we reached 100% Bigtable for all writes and reads. After a comfortable run period, we’ll turn off the dual writes completely and finally decommission our workhorse MySQL hosts to live on a farm upstate.
Google’s got Bitly’s back(ups)
Our data is our lifeline, and we’re doing everything we can to ensure it’s always protected. We put together a redundancy plan using both Bigtable backups as well as a process for keeping a copy of the data outside Bigtable for true disaster recovery.
The first line of defense involves a switchover to the backup Bigtable dataset in case we need it. Beyond that, we’ve implemented two more layers of defense to protect against instance failure, corrupted data, and any other data failure that would require a restore of one or more tables from backup.
For this process, we start by creating daily Bigtable backups of our tables that we store for a fixed number of days. Second, we execute a Dataflow job to export our data from Bigtable into Cloud Storage approximately every week. And, if the need arises, we can use Dataflow to import our data back from Cloud Storage into a new Bigtable table.
While running the Dataflow jobs to export from Bigtable to Cloud Storage, we’ve seen an impressive export speed of 7-8 million rows read per second on average and up to 15 million per second at times. All the while, our production reads and writes continued without disruption. When we tested the Cloud-Storage-to-Bigtable restore job, the write speed, expectedly, increased with instance scale — at the maximum node quota for our regions, we observed an average of just under 2 million rows per second written to our new table.
Short links for the long haul
As mentioned above, not only did Bigtable meet our technical requirements and operational needs, but we also chose Bigtable because it sets us up for future growth. Its ability to scale seamlessly over time while improving our system availability SLA was a major factor in our decision.
As we increase our scale by 5x, 10x, or more, it’s imperative that our data backbone scales accordingly and that the SLAs we provide to customers stay stable or even add another coveted “9”. We have big plans in the coming years and Bigtable will help us achieve them.
Interested in learning more? We found the following resources to be useful in our journey to Bigtable evaluation and ultimate adoption:
- Evaluate Bigtable schema design for your relational database and application workloads
- Understand how to increase availability and distribute data globally with Bigtable replication in any region combination of your choice
- Learn more about Bigtable backups and importing/exporting data with Bigtable Dataflow templates
Bonus: If you’re interested in learning more of the nuts and bolts of how we migrated the data, I’ll be talking all about that very topic at GopherCon 2023 this September in San Diego!
How to Enhance Incremental Pipeline Performance while Ingesting Data into BigQuery

6312
Of your peers have already read this article.
3:00 Minutes
The most insightful time you'll spend today!
When you build a data warehouse, the important question is how to ingest data from the source system to the data warehouse. If the table is small you can fully reload a table on a regular basis, however, if the table is large a common technique is to perform incremental table updates. This post demonstrates how you can enhance incremental pipeline performance when you ingest data into BigQuery.
Setting up a standard incremental data ingestion pipeline
We will use the below example to illustrate a common ingestion pipeline that incrementally updates a data warehouse table. Let’s say that you ingest data into BigQuery from a large and frequently updated table in the source system, and you have Staging and Reporting areas (datasets) in BigQuery.

The Reporting area in BigQuery stores the most recent, full data that has been ingested from the source system tables. Usually you create the base table as a full snapshot of the source system table. In our running example, we use BigQuery public data as the source system and create reporting.base_table as shown below. In our example each row is identified by a unique key which consists of two columns: block_hash and log_index.
CREATE TABLE reporting.base_table --156 GB processedPARTITION BY TIMESTAMP_TRUNC(block_timestamp, DAY) ASSELECT log_index, data, topics, block_timestamp, block_hashFROM bigquery-public-data.crypto_ethereum.logsWHERE block_timestamp BETWEEN TIMESTAMP '2020-01-01' AND TIMESTAMP '2020-11-30';
In data warehouses it is common to partition a large base table by a datetime column that has a business meaning. For example, it may be a transaction timestamp, or datetime when some business event happened, etc. The idea is that data analysts who use the data warehouse usually need to analyze only some range of dates and rarely need the full data. In our example, we partition the base table by block_timestamp which comes from the source system.
After ingesting the initial snapshot you need to capture changes that happen in the source system table and update the reporting base table accordingly. This is when the Staging area comes into the picture. The staging table will contain captured data changes that you will merge into the base table. Let’s say that in our source system on a regular basis we have a set of new rows and also some updated records. In our example we mock the staging data as follows: first, we create new data, than we mock the updated records:
CREATE TABLE staging.load_delta AS --5 GB processedSELECT log_index, data, topics, block_timestamp, block_hashFROM bigquery-public-data.crypto_ethereum.logsWHERE block_timestamp BETWEEN TIMESTAMP '2020-12-01' AND TIMESTAMP '2020-12-07';INSERT INTO staging.load_delta --2 GB processedSELECT log_index, CONCAT(data, RAND()), topics, block_timestamp, block_hashFROM bigquery-public-data.crypto_ethereum.logs TABLESAMPLE SYSTEM (5 PERCENT)WHERE block_timestamp BETWEEN TIMESTAMP '2020-10-01' AND TIMESTAMP '2020-11-30';
Next, the pipeline merges the staging data into the base table. It joins two tables by unique key and than updates the changed value or inserts a new row
MERGE INTO reporting.base_table T --161 GB processedUSING staging.load_delta SON T.block_hash = S.block_hashAND T.log_index = S.log_indexWHEN MATCHED THEN UPDATE SETT.data = S.dataWHEN NOT MATCHED THEN INSERT (log_index, data, topics, block_timestamp, block_hash)VALUES (log_index, data, topics, block_timestamp, block_hash);
It is often the case that the staging table contains keys from various partitions but the number of those partitions are relatively small. It holds, for instance, because in the source system the recently added data may get changed due to some initial errors or ongoing processes but older records are rarely updated. However, when the above MERGE gets executed, BigQuery scans all partitions in the base table and processes 161 GB of data. You might add additional join condition on block_timestamp:
MERGE INTO reporting.base_table T --161 GB processedUSING staging.load_delta SON T.block_hash = S.block_hashAND T.log_index = S.log_indexAND T.block_timestamp = S.block_timestampWHEN MATCHED THEN UPDATE SETT.data = S.dataWHEN NOT MATCHED THEN INSERT (log_index, data, topics, block_timestamp, block_hash)VALUES (log_index, data, topics, block_timestamp, block_hash);
But BigQuery would still scan all partitions in the base table because condition T.block_timestamp = S.block_timestamp is a dynamic predicate and BigQuery doesn’t automatically push such predicates down from one table to another in MERGE.
Can you improve the MERGE efficiency by making it scan less data? The answer is Yes.
As described in the MERGE documentation, pruning conditions may be located in a subquery filter, a merge_condition filter, or a search_condition filter. In this post we show how you can leverage the first two. The main idea is to turn a dynamic predicate into a static predicate.
Steps to enhance your ingestion pipeline
The initial step is to compute the range of partitions that will be updated during the MERGE and store it in a variable. As was mentioned above, in data ingestion pipelines, staging tables are usually small so the cost of the computation is relatively low.
DECLARE src_range STRUCT<date_min TIMESTAMP, date_max TIMESTAMP> --115 MB processedDEFAULT(SELECT STRUCT(MIN(block_timestamp) AS date_min,MAX(block_timestamp) AS date_max) FROM staging.load_delta);
Based on your existing ETL/ELT pipeline, you can add the above code as-is to your pipeline or you can compute date_min, data_max as part of some already existing transformation step. Alternatively, date_min, data_max can be computed on the Source System side while capturing the next ingestion data batch.
After computing date_min, date_max you pass those values to the MERGE statement as static predicates. There are several ways to enhance the MERGE and prune partitions in the base table based on precomputed date_min, data_max.
If your initial MERGE statement uses a subquery, you can incorporate a new filter into it:
BEGINDECLARE src_range STRUCT<date_min TIMESTAMP, date_max TIMESTAMP> --115 MB processedDEFAULT(SELECT STRUCT(MIN(block_timestamp) AS date_min,MAX(block_timestamp) AS date_max) FROM staging.load_delta);MERGE INTO reporting.base_table T --41 GB processedUSING (SELECT *FROM staging.load_deltaWHERE block_timestamp BETWEEN src_range.date_min AND src_range.date_max) SON T.block_hash = S.block_hashAND T.log_index = S.log_indexAND T.block_timestamp = S.block_timestampWHEN MATCHED THEN UPDATE SETT.data = S.dataWHEN NOT MATCHED THEN INSERT (log_index, data, topics, block_timestamp, block_hash)VALUES (log_index, data, topics, block_timestamp, block_hash);END;
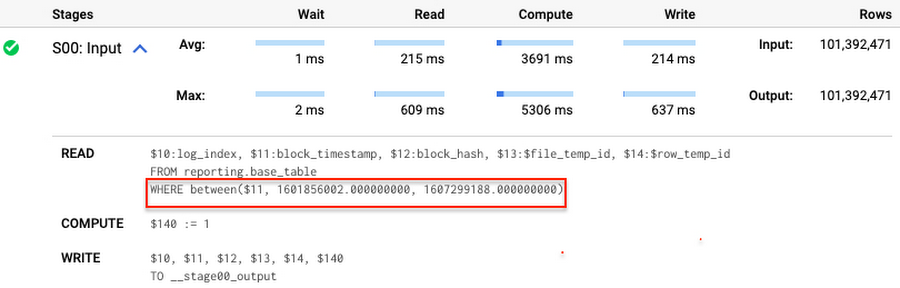
Note that you add the static filter to the staging table and keep T.block_timestamp = S.block_timestamp to convey to BigQuery that it can push that filter to the base table. This MERGE processes 41 GB of data in contrast to the initial 161 GB. You can see in the query plan that BigQuery pushes the partition filter from the staging table to the base table:
This type of optimization, when a pruning condition is pushed from a subquery to a large partitioned or clustered table, is not unique for MERGE. It also works for other types of queries. For instance:
SELECT * -- 41 GB processedFROM reporting.base_table TINNER JOIN staging.load_delta SON T.block_hash = S.block_hashAND T.log_index = S.log_indexAND T.block_timestamp = S.block_timestampWHERE S.block_timestamp BETWEEN TIMESTAMP '2020-10-05' AND TIMESTAMP '2020-12-07'
And you can check the query plan to verify that BigQuery pushed down the partition filter from one table to another.
Moreover, for SELECT statements, BigQuery can automatically infer a filter predicate on a join column and push it down from one table to another if your query meets the following criteria:
- The target table must be clustered or partitioned.
- The result size of the other table, i.e. after applying all filters, must qualify for broadcast join. Namly, the result set must be relatively small, less than ~100MB.
In our running example, reporting.base_table is partitioned by block_timestamp. If you define a selective filter on staging.load_delta and join two tables, you can see an inferred filter on the join key pushed to the target table
SELECT *FROM reporting.base_table TINNER JOIN staging.load_delta SON T.block_timestamp = S.block_timestampWHERE S.block_hash = '0x0c1caa16b34d94843aabfebc0d5a961db358135988f7498a6fdc450ad55f0870'
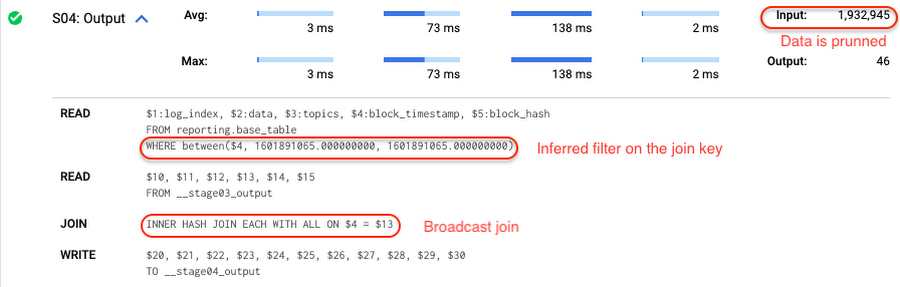
There is no requirement to join tables by partitioning or clustering key to kick off this type of optimization. However, in this case the pruning effect on the target table would be less significant.
But let us get back to the pipeline optimizations. Another way to enhance MERGE is to modify the merge_condition filter by adding static predicate on the base table:
BEGINDECLARE src_range STRUCT<date_min TIMESTAMP, date_max TIMESTAMP> --115 MB processedDEFAULT(SELECT STRUCT(MIN(block_timestamp) AS date_min,MAX(block_timestamp) AS date_max) FROM staging.load_delta);MERGE INTO reporting.base_table T --41 GB processedUSING staging.load_delta SON T.block_hash = S.block_hashAND T.log_index = S.log_indexAND T.block_timestamp BETWEEN src_range.date_min AND src_range.date_maxWHEN MATCHED THEN UPDATE SETT.data = S.dataWHEN NOT MATCHED THEN INSERT (log_index, data, topics, block_timestamp, block_hash)VALUES (log_index, data, topics, block_timestamp, block_hash);END;
To summarize, here are the steps that you can perform to enhance incremental ingestion pipelines in BigQuery. First you compute the range of updated partitions based on the small staging table. Next, you tweak the MERGE statement a bit to let BigQuery know to prune data in the base table.
All the enhanced MERGE statements scanned 41 GB of data, and setting up the src_range variable took 115 MB. Compare it with the initial 161 GB scan. Moreover, given that computing src_range may be incorporated into some existing transformation in your ETL/ELT, it results in a good performance improvement which you can leverage in your pipelines.
In this post we described how to enhance data ingestion pipelines by turning dynamic filter predicates into static predicates and letting BiQuery prune data for us. You can find more tips on BigQuery DML tuning here.
Special thanks to Daniel De Leo, who helped with examples and provided valuable feedback on this content.
Real-time analytics for on-time delivery: Mercado Libre

3041
Of your peers have already read this article.
1:30 Minutes
The most insightful time you'll spend today!
Iteration and innovation fuel the data-driven culture at Mercado Libre. In our first post, we presented our continuous intelligence approach, which leverages BigQuery and Looker to create a data ecosystem on which people can build their own models and processes.
Using this framework, the Shipping Operations team was able to build a new solution that provided near real-time data monitoring and analytics for our transportation network and enabled data analysts to create, embed, and deliver valuable insights.
The challenge
Shipping operations are critical to success in e-commerce, and Mercado Libre’s process is very complex since our organization spans multiple countries, time zones, and warehouses, and includes both internal and external carriers. In addition, the onset of the pandemic drove exponential order growth, which increased pressure on our shipping team to deliver more while still meeting the 48-hour delivery timelines that customers have come to expect.
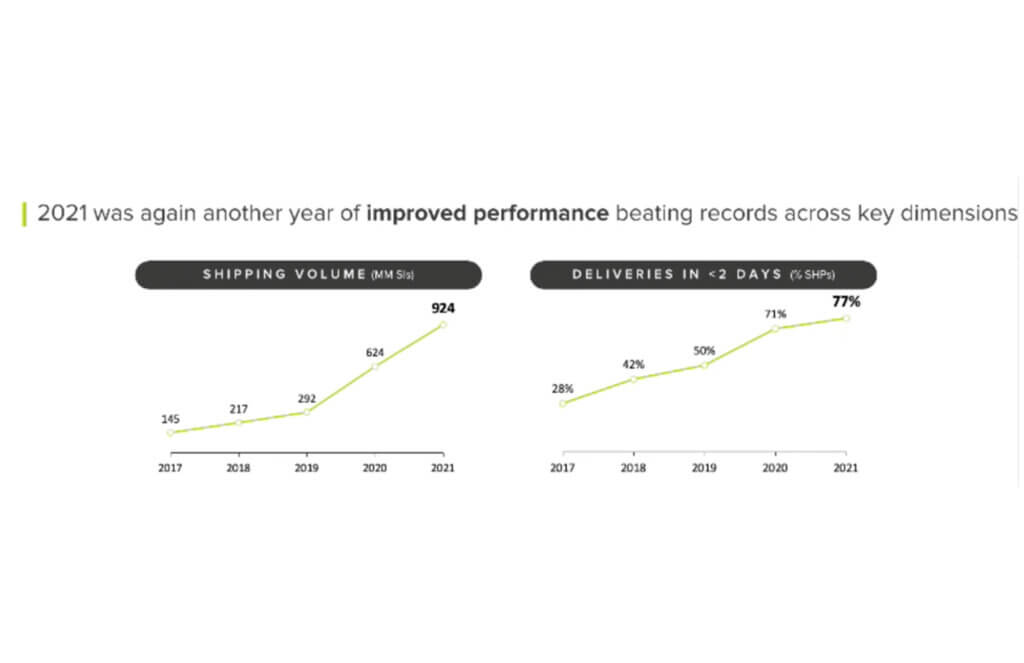
This increased demand led to the expansion of fulfillment centers and cross-docking centers, doubling and tripling the nodes of our network (a.k.a. meli-net) in the leading countries where we operate. We also now have the largest electric vehicle fleet in Latin America and operate domestic flights in Brazil and Mexico.
We previously worked with data coming in from multiple sources, and we used APIs to bring it into different platforms based on the use case. For real-time data consumption and monitoring, we had Kibana, while historical data for business analysis was piped into Teradata. Consequently, the real-time Kibana data and the historical data in Teradata were growing in parallel, without working together. On one hand, we had the operations team using real-time streams of data for monitoring, while on the other, business analysts were building visualizations based on the historical data in our data warehouse.
This approach resulted in a number of problems:
- The operations team lacked visibility and required support to build their visualizations. Specialized BI teams became bottlenecks.
- Maintenance was needed, which led to system downtime.
- Parallel solutions were ungoverned (the ops team used an Elastic database to store and work with attributes and metrics) with unfriendly backups and data bounded for a period of time.
- We couldn’t relate data entities as we do with SQL.
Striking a balance: real-time vs. historical data
We needed to be able to seamlessly navigate between real-time and historical data. To address this need, we decided to migrate the data to BigQuery, knowing we would leverage many use cases at once with Google Cloud.
Once we had our real-time and historical data consolidated within BigQuery, we had the power to make choices about which datasets needed to be made available in near real-time and which didn’t. We evaluated the use of analytics with different time windows tables from the data streams instead of the real-time logs visualization approach. This enabled us to serve near real-time and historical data utilizing the same origin.
We then modeled the data using LookML, Looker’s reusable modeling language based on SQL, and consumed the data through Looker dashboards and Explores. Because Looker queries the database directly, our reporting mirrored the near real-time data stored in BigQuery. Finally, in order to balance near real-time availability with overall consumption costs, we analyzed key use cases on a case-by-case basis to optimize our resource usage.
This solution prevented us from having to maintain two different tools and featured a more scalable architecture. Thanks to the services of GCP and the use of BigQuery, we were able to design a robust data architecture that ensures the availability of data in near real-time.
Streaming data with our own Data Producer Model: from APIs to BigQuery
To make new data streams available, we designed a process which we call the “Data Producer Model” (“Modelo Productor de Datos” or MPD) where functional business teams can serve as data creators in charge of generating data streams and publishing them as related information assets we call “data domains”. Using this process, the new data comes in via JSON format, which is streamed into BigQuery. We then use a 3-tiered transformation process to convert that JSON into a partitioned, columnar structure.
To make these new data sets available in Looker for exploration, we developed a Java utility app to accelerate the development of LookML and make it even more fun for developers to create pipelines.
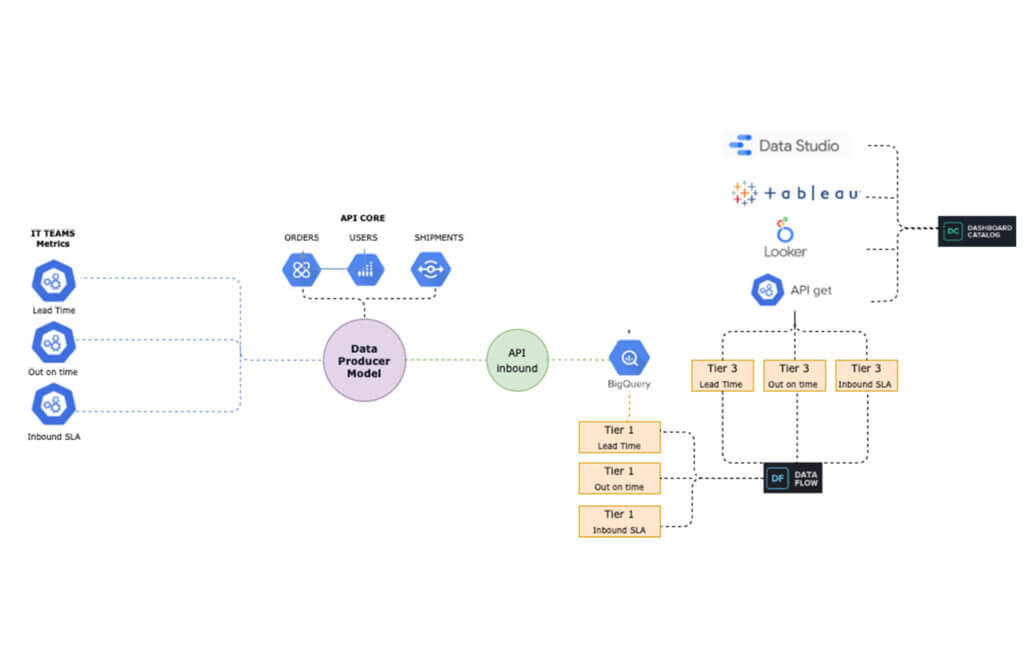
The complete “MPD” solution results in different entities being created in BigQuery with minimal manual intervention. Using this process, we have been able to automate the following:
- The creation of partitioned, columnar tables in BigQuery from JSON samples
- The creation of authorized views in a different GCP BigQuery project (for governance purposes)
- LookML code generation for Looker views
- Job orchestration in a chosen time window
By using this code-based incremental approach with LookML, we were able to incorporate techniques that are traditionally used in DevOps for software development, such as using Lams to validate LookML syntax as a part of the CI process and testing all our definitions and data with Spectacles before they hit production. Applying these principles to our data and business intelligence pipelines has strengthened our continuous intelligence ecosystem. Enabling exploration of that data through Looker and empowering users to easily build their own visualizations has helped us to better engage with stakeholders across the business.
The new data architecture and processes that we have implemented have enabled us to keep up with the growing and ever-changing data from our continuously expanding shipping operations. We have been able to empower a variety of teams to seamlessly develop solutions and manage third party technologies, ensuring that we always know what’s happening – and more critically – enabling us to react in a timely manner when needed.
Outcomes from improving shipping operations:
Today, data is being used to support decision-making in key processes, including:
- Carrier Capacity Optimization
- Outbound Monitoring
- Air Capacity Monitoring
This data-driven approach helps us to better serve you -and everyone- who expects to receive their packages on-time according to our delivery promise. We can proudly say that we have improved both our coverage and speed, delivering 79% of our shipments in less than 48 hours in the first quarter of 2022.
Here is a sneak peek into the data assets that we use to support our day-to-day decision making:
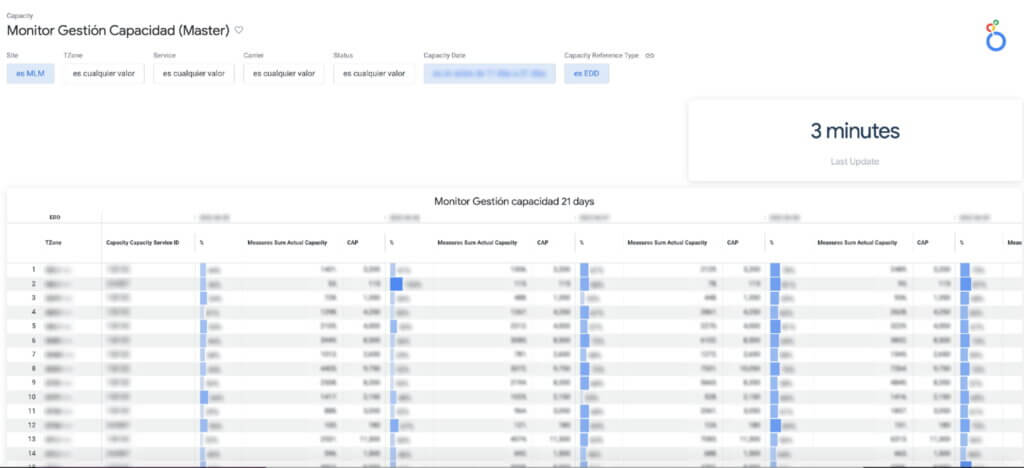
a. Carrier Capacity: Allows us to monitor the percentage of network capacity utilized across every delivery zone and identify where delivery targets are at risk in almost real time.
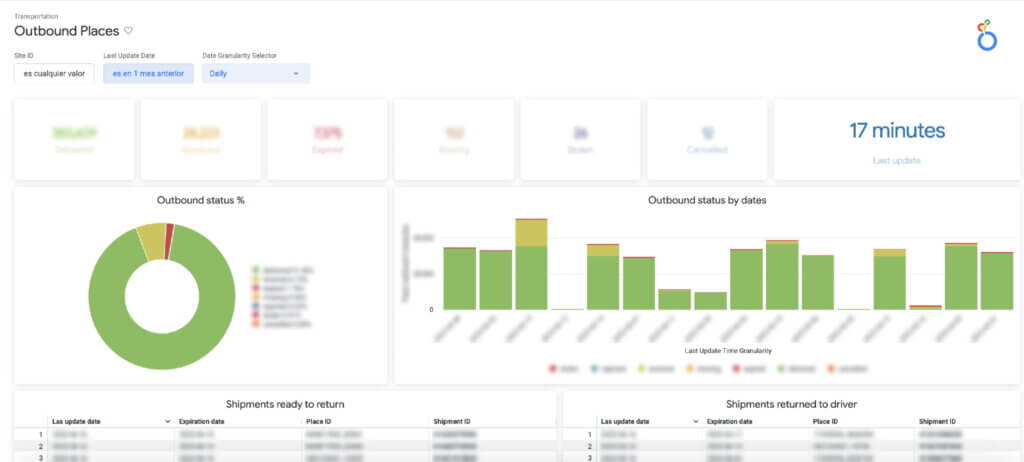
b. Outbound Places Monitoring: Consolidates the number of shipments that are destined for a place (the physical points where a seller picks up a package), enabling us to both identify places with lower delivery efficiency and drill into the status of individual shipments.
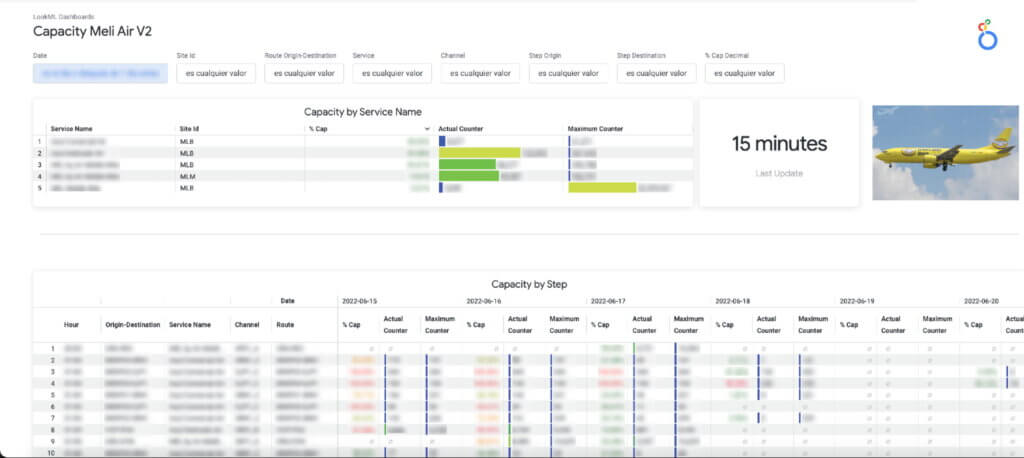
c. The Air Capacity Monitoring: Provides capacity usage monitoring for our aircrafts running each of our shipping routes.
Costs into the equation
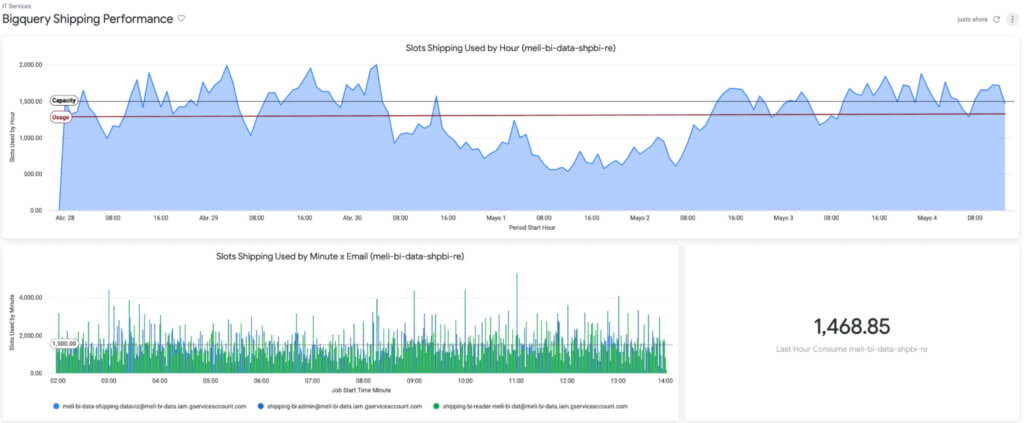
The combination of BigQuery and Looker also showed us something we hadn’t seen before: overall cost and performance of the system. Traditionally, developers maintained focus on metrics like reliability and uptime without factoring in associated costs.
By using BigQuery’s information schema, Looker Blocks, and the export of BigQuery logs, we have been able to closely track data consumption, quickly detect underperforming SQL and errors, and make adjustments to optimize our usage and spend.
Based on that, we know the Looker Shipping Ops dashboards generate a concurrency of more than 150 queries, which we have been able to optimize by taking advantage of BigQuery and Looker caching policies.
The challenges ahead
Using BigQuery and Looker has enabled us to solve numerous data availability and data governance challenges: single point access to near real-time data and to historical information, self-service analytics & exploration for operations and stakeholders across different countries & time zones, horizontal scalability (with no maintenance), and guaranteed reliability and uptime (while accounting for costs), among other benefits.
However, in addition to having the right technology stack and processes in place, we also need to enable every user to make decisions using this governed, trusted data. To continue achieving our business goals, we need to democratize access not just to the data but also to the definitions that give the data meaning. This means incorporating our data definitions with our internal data catalog and serving our LookML definitions to other data visualizations tools like Data Studio, Tableau or even Google Sheets and Slides so that users can work with this data through whatever tools they feel most comfortable using.
If you would like a more indepth look at how we made new data streams available from a process we designed called the “Data Producer Model” (“Modelo Productor de Datos” or MPD) register to attend our webcast on August 31.
While learning and adopting new technologies can be a challenge, we are excited to tackle this next phase, and we expect our users will be too, thanks to a curious and entrepreneurial culture. Are our teams ready to face new changes? Are they able to roll out new processes and designs? We’ll go deep on this in our next post.
Partnering with Google Cloud is the Key Behind Recent Healthcare Innovations

8824
Of your peers have already read this article.
2:00 Minutes
The most insightful time you'll spend today!
It’s simply amazing to witness how some of our systems integrators employ Google Cloud solutions to drive innovation in ways we at Google may never have considered—especially in healthcare. According to analyst firm MarketsandMarkets, the market for the Cloud in healthcare is projected to grow 43% between 2020 and 2025 to nearly $65 billion, fueled by the need for better technology infrastructures and faster digital transformation.
Healthcare and life sciences communities are looking to Google Cloud and its Service engagement model partners to improve collaboration and activate the power of medical data. These transformations deliver robust data analytics and bring a much deeper perspective into health epidemics like COVID-19 to help save lives.
In the healthcare and life sciences industry, our Google Cloud partners and customers provide constant energy and inspiration–and are the magic in some key healthcare innovations globally.
Let me show you how they are solving real-world business challenges.
Improving collaboration in Healthcare
Cloudbakers and Comanche County Memorial Hospital transitioned 2,000 employees to Google Workspace to improve collaboration, reduce costs, and increase security. By implementing a system that requires less maintenance while enabling mobile access to data and true collaboration, Comanche County Memorial Hospital saves $175,000 annually on licenses and helps medical professionals spend more time with patients.
“We chose Google Workspace because it cost a quarter of what we were paying previously, offers the kind of modern features that healthcare facilities need, and gave us data security and peace of mind.” —James Wellman, CIO, Comanche County Memorial Hospital
Accessing previously locked down medical data
Google Cloud and Quantiphi supported advances in cloud-based machine learning services to reduce infrastructure costs, unlock new paths of treatment, and dramatically reduce the amount of time it takes to evaluate scanned imagery following a stroke. John Hopkins University BIOS Division has been working on medical imaging to accelerate insights from scans on approximately 500 patients from 2,500 hours to 90 minutes, and lead to more accurate decision-making for brain injury patients that will ultimately improve medical outcomes.
“We’ve aligned closely with the goal of showing that a cloud-based, AI-driven approach is robust and that it can be performed while protecting personal PHI. In terms of costs, the cloud has definitely reduced some of the traditional financial demands of our research.” —Daniel F. Hanley, Jr., M.D., Director, Johns Hopkins University BIOS Division
Improving data access with the flexibility of Google Cloud
With the help of MediaAgility, TRIARQ migrated to Google Cloud to modernize their platform, build new applications, and expand their global footprint. With BigQuery, TRIARQ can now consolidate all transactional data, past and present, into a single location to report on specific insights and predict future data from e-prescriptions to complex revenue-cycle data and value-base analysis.
“The future of this industry will need to be a global one, and we can no longer be stuck in legacy systems if we want to survive. Having a team that is passionate about supporting us in this journey is definitely a plus point.”—Yaw Kwakye, Co-founder and Chief Architect, TRIARQ
Increasing visibility to COVID-19 outbreaks for actionable insights
As part of its response to the COVID-19 pandemic, HCA Healthcare chose to work with Google Cloud and SADA to create a national portal that increases visibility into outbreaks in 3,100 counties across the country in just 8 weeks. Now, the portal generates 30,000 new analytical views each day that can help inform private and public sector decision making for reopenings, closures, hot spots, and many other population health management activities.
“This project required deep knowledge of AI, and consumer-facing platforms, as well as healthcare. Google brought together the ideal combination of product, people, and partners. Google Cloud’s healthcare-specific products along with SADA’s expertise in the healthcare IT space made this partnership the perfect choice to move quickly and intelligently.”—Dr. Edmund Jackson, Chief Data Officer, HCA Healthcare
We’re committed to building the technology, resources, and services through Partner Advantage to help our partners address this opportunity. Looking for a solution focused partner in your region who has achieved Expertise and/or Specialization in your industry? Search our Global Partner Directory. Not yet a Google Cloud partner? Visit Partner Advantage and learn how to become one today!
Google Launches Open Saves To Power Gaming Platforms Scale to User Demands

5486
Of your peers have already read this article.
1:30 Minutes
The most insightful time you'll spend today!
Many of today’s games are rich, immersive worlds that engage the audience in ways that make a gamer a part of a continuing storyline. To create these persistent experiences, numerous storage technologies are required to ensure game data can scale to the standards of gamers’ demands. Not only do game developers need to store different types of data—such as saves, inventory, patches, replays, and more—but they also must keep the storage system high-performing, available, scalable, and cost-effective.
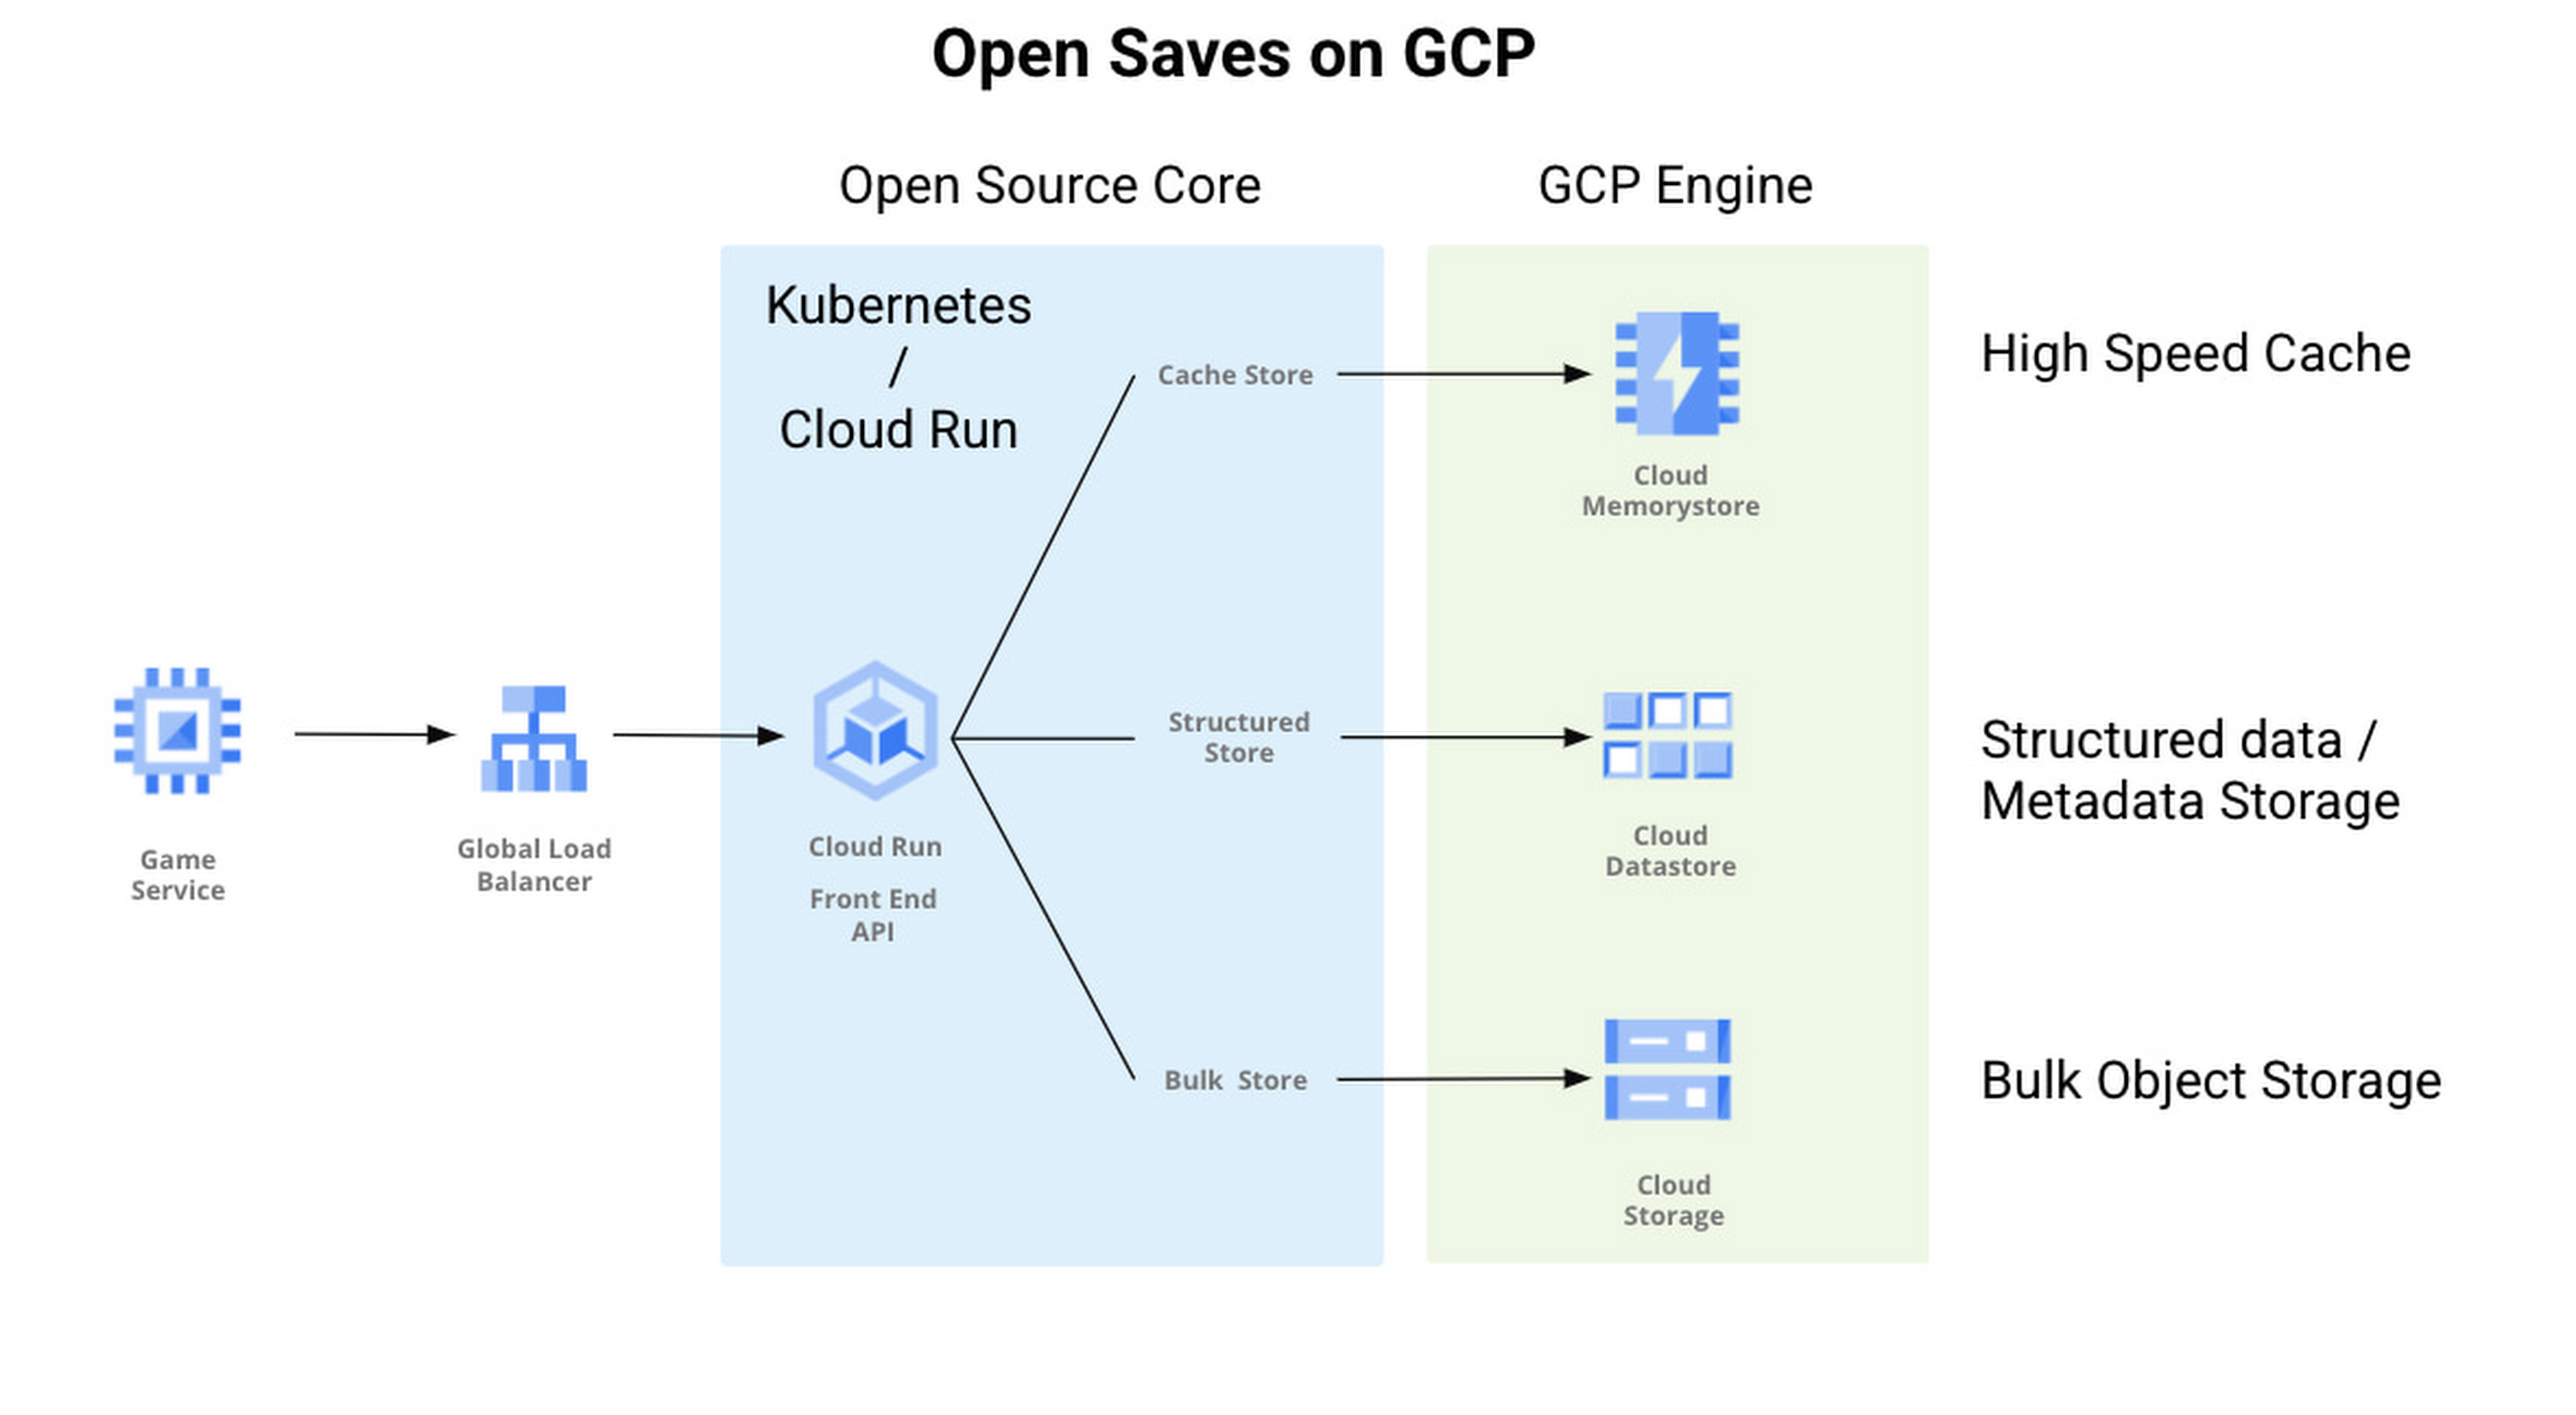
Enter Open Saves, a brand-new, purpose-built single interface for multiple storage back ends that’s powered by Google Cloud and developed in partnership with 2K. Now, development teams can store game data without having to make the technical decisions on which storage solution to use, whether that’s Cloud Storage, Memorystore, or Firestore.
“Open Saves demonstrates our commitment to partnering with top developers on gaming solutions that require a combination of deep industry expertise and Google scale,” said Joe Garfola, Vice President of IT and Security at 2K. “We look forward to continued collaboration with Google Cloud.”
Game development teams can save game data against Open Saves without having to worry about the optimal back-end storage solution, while operations teams can focus on needed scalability and storage options. Here’s how it looks in practice:
With Open Saves, game developers can run a cloud-native game storage system that is:
- Simple: Open Saves provides a unified, well-defined gRPC endpoint for all operations for metadata, structured, and unstructured objects.
- Fast: With a built-in caching system, Open Saves optimizes data placements based on access frequency and data size, all to achieve both low latency for smaller binary objects and high throughput for big objects.
- Scalable: The Open Saves API server can run on either Google Kubernetes Engine or Cloud Run. Both platforms can scale out to handle hundreds of thousands of requests per second. Open Saves also stores data in Firestore and Cloud Storage, and can handle hundreds of gigabytes of data and up to millions of requests per second.
Open Saves is designed with extensibility in mind, and can be integrated into any game—whether mobile or console, multiplayer or single player—running on any infrastructure, from on-prem to cloud or a hybrid. The server is written in Go, but you can use many programming languages and connect from client or server since the API is defined in gRPC.
Writing to and reading from Open Saves is as simple as the following code:
// To writerecord := &pb.Record{Key: uuid.New().String(),Tags: []string{"tag1", "tag2"},OwnerId: "owner",}createReq := &pb.CreateRecordRequest{StoreKey: storeKey,Record: record,}_, err := client.CreateRecord(ctx, createReq)if err != nil {t.Fatalf("CreateRecord failed: %v", err)}// To readgetReq := &pb.GetRecordRequest{StoreKey: storeKey, Key: recordKey}response, err := client.GetRecord(ctx, getReq)if err != nil {t.Errorf("GetRecord failed: %v", err)}
We are actively developing Open Saves in partnership with 2K Games, and would love for you to come join us on GitHub. There are a few ways to get involved:
- Install and deploy your Open Saves service
- Check out the API reference
- Read the development guide and start contributing
- Join the open-saves-discuss mailing list
Data Cloud Skills to Pick Up in 2022: Google Experts Recommended

4953
Of your peers have already read this article.
3:00 Minutes
The most insightful time you'll spend today!
It’s 2022 and nanosatellites, NFTs, and autonomous cars that deliver your pizza are in full force. In a world where people rely on simple technology to untangle complex problems, companies must deliver simple experiences to be successful in today’s landscape. For many cloud providers this means enabling tightly integrated data offerings that simplify the data delivery process without losing sight of the sophisticated needs of the modern data consumer.
But while the name of the game is helping companies reach informed decisions from their data simpler and faster, what about the data practitioners – data analysts, data engineers, database administrators, developers, etc – who use these cloud data tools and technologies everyday? To proactively stay ahead of data cloud market trends in 2022 should data practitioners invest their time in specializing their data cloud skill sets (e.g. go deep in, say, data pipelining skills) or instead invest their time generalizing their data cloud skill sets (e.g. growing proficiencies in a mix of data analytics, databases, AI/ML, and more domains)?
Skill deep or wide with data – that is the question
For Abdul Razack, VP, Solutions Engineering, Technology Solutions and Strategy at Google Cloud, the answer is a bit of both.
“Data practitioners need to be broad in terms of their technology skills, but specialized with respect to the domain or domains in which they apply them. The reason why is because many things that used to be separate skill sets are now converging – like business analytics, streaming, machine learning, data pipelines, and data warehousing. Data practitioners need to be able to implement end-to-end workflows that solve specific business problems using skills from each category.”
It’s true, thousands of customers are choosing Google’s data cloud because it offers a unified and open approach to cloud that enables their practitioners to break down silos, begin and end projects without leaving the data platform, and innovate faster across their organization.
The data practitioners who mirror Google data cloud’s frame of mind of being smart and agile across data domains in their skilling and learning will reap the benefits of solving more nuanced problems – building out internet-scale applications, fine tuning smart processes with analytics and AI, constructing data meshes that make product building simple, etc – at a larger scale than they would if they specialized in just one or two areas alone.
“Of course at the end of the day it depends on what tools a data practitioner is using to complete their workflows. There’s only so much you can learn and skills you can develop when you’re using limited tools. Growing data proficiencies across the board is made a lot easier when you’re using a data platform like BigQuery to address all these needs. BigQuery eliminates the choices you have to make – for instance you don’t have to choose between streaming data and data at rest, batch and realtime, or business intelligence and data science. This freedom gives data professionals a huge advantage when they’re building their skill sets and taking on more complex projects.” -Abdul Razack – VP, Solutions Engineering, Technology Solutions and Strategy, Google Cloud
Knowing your value is half the battle when upskilling
While some experts think technology is the limiting factor of whether or not you can even go wide or go deep in the first place, others like Google Cloud’s Head of Data and Analytics Bruno Aziza purport that it also depends on who you are, who you wish to be, and what investments your company is making to ensure you can become that person.
“If you wish to set yourself up to be a Chief Data Officer, then you’ll want to understand how technologies fit together across your data estate first” said Aziza. “Only after you feel like you’re the go-to ‘data person’ can you then decide which part of the technology stack you want to double-down on.”
But technology isn’t everything. Aziza notes, “Make sure you focus on the business impact that your data work provides. You want to spend as much time as you can with your business counterparts to understand their business goals and challenges. The Harvard Business Review provides great guidance on how to succeed as a Chief Data Officer.”
Even if you don’t have your sights set on a C-suite role, both Aziza and Razack contend that the number one skill data practitioners should tackle in 2022 is actually a broad and perhaps abstract one: develop and exercise the curiosity to solve problems with a data-driven strategy.
That is, today’s data practitioners should always be interested in educating themselves in the industry and continually upskilling in something. And their employers should also be invested in helping practitioners develop those interests, most likely through exposure to learning materials, engaging in career conversations, subsidized courses, or incentives attached to pursuing a new certification or skill.
“Every industry is going through a digital transformation and the ability to identify what data to collect, how to prepare the data, and how to derive insights from it is critical. Therefore, the ability to find business challenges and formulate a data-driven approach to address those problems is the most important skill to have.” Abdul Razack – VP, Solutions Engineering, Technology Solutions and Strategy, Google Cloud.
Take the example of the “Data Mesh” I just wrote about in VentureBeat. You’ll find 3 types of attitudes towards this new concept. There are Disciples who encourage continued learning only from the source – like the author of a new book or the creator of a theory. There are Distractors who tell you that new skills, trends, and technologies are fake news. And there are Distorters like vendors who will sell you one easy fix solution. But it’s the data practitioner who needs to proceed with caution when interacting with all three types and forge their own path to discovering the truth when they’re learning and building skills. And for better or worse, this comes with trial and error, experimentation, and an eagerness to grow relative to where they began.”
Ready to start data upskilling? Start here.
For those interested in keeping up their data curiosities, check out our Data Journeys video series. Each week Bruno Aziza investigates a new authentic customer’s data journey – from migrating to cloud or building a data platform to carrying out new data for good initiatives. Learn how they did it, their data dos and don’ts, and what’s next for them on their journey. These videos include a flavor of both specializing your data competencies and broadening your data competencies.
For those interested in deepskilling, connect with Google’s data community at our upcoming virtual event: Latest Google Cloud data analytics innovations. Register and save your spot now to get your data questions answered live by GCP’s top data leaders and watch demos from our latest products and features including BigQuery, Dataproc, Dataplex, Dataflow, and more.
If you have any questions or need support along your learning journey – we’re here for you! Sign up to be a Google Cloud Innovator, and join the Google Cloud Data Analytics Community.
More Relevant Stories for Your Company

Demystifying Transactional Locking in Cloud Spanner
Cloud Spanner is a fully managed relational database with unlimited scale, strong consistency, and up to 99.999% availability. It is designed for highly concurrent applications that read and update data, for example, to process payments or for online game play. To ensure the consistency across multiple concurrent transactions, Cloud Spanner
How to Decide Whether to Run a Database on Kubernetes
Today, more and more applications are being deployed in containers on Kubernetes—so much so that we’ve heard Kubernetes called the Linux of the cloud. Despite all that growth on the application layer, the data layer hasn’t gotten as much traction with containerization. That’s not surprising, since containerized workloads inherently have

Cloud Bigtable brings database stability and performance to Precognitive
At Precognitive, we were able to start with a blank technology slate to support our fraud detection software products. When we started building the initial version of our platform in 2017, we had some decisions to make: What coding language to use? What cloud infrastructure provider to choose? What database

Power up Caching with Memorystore for Memcached
In-memory data stores are a fundamental infrastructure for building scalable, high-performance applications. Whether it is building a highly responsive ecommerce website, creating multiplayer games with thousands of users, or doing real-time analysis on data pipelines with millions of events, an in-memory store helps provide low latency and scale for millions
