





Demystifying Transactional Locking in Cloud Spanner

3006
Of your peers have already read this article.
3:30 Minutes
The most insightful time you'll spend today!
Cloud Spanner is a fully managed relational database with unlimited scale, strong consistency, and up to 99.999% availability. It is designed for highly concurrent applications that read and update data, for example, to process payments or for online game play. To ensure the consistency across multiple concurrent transactions, Cloud Spanner uses a combination of shared locks and exclusive locks to control access to the data. In this blog, we will explore the different types of locks present in Cloud Spanner. We will also discuss some common cases of transactional locking in Cloud Spanner, and what to look out for to detect when these cases might be occurring.
What is a lock?
Before we get into the details, let us first quickly recap and define a lock in the context of database systems.
“Locks” in databases are a mechanism for concurrency control. Locks are typically held on a resource, which may mean rows, columns, tables or even entire databases. When a resource is locked by a transaction, it cannot be accessed by another transaction until the lock is released.
Timeline view of transactions
Before we proceed to discuss transaction locking in the context of read and read-write transactions, it is important to recap the timeline view of the transactions in Spanner.
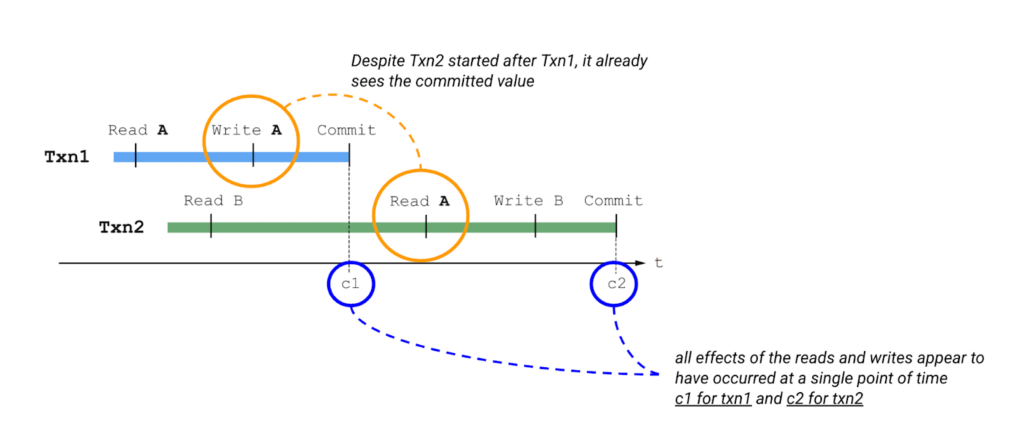
Please also keep in mind the concept of write buffering in transactions, since we refer to it in the Common Transaction Patterns section below. Write buffering refers to the Cloud Spanner server(s) accepting the writes. Note that these writes are not durable until a commit has been performed.
Types of locks in Cloud Spanner
Cloud Spanner operations acquire locks when the operations are part of a read-write transaction. Read-only transactions do not acquire locks. Unlike other approaches that lock entire tables or rows, the granularity of transactional locks in Spanner is a cell, or the intersection of a row and a column. This means that two transactions can read and modify different columns of the same row at the same time. To maximize the number of transactions that have access to a particular data cell at a given time, Cloud Spanner uses different lock modes.
Here is a brief description of the different lock types. Learn more about each lock type in the Cloud Spanner documentation.
- ReaderShared Lock – Acquired when a read-write transaction reads data.
- WriterShared Lock – Acquired when a read-write transaction writes data without reading it.
- Exclusive Lock – Acquired when a read-write transaction which has already acquired a ReaderShared lock tries to write data after the completion of read. It is a special case for a transaction to hold both the ReaderShared lock and WriterShared lock at the same time.
- WriterSharedTimestamp Lock – Special type of lock acquired when inserting new rows with the transaction’s commit timestamp as part of the primary key.
Handling Lock Conflicts
Since read-write transactions use locks to execute atomically, they run the risk of deadlocking. For example, consider the following scenario: transaction Txn1 holds a lock on record A and is waiting for a lock on record B, and Txn2 holds a lock on record B and is waiting for a lock on record A. The only way to make progress in this situation is to abort one of the transactions so it releases its lock, allowing the other transaction to proceed.
Cloud Spanner uses the standard “wound-wait” algorithm to handle deadlock detection. Under the hood, Spanner keeps track of the age of each transaction that requests conflicting locks. It also allows older transactions to abort younger transactions, where “older” means that the transaction’s earliest read, query, or commit happened sooner.
Common Transaction Patterns
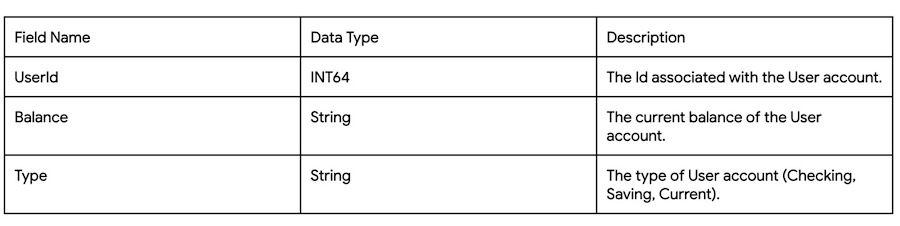
Armed with the basics of transactions and locks in Cloud Spanner, we will now walk through a few practical use-cases. We take the example of an application which queries and updates users’ balance in a table named accounts. The accounts table has the following columns –
Case 1: Transaction waiting to get exclusive lock because of higher priority shared-lock
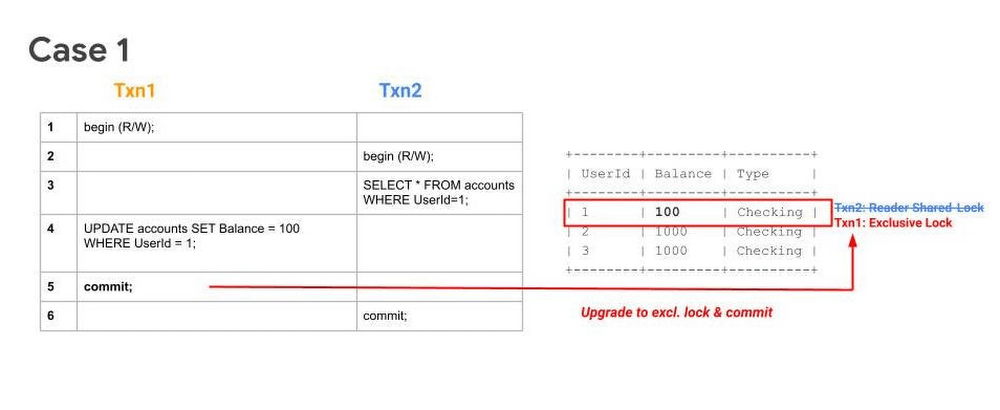
Sequence
- Txn1 begins.
- Txn2 begins.
- Txn2 reads the table and acquires a ReadShared Lock.
- Txn1 buffers its write.
- Txn1 tries to commit, but since Txn2 has higher priority (because it has executed its first operation first), Txn1 will have to wait until Txn2 releases the ReadShared Lock.
After committing, Txn2 releases its ReadShared Lock. Txn1 is now able to upgrade to an Exclusive Lock. It acquires the Exclusive Lock and commits.
Note 1: UPDATE WHERE is always transformed into SELECT WHERE, so an UPDATE statement is not a blind write, but a read-write operation.
Note 2: While the above example considers the use-case of querying and updating a single row, the same transaction pattern is also applicable across a key-range.
What to watch out for
- Timeouts due to Transactions waiting for acquiring locks. Refer to transaction statistics and lock statistics to understand how to detect this.
When does this typically happen
- Concurrent updates to a single key/key-range in a table.
Case 2: Transaction aborted because of concurrent execution succeeding
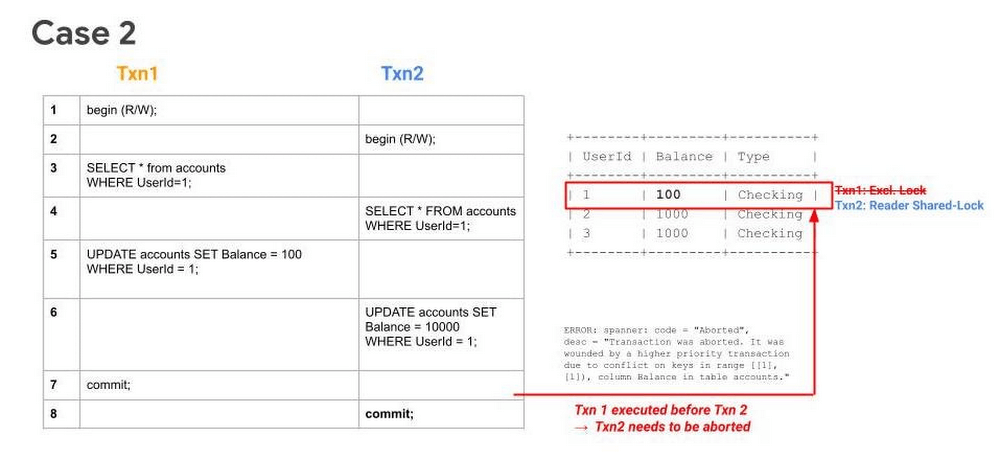
Sequence
- Txn1 begins.
- Txn2 begins.
- Txn1 reads a row from the table and acquires a ReadShared Lock.
- Txn2 reads the same row as Txn1 and acquires a ReadShared Lock.
- Txn1 buffers its write.
- Txn2 buffers its write.
- Txn1 tries to commit, has higher priority (because it has executed its first operation first), it will get priority in upgrading to an Exclusive Lock. It acquires the Exclusive Lock and commits.
Since Txn1 has committed and was the higher priority transaction, Txn1 will abort Txn2.. The abort will likely happen before Txn2 tries to commit.
What to watch out for
- High number of transaction aborts due to wounding of transactions. Refer to transaction statistics and lock statistics to understand how to detect this.
When does this typically happen
- Concurrent updates to a single key/key-range. Typically this happens in the case of hot keys being present in the table.
Case 3: Transaction waiting to get exclusive lock because of higher priority shared-lock & getting aborted because of prior succeeding concurrent execution
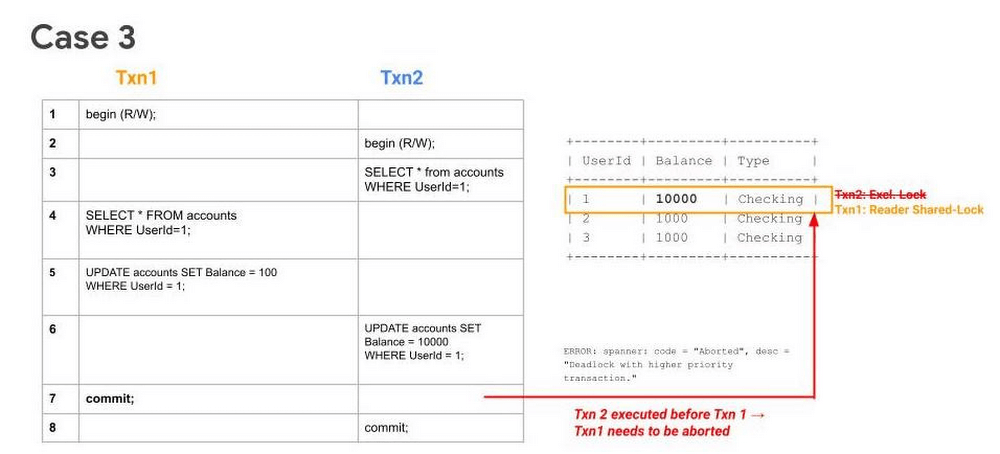
Sequence
- Txn1 begins.
- Txn2 begins.
- Txn2 reads the table and acquires a ReadShared Lock.
- Txn1 reads the table and acquires a ReadShared Lock.
- Txn1 buffers its write.
- Txn2 buffers its write.
- Txn1 tries to commit, but since Txn2 holds a ReadShared Lock, it has to wait until it gets cleared.
- Since Txn2 has higher priority (because it has executed its first operation first), it will acquire the Exclusive Lock first. Txn2 upgrades its ReaderShared Lock to an Exclusive Lock and commits.
Finally, after Step 8, when Txn1 tries to commit (since ReaderShared Lock from Txn2 is now cleared) it gets aborted. This is done to prevent deadlock with the higher priority transaction (Txn2).
Note: In Case 1, even though Txn2 had acquired a ReaderShared Lock earlier as in Case 3, it never upgraded to an Exclusive Lock (since there were no writes). Hence there was no need to abort Txn1, it could simply wait for Txn2 to release its ReaderShared lock and then commit.
What to watch out for
- High number of transaction aborts due to high contention between transactions. Refer to transaction statistics and lock statistics to understand how to detect this.
When does this typically happen
- Concurrent updates to a single key/key-range. Typically this happens in the case of hot keys being present in the table.
Recommendations
In order to mitigate these issues and reduce their occurrence. We recommend adopting the following best practices:
- If you need to perform more than one read at the same timestamp, and know in advance that you only need to read, consider using a read-only transaction. Because read-only transactions don’t write, they don’t hold locks and they don’t block other transactions. Further, read-only transactions never abort, so you don’t need to wrap them in retry loops.
- Always acquire ReadShared Locks on the smallest subset of keys or key ranges. This reduces the chances of lock contention.
- Analyze your code to only include critical path code within a transaction. Avoiding unneeded remote calls or complex, long-running business logic is a good way to ensure a transaction process quickly.
- Analyze your needs for multi-split transactions. Since transactions that update more than one split use a 2-phase commit protocol, they hold locks for a longer duration, thereby increasing chances of lock contention.
Get started today
Spanner’s unique architecture allows it to scale horizontally without compromising on the consistency guarantees that developers rely on in modern relational databases. Try out Spanner today for free for 90 days or for as low as $65 USD per month.
Renaulution: Renault’s story of migrating to 70 applications in 2 years

3325
Of your peers have already read this article.
3:00 Minutes
The most insightful time you'll spend today!
Editor’s note: Renault, the French automaker, embarked on a wholesale migration of its information systems—moving 70 applications to Google Cloud. Here’s how they migrated from Oracle databases to Cloud SQL for PostgreSQL.
The Renault Group, known for its iconic French cars has grown to include four complementary brands, and sold nearly 3 million vehicles in 2020. Following our company-wide strategic plan, “Renaulution,” we’ve shifted our focus over the past year from a car company integrating tech, to a tech company integrating cars that will develop software for our business. For the information systems group, that meant modernizing our entire portfolio and migrating 70 in-house applications (our quality and customer information systems) to Google Cloud. It was an ambitious project, but it’s paid off. In two years we migrated our Quality and Customer Satisfaction information systems applications, optimized our code, and cut costs thanks to managed database services. Compared to our on-premises infrastructure, using Google Cloud services and open-source technologies comes to roughly one dollar per user per year, which is significantly cheaper.
An ambitious journey to Google Cloud
We began our cloud journey in 2016 with digital projects integrating a new way of working and new technologies. These new technologies included those for agility at scale, data capabilities and CI/CD toolchain. Google Cloud stood out as the clear choice for its data capabilities. Not only are we using BigQuery and Dataflow to improve scaling and costs, but we are also now using fully managed database services like Cloud SQL for PostgreSQL. Data is a key asset for a modern car maker because it connects the car maker to the user, allows car makers to better understand usage and better informs what decisions we should make about our products and services. After we migrated our data lake to Google Cloud, it was a natural next step to move our front-end applications to Google Cloud so they would be easier to maintain and we could benefit from faster response times. This project was no small undertaking. For those 70 in-house applications (e.g. vehicle quality evaluation, statistical process control in plants, product issue management, survey analysis), for our information systems landscape, we had a range of technologies—including Oracle, MySQL, Java, IBM MQ, and CFT—with some applications created 20 years ago.
Champions spearhead each migration
Before we started the migration, we did a global analysis of the landscape to understand each application and its complexity. Then we planned a progressive approach, focusing on the smallest applications first such as those with a limited number of screens or with simple SQL queries, and saving the largest for last. Initially we used some automatic tools for the migration, but we learned very quickly nothing can replace the development team’s institutional knowledge. They served as our migration champions.
The apps go marching one by one
When we migrated our first few Oracle databases to Cloud SQL for PostgreSQL we tracked our learnings in an internal wiki to share common SQL patterns, which helped us speed up the process. For some applications, we simplified the architecture and took the opportunity to analyze and optimize SQL queries during the rework. We also used monitoring tools like Dynatrace and JavaMelody to ensure we improved the user experience.
The approach we developed was very successful—where database migration was initially seen as insurmountable, the entire migration project was completed in two years.
With on-premises applications it was hard for our developers to separate code performance from infrastructure limitations. So as part of our migration to Google Cloud, we optimized our applications with monitoring services. With these insights our team has more control over resources, which has reduced our maintenance and operations activity and resulted in faster, more stable applications. Plus, migrating to Cloud SQL has made it much easier for us to change our infrastructure as needed, add more power when necessary or even reduce our infrastructure size.
A new regime on Cloud SQL
Now that we’re running on Cloud SQL, we’ve improved performance even on large databases with many connected users. Thanks to built-in tools in the Google Cloud environment, we can now easily understand performance issues and quickly solve them. For example, we were able to reduce the duration of a heavy batch processing by a factor of three from nine to three hours. And we don’t have to wait for the installation of a new server, so our team can move faster. Beyond speed, we’ve also been able to cut costs. We optimized our code based on insights from monitoring tools, which not only enabled a more responsive application for the user, but it also reduced our costs because we’re not overprovisioned.
Learn more about the Renault Group and try out Cloud SQL today.

1298
Of your peers have already downloaded this article
4:30 Minutes
The most insightful time you'll spend today!
Google Cloud’s managed database services can help you innovate faster and reduce operational overhead. The migration tools and resources included in this whitepaper will help you plan your migration.
This whitepaper provides guidance on:
- Managing services for maximum compatibility with your workloads
- Leveraging services that are compatible with the most popular commercial and open source engines, such as MySQL, PostgreSQL, and Redis
- Using robust tools and services to make migrations simple, secure, and fast with minimal downtime
- Understanding the value of using Google Cloud’s managed database services
10179
Of your peers have already watched this video.
1:00 Minutes
The most insightful time you'll spend today!
Predict User Churn on Gaming Apps with Google Analytics Data using BigQuery ML
User retention can be a major challenge for mobile game developers. According to the Mobile Gaming Industry Analysis in 2019, most mobile games only see a 25% retention rate for users after the first day. To retain a larger percentage of users after their first use of an app, developers can take steps to motivate and incentivize certain users to return. But to do so, developers need to identify the propensity of any specific user returning after the first 24 hours.
In this blog post, we will discuss how you can use BigQuery ML to run propensity models on Google Analytics 4 data from your gaming app to determine the likelihood of specific users returning to your app.
You can also use the same end-to-end solution approach in other types of apps using Google Analytics for Firebase as well as apps and websites using Google Analytics 4. To try out the steps in this blogpost or to implement the solution for your own data, you can use this Jupyter Notebook.
Using this blog post and the accompanying Jupyter Notebook, you’ll learn how to:
- Explore the BigQuery export dataset for Google Analytics 4
- Prepare the training data using demographic and behavioural attributes
- Train propensity models using BigQuery ML
- Evaluate BigQuery ML models
- Make predictions using the BigQuery ML models
- Implement model insights in practical implementations
Google Analytics 4 (GA4) properties unify app and website measurement on a single platform and are now default in Google Analytics. Any business that wants to measure their website, app, or both, can use GA4 for a more complete view of how customers engage with their business. With the launch of Google Analytics 4, BigQuery export of Google Analytics data is now available to all users. If you are already using a Google Analytics 4 property, you can follow this guide to set up exporting your GA data to BigQuery.
Once you have set up the BigQuery export, you can explore the data in BigQuery. Google Analytics 4 uses an event-based measurement model. Each row in the data is an event with additional parameters and properties. The Schema for BigQuery Export can help you to understand the structure of the data.
In this blogpost, we use the public sample export data from an actual mobile game app called “Flood It!” (Android, iOS) to build a churn prediction model. But you can use data from your own app or website.
Here’s what the data looks like. Each row in the dataset is a unique event, which can contain nested fields for event parameters.
SELECT *FROM `firebase-public-project.analytics_153293282.events_*`TABLESAMPLE SYSTEM (1 PERCENT)

This dataset contains 5.7M events from over 15k users.
SELECTCOUNT(DISTINCT user_pseudo_id) as count_distinct_users,COUNT(event_timestamp) as count_eventsFROM`firebase-public-project.analytics_153293282.events_*

Our goal is to use BigQuery ML on the sample app dataset to predict propensity to user churn or not churn based on users’ demographics and activities within the first 24 hours of app installation.

In the following sections, we’ll cover how to:
- Pre-process the raw event data from GA4
- Identify users & the label feature
- Process demographic features
- Process behavioral features
- Train classification model using BigQuery ML
- Evaluate the model using BigQueryML
- Make predictions using BigQuery ML
- Utilize predictions for activation
Pre-process the raw event data
You cannot simply use raw event data to train a machine learning model as it would not be in the right shape and format to use as training data. So in this section, we’ll go through how to pre-process the raw data into an appropriate format to use as training data for classification models.
This is what the training data should look like for our use case at the end of this section:

Notice that in this training data, each row represents a unique user with a distinct user ID (user_pseudo_id).
Identify users & the label feature
We first filtered the dataset to remove users who were unlikely to return the app anyway. We defined these ‘bounced’ users as ones who spent less than 10 mins with the app. Then we labeled all remaining users:
- churned: No event data for the user after 24 hours of first engaging with the app.
- returned: The user has at least one event record after 24 hours of first engaging with the app.
For your use case, you can have a different definition of bounce and churning. Also you can even try to predict something else other than churning, e.g.:
- whether a user is likely to spend money on in-game currency
- likelihood of completing n-number of game levels
- likelihood of spending n amount of time in-game etc.
In such cases, label each record accordingly so that whatever you are trying to predict can be identified from the label column.
From our dataset, we found that ~41% users (5,557) bounced. However, from the remaining users (8,031), ~23% (1,883) churned after 24 hours:
SELECTbounced,churned,COUNT(churned) as count_usersFROMbqmlga4.returningusersGROUP BY 1,2ORDER BY bounced

To create these bounced and churned columns, we used the following snippet of SQL code.
...#churned = 1 if last_touch within 24 hr of app installation, else 0IF (user_last_engagement < TIMESTAMP_ADD(user_first_engagement,INTERVAL 24 HOUR),1,0 ) AS churned,#bounced = 1 if last_touch within 10 min, else 0IF (user_last_engagement <= TIMESTAMP_ADD(user_first_engagement,INTERVAL 10 MINUTE),1,0 ) AS bounced,...
You can view the Jupyter Notebook for the full query used for materializing the bounced and churned labels.
Process demographic features
Next, we added features both for demographic data and for behavioral data spanning across multiple columns. Having a combination of both demographic data and behavioral data helps to create a more predictive model.
We used the following fields for each user as demographic features:
geo.countrydevice.operating_systemdevice.language
A user might have multiple unique values in these fields — for example if a user uses the app from two different devices. To simplify, we used the values from the very first user engagement event.
CREATE OR REPLACE VIEW bqmlga4.user_demographics AS (WITH first_values AS (SELECTuser_pseudo_id,geo.country as country,device.operating_system as operating_system,device.language as language,ROW_NUMBER() OVER (PARTITION BY user_pseudo_id ORDER BY event_timestamp DESC) AS row_numFROM `firebase-public-project.analytics_153293282.events_*`WHERE event_name="user_engagement")SELECT * EXCEPT (row_num)FROM first_valuesWHERE row_num = 1 #first engagement);
Process behavioral features
There is additional demographic information present in the GA4 export dataset, e.g. app_info, device, event_params, geo etc. You may also send demographic information to Google Analytics through each hit via user_properties. Furthermore, if you have first-party data on your own system, you can join that with the GA4 export data based on user_ids.
To extract user behavior from the data, we looked into the user’s activities within the first 24 hours of first user engagement. In addition to the events automatically collected by Google Analytics, there are also the recommended events for games that can be explored to analyze user behavior. For our use case, to predict user churn, we counted the number of times the follow events were collected for a user within 24 hours of first user engagement:
user_engagementlevel_start_quickplaylevel_end_quickplaylevel_complete_quickplaylevel_reset_quickplaypost_scorespend_virtual_currencyad_rewardchallenge_a_friendcompleted_5_levelsuse_extra_steps
The following query shows how these features were calculated:
WITHevents_first24hr AS (SELECTe.*FROM`firebase-public-project.analytics_153293282.events_*` eJOINbqmlga4.returningusers rONe.user_pseudo_id = r.user_pseudo_idWHERETIMESTAMP_MICROS(e.event_timestamp) <= r.ts_24hr_after_first_engagement)SELECTuser_pseudo_id,SUM(IF(event_name = 'user_engagement', 1, 0)) AS cnt_user_engagement,# ... repeated for all behavior data ...SUM(IF(event_name = 'use_extra_steps', 1, 0)) AS cnt_use_extra_steps,FROMevents_first24hrGROUP BY1
View the notebook for the query used to aggregate and extract the behavioral data. You can use different sets of events for your use case. To view the complete list of events, use the following query:
SELECTevent_name,COUNT(event_name) as event_countFROM`firebase-public-project.analytics_153293282.events_*`GROUP BY 1ORDER BYevent_count DESC
After this we combined the features to ensure our training dataset reflects the intended structure. We had the following columns in our table:
- User ID:
user_pseudo_id
- Label:
churned
- Demographic features
countrydevice_osdevice_language
- Behavioral features
cnt_user_engagementcnt_level_start_quickplaycnt_level_end_quickplaycnt_level_complete_quickplaycnt_level_reset_quickplaycnt_post_scorecnt_spend_virtual_currencycnt_ad_rewardcnt_challenge_a_friendcnt_completed_5_levelscnt_use_extra_stepsuser_first_engagement
At this point, the dataset was ready to train the classification machine learning model in BigQuery ML. Once trained, the model will output a propensity score between churn (churned=1) or return (churned=0) indicating the probability of a user churning based on the training data.
Train classification model
When using the CREATE MODEL statement, BigQuery ML automatically splits the data between training and test. Thus the model can be evaluated immediately after training (see the documentation for more information).
For the ML model, we can choose among the following classification algorithms where each type has its own pros and cons:

Often logistic regression is used as a starting point because it is the fastest to train. The query below shows how we trained the logistic regression classification models in BigQuery ML.
CREATE OR REPLACE MODEL bqmlga4.churn_logregTRANSFORM(EXTRACT(MONTH from user_first_engagement) as month,EXTRACT(DAYOFYEAR from user_first_engagement) as julianday,EXTRACT(DAYOFWEEK from user_first_engagement) as dayofweek,EXTRACT(HOUR from user_first_engagement) as hour,* EXCEPT(user_first_engagement, user_pseudo_id))OPTIONS(MODEL_TYPE="LOGISTIC_REG",INPUT_LABEL_COLS=["churned"]) ASSELECT*FROMbqmlga4.train
We extracted month, julianday, and dayofweek from datetimes/timestamps as one simple example of additional feature preprocessing before training. Using TRANSFORM() in your CREATE MODEL query allows the model to remember the extracted values. Thus, when making predictions using the model later on, these values won’t have to be extracted again. View the notebook for the example queries to train other types of models (XGBoost, deep neural network, AutoML Tables).
Evaluate model
Once the model finished training, we ran ML.EVALUATE to generate precision, recall, accuracy and f1_score for the model:
SELECT*FROMML.EVALUATE(MODEL bqmlga4.churn_logreg)

The optional THRESHOLD parameter can be used to modify the default classification threshold of 0.5. For more information on these metrics, you can read through the definitions on precision and recall, accuracy, f1-score, log_loss and roc_auc. Comparing the resulting evaluation metrics can help to decide among multiple models.Furthermore, we used a confusion matrix to inspect how well the model predicted the labels, compared to the actual labels. The confusion matrix is created using the default threshold of 0.5, which you may want to adjust to optimize for recall, precision, or a balance (more information here).
SELECTexpected_label,_0 AS predicted_0,_1 AS predicted_1FROMML.CONFUSION_MATRIX(MODEL bqmlga4.churn_logreg)

This table can be interpreted in the following way:

Make predictions using BigQuery ML
Once the ideal model was available, we ran ML.PREDICT to make predictions. For propensity modeling, the most important output is the probability of a behavior occurring. The following query returns the probability that the user will return after 24 hrs. The higher the probability and closer it is to 1, the more likely the user is predicted to return, and the closer it is to 0, the more likely the user is predicted to churn.
SELECTuser_pseudo_id,returned,predicted_returned,predicted_returned_probs[OFFSET(0)].prob as probability_returnedFROMML.PREDICT(MODEL bqmlga4.churn_logreg,(SELECT * FROM bqmlga4.train)) #can be replaced with a proper test dataset
Utilize predictions for activation
Once the model predictions are available for your users, you can activate this insight in different ways. In our analysis, we used user_pseudo_id as the user identifier. However, ideally, your app should send back the user_id from your app to Google Analytics. In addition to using first-party data for model predictions, this will also let you join back the predictions from the model into your own data.
- You can import the model predictions back into Google Analytics as a user attribute. This can be done using the Data Import feature for Google Analytics 4. Based on the prediction values you can Create and edit audiences and also do Audience targeting. For example, an audience can be users with prediction probability between 0.4 and 0.7, to represent users who are predicted to be “on the fence” between churning and returning.
- For Firebase Apps, you can use the Import segments feature. You can tailor user experience by targeting your identified users through Firebase services such as Remote Config, Cloud Messaging, and In-App Messaging. This will involve importing the segment data from BigQuery into Firebase. After that you can send notifications to the users, configure the app for them, or follow the user journeys across devices.
- Run targeted marketing campaigns via CRMs like Salesforce, e.g. send out reminder emails.
You can find all of the code used in this blogpost in the Github repository:
What’s next?
Continuous model evaluation and re-training
As you collect more data from your users, you may want to regularly evaluate your model on fresh data and re-train the model if you notice that the model quality is decaying.
Continuous evaluation—the process of ensuring a production machine learning model is still performing well on new data—is an essential part in any ML workflow. Performing continuous evaluation can help you catch model drift, a phenomenon that occurs when the data used to train your model no longer reflects the current environment.
To learn more about how to do continuous model evaluation and re-train models, you can read the blogpost: Continuous model evaluation with BigQuery ML, Stored Procedures, and Cloud Scheduler
More resources
If you’d like to learn more about any of the topics covered in this post, check out these resources:
- BigQuery export of Google Analytics data
- BigQuery ML quickstart
- Events automatically collected by Google Analytics 4
- Qwiklabs: Create ML models with BigQuery ML
Or learn more about how you can use BigQuery ML to easily build other machine learning solutions:
- How to build demand forecasting models with BigQuery ML
- How to build a recommendation system on e-commerce data using BigQuery ML
Let us know what you thought of this post, and if you have topics you’d like to see covered in the future! You can find us on Twitter at @polonglin and @_mkazi_.Thanks to reviewers: Abhishek Kashyap, Breen Baker, David Sabater Dinter.
Groupe Dauphinoise Grows it Customer Base with G Suite and Google Cloud Platform

10396
Of your peers have already read this article.
2:45 Minutes
The most insightful time you'll spend today!
As a leading French agricultural cooperative, Groupe Dauphinoise places collaboration at the heart of its philosophy. Working with farmers in the Rhone-Alpes region, Groupe Dauphinoise takes on a diverse range of activities from agricultural production to research and development to running retail outlets.
As its operations expanded and strained its existing infrastructure, Groupe Dauphinoise saw the opportunity to upgrade its technology solutions and adopted G Suite, Chrome devices and ultimately Google Cloud Platform (GCP).
“We transitioned to G Suite to improve our staff’s collaboration. We quickly realized that as the company grew, we needed a new infrastructure. Based on our satisfaction with G Suite, we chose GCP. With Google, ‘any device, anytime, anywhere’ is not just a dream,” says Sylvain Claudel, Head of IT at Groupe Dauphinoise.
“We transitioned to G Suite to improve our staff’s collaboration. We quickly realized that as the company grew, we needed a new infrastructure. Based on our satisfaction with G Suite, we chose GCP. With Google, ‘any device, anytime, anywhere’ is not just a dream.”
—Sylvain Claudel, Head of IT, Groupe Dauphinoise
Flexible workforce, stable infrastructure
Many of Groupe Dauphinoise’s 1,500 employees spend their days out of the office. Five years ago, with the help of Google partner GoWizYou, the company transitioned to G Suite to improve the flexibility and collaboration of its staff.
As Groupe Dauphinoise began to expand and collect more data, the company reached the limits of its on-premise infrastructure. Adding new storage was not a simple matter. Acquiring, configuring and synchronising new servers costs Groupe Dauphinoise time as well as money. In addition, with all its servers stored in a single room, security was a concern. Groupe Dauphinoise needed a new infrastructure.
Google Cloud Platform was the only solution in mind after Groupe Dauphinoise’s experience with G Suite and Chromebooks. Disruption was kept to a minimum thanks to Google’s licensing agreements with Microsoft products, allowing the company to migrate without affecting its operations.
After migrating its infrastructure to Compute Engine, Groupe Dauphinoise can let Google look after the security and maintenance. Cloud IAM makes it easy for Groupe Dauphinoise to hand out permissions to sensitive resources across a number of sites with maximum security and minimum fuss. The company placed its archives in Cloud Storage, while Cloud SQL allows it to continue to make use of its MySQL databases without disrupting the day to day business. Meanwhile, BigQuery provides Groupe Dauphinoise with the raw power to analyse large datasets quickly.
“Our company is growing and we have more and more data to collect and analyze like sales data, weather patterns or production numbers. With GCP, we have more than a single on-premise data store, so our disaster recovery plan is much more flexible. Compute Engine allows us to add more storage quickly and easily, without having to spend days synchronizing data and installing new servers. We have improved security and maintained the stability of our infrastructure while keeping costs down,” says Sylvain.
Safeguarding the present, looking to the future
With Google Cloud Platform, Groupe Dauphinoise has expanded and secured its infrastructure without sinking costs into on-premise servers or DevOps staff. Its investment in Chrome devices and adoption of G Suite mean that its mobile workforce can fully reap the benefits of a cloud-based infrastructure while dramatically cutting the cost of hardware. Meanwhile, working with a 200 million line table of sales data in Google BigQuery, the cooperative found that queries ran ten times faster than with its previous database provider. Groupe Dauphinoise is experimenting with Google BigQuery to expand its BI capabilities. Products like Google BigQuery help Groupe Dauphinoise grow its business, safe in the knowledge that its infrastructure is stable and secure.
“The amount of data we collect is growing very quickly. We need to break our rules and evolve from the mindset that we had with on-premise infrastructure and our old databases. We can now look at collecting more customer fidelity data, or big data for our farmers. With our data and infrastructure in Google’s care, we can concentrate on growing our customer base instead of our IT department!” says Sylvain.
Two Ad Agencies Leverage BigQuery to Support Next-gen Ad Campaigns

4813
Of your peers have already read this article.
2:30 Minutes
The most insightful time you'll spend today!
Advertising agencies are faced with the challenge of providing the precision data that marketers require to make better decisions at a time when customers’ digital footprints are rapidly changing. They need to transform customer information and real-time data into actionable insights to inform clients what to execute to ensure the highest campaign performance.
In this post, we’ll explore how two of our advertising agency customers are turning to Google BigQuery to innovate, succeed, and meet the next generation of digital advertising head on.
Net Conversion eliminated legacy toil to reach new heights
Paid marketing and comprehensive analytics agency Net Conversion has made a name for itself with its relentless attitude and data-driven mindset. But like many agencies, Net Conversion felt limited by traditional data management and reporting practices.
A few years ago, Net Conversion was still using legacy data servers to mine and process data across the organization, and analysts relied heavily on Microsoft Excel spreadsheets to generate reports. The process was lengthy, fragmented, and slow—especially when spreadsheets exceeded the million-row limit.
To transform, Net Conversion built Conversionomics, a serverless platform that leverages BigQuery, Google Cloud’s enterprise data warehouse, to centralize all of its data and handle all of its data transformation and ETL processes. BigQuery was selected for its serverless architecture, high scalability, and integration with tools that analysts were already using daily, such as Google Ads, Google Analytics, and Data Hub. After moving to BigQuery, Net Conversion discovered surprising benefits that streamlined reporting processes beyond initial expectations. For instance, many analysts had started using Google Sheets for reports, and BigQuery’s native integration with Connected Sheets gave them the power to analyze billions of rows of data and generate visualizations right where they were already working.If you’re still sending Excel files that are larger than 1MB, you should explore Google Cloud.
Kenneth Eisinger
Manager of Paid Media Analytics at Net Conversion
Since modernizing their data analytics stack, Net Conversion has saved countless hours of time that can now be spent on taking insights to the next level. Plus, BigQuery’s advanced data analytics capabilities and robust integrations have opened up new roads to offer more dynamic insights that help clients better understand their audience.
For instance, Net Conversion recently helped a large grocery retailer launch a more targeted campaign that significantly increased downloads of their mobile application. The agency was able to better understand and predict their customers’ needs by analyzing buyer behavior across the website, mobile application, and their purchase history. Net Conversion analyzed website data in real-time with BigQuery, ran analytics on their mobile app data through the Firebase’s integration with BigQuery, and enriched these insights with sales information from the grocery retailer’s CRM to generate propensity behavior models that accurately predicted which customers would most likely install their mobile app.
WITHIN helped companies weather the COVID storm
WITHIN is a performance branding company, focused on helping brands maximize growth by fusing marketing and business goals together in a single funnel. During the COVID-19 health crisis, WITHIN became an innovator in the ad agency world by sharing real-time trends and insights with customers through its Marketing Pulse Dashboard. This dashboard was part of the company’s path to adopting BigQuery for data analytics transformation.
Prior to using BigQuery, WITHIN used a PostgreSQL database to house its data and manual reporting. Not only was the team responsible for managing and maintaining the server, which took focus away from the data analytics, but query latency issues often slowed them down.
BigQuery’s serverless architecture, blazing-fast compute, and rich ecosystem of integrations with other Google Cloud and partner solutions made it possible to rapidly query, automate reporting, and completely get rid of CSV files.
Using BigQuery, WITHIN is able to run Customer Lifetime Value (LTV) analytics and quickly share the insights with their clients in a collaborative Google Sheet. In order to improve the effectiveness of their campaigns across their marketing channels, WITHIN further segments the data into high and low LTV cohorts and shares the predictive insights with their clients for in-platform optimizations.
By distilling these types of LTV insights from BigQuery, WITHIN has been able to use those to empower their campaigns on Google Ads with a few notable success stories.
- WITHIN worked with a pet food company to analyze historical transactional data to model predicted LTV of new customers. They found significant differences between product category and autoship vs single order customers, and they implemented LTV-based optimization. As a result, they saw a 400% increase in average customer LTV.
- WITHIN helped a coffee brand increase their customer base by 560%, with the projected 12-month LTV of newly acquired customers jumping a staggering 1280%.
Through integration with Google AI Platform Notebooks, BigQuery also advanced WITHIN’s ability to use machine learning (ML) models. Today, the team can build and deploy models to predict dedicated campaign impact across channels without moving the data. The integration of clients’ LTV data through Google Ads has also impacted how WITHIN structures their clients’ accounts and how they make performance optimization decisions.
Now, WITHIN can capitalize on the entire data lifecycle: ingesting data from multiple sources into BigQuery, running data analytics, and empowering people with data by automatically visualizing data right in Google Data Studio or Google Sheets.A year ago, we delivered client reporting once a week. Now, it’s daily. Customers can view real-time campaign performance in Data Studio — all they have to do is refresh.
Evan Vaughan
Head of Data Science at WITHIN
Having a consistent nomenclature and being able to stitch together a unified code name has allowed WITHIN to scale their analytics. Today, WITHIN is able to create an internal Media Mix Modeling (MMM) tool with the help of Google Cloud that they’re trialing with their clients.
The overall unseen benefit of BigQuery was that it put WITHIN in a position to remain nimble and spot trends before other agencies when COVID-19 hit. This aggregated view of data allowed WITHIN to provide unique insights to serve their customers better and advise them on rapidly evolving conditions.
Ready to modernize your data analytics? Learn more about how Google BigQuery unlocks the insights hidden in your data.
More Relevant Stories for Your Company



An Overview of Google’s Data Cloud
Data access, management and privacy has been at the center of priorities for enterprises that are aiming to be more agile, reliable and data-driven. Google Cloud's technology innovations spanning products like BigQuery, Spanner, Looker and VertexAI help organizations navigate the complexities related to siloed data in large volumes sprawled across

Analytics Hub for Secure Data Sharing and Analytics Unlocks True Data Value and Insights
Customers tell us that sharing and exchanging data with other organizations is a critical element of their analytics strategy, but it’s hamstrung by unreliable data and processes, and only getting harder with security threats and privacy regulations on the rise. Furthermore, traditional data sharing techniques use batch data pipelines that are

Statsig’s Journey to Seamless Data Management with Google BigQuery
Statsig is a modern feature management and experimentation platform used by hundreds of organizations. Statsig's end-to-end product analytics platform simplifies and accelerates experimentation with integrated feature gates (flags), custom metrics, real-time analytics tools, and more, enabling data-driven decision-making and confident feature releases. Companies send their real-time event-stream data to Statsig’s data

Simplifying Your Database Migration With Google Cloud
For several decades, before the rise of cloud computing upended the way we think about databases and applications, Oracle and Microsoft SQL Server databases were a mainstay of business application architectures. But today, as you map out your cloud journey, you’re probably reevaluating your technology choices in light of the
