





Google Data Cloud: The Catalyst for Modern App Development and Innovation

1369
Of your peers have already read this article.
3:30 Minutes
The most insightful time you'll spend today!
97 zettabytes was the estimated volume of data generated worldwide in 20221. This sort of explosion in data volume is happening in every enterprise. Now imagine being able to access all this data you own from anywhere, at any time, analyze it, and leverage its insights to innovate your products and services? One of the biggest barriers to fulfilling this vision is the complexity inherent in dealing with data trapped across silos in an enterprise. Google Data Cloud offers a unified, open, and intelligent platform for innovation, allowing you to integrate your data on a common architectural platform. Across industries, organizations are able to reimagine their data possibilities in entirely new ways and quickly build applications that delight their customers.
Siloed data: The barrier to speed and innovation
Digital technologies ranging from transaction processing to analytics and AI/ML use data to help enterprises understand their customers better. And the pace of innovation has naturally accelerated as organizations learn, adapt, and race to build the next generation of applications and services to compete for customers and meet their needs. At Next 2022, we made a prediction that the barriers between transactional and analytical workloads will mostly disappear.
Traditionally, data architectures have separated transactional and analytical systems—and that’s for good reason. Transactional databases are optimized for fast reads and writes, and analytical databases are optimized for analyzing and aggregating large data sets. This has siloed enterprise data systems, leaving many IT teams struggling to piece together solutions. The result has been time consuming, expensive, and complicated fixes to support intelligent, data-driven applications.
But, with the introduction of new technologies, a more time-efficient and cost-effective approach is possible. Customers now expect to see personalized recommendations and tailored experiences from their applications. With hybrid systems that support both transactional and analytical processing on the same data, without impacting performance, these systems now work together to generate timely, actionable insights that can be used to create better experiences and accelerate business outcomes.
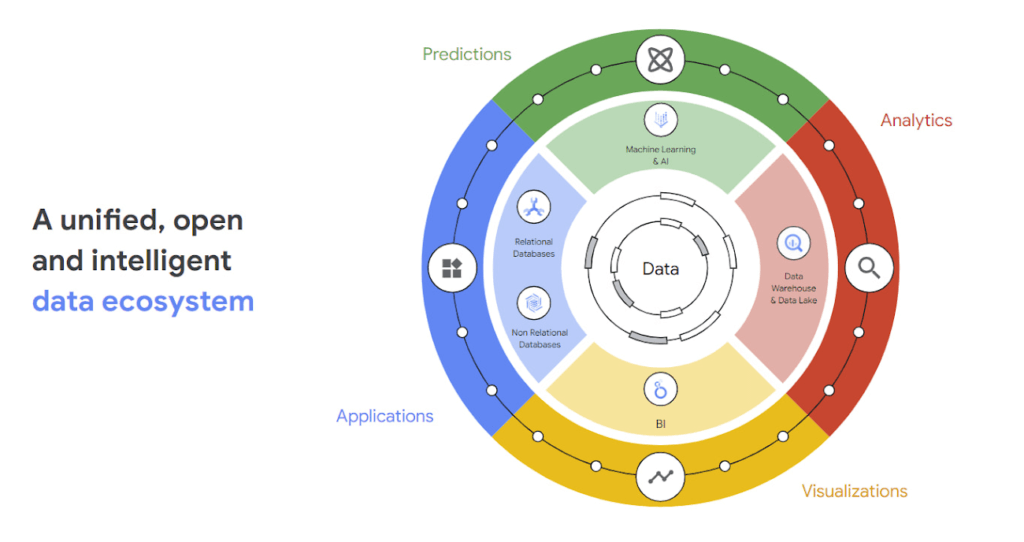
According to a 2022 research paper from IDC, unifying data across silos via a data cloud is the foundational capability enterprises need to gain new insights on rapidly changing conditions and to enable operational intelligence. The modern data cloud provides unified, connected, scalable, secure, extensible, and open data, analytics, and AI/ML services. In this platform, everything is connected to everything else.
Why reducing data barriers delivers more value
The primary benefit of a unified data cloud is that it provides an intuitive and timely way to represent data and allows easy access to related data points. By unifying their data, enterprises are able to:
- Ingest data faster – for operational intelligence
- Unify data across silos – for new insights
- Share data with partners – for collaborative problem solving
- Change forecasting models – to understand and prepare for shifting markets
- Iterate with decision-making scenarios – to ensure agile responses
- Train models on historical data – to build smarter applications
As generative AI applications akin to Bard, an early experiment by Google, become available in the workplace, it will be more important than ever for organizations to have a unified data landscape to holistically train and validate their proprietary large language models.
With these benefits enterprises can accelerate their digital transformation in order to thrive in our increasingly complex digital environment. A survey of more than 800 IT leaders indicated that using a data cloud enabled them to significantly improve employee productivity, operational efficiency, innovation, and customer experience, among others.
Build modern apps with a unified and integrated data cloud
Google Cloud technologies and capabilities reduce the friction between transactional and analytical workloads and make it easier for developers to build applications, and to glean real-time insights. Here are a few examples.
- AlloyDB for PostgreSQL, a fully managed PostgreSQL-compatible database, and AlloyDB Omni, the recently launched downloadable edition of AlloyDB, can analyze transactional data in real time. AlloyDB is more than four times faster for transactional workloads and up to a 100 times faster for analytical queries compared to standard PostgreSQL, according to our performance tests. This kind of performance makes AlloyDB the ideal database for hybrid transactional and analytical processing (HTAP) workloads.
- Datastream for BigQuery, a serverless change data capture and replication service, provides simple and easy real time data replication from transactional databases like AlloyDB, PostgreSQL, MySQL and Oracle directly into BigQuery, Google Cloud’s enterprise data warehouse.
- And, query federation with Cloud Spanner, Cloud SQL, and Cloud Bigtable, make data available right from the BigQuery console allowing customers to analyze data in real-time in transactional databases.
Speed up deployments and lower costs
By reducing data barriers, we’re taking a fundamentally different approach that allows organizations to be more innovative, efficient, and customer-focused by providing:
- Built-in industry leading AI and ML that helps organizations not only build improved insights, but also automate core business processes and enable deep ML-driven product innovation.
- Best-in-class flexibility. Integration with open source standards and APIs ensures portability and extensibility to prevent lock-in. Plus, choice of deployment options means easy interoperability with existing solutions and investments.
- The most unified data platform with the ability to manage every stage of the data lifecycle, from running operational databases to managing analytics applications across data warehouses and lakes to rich data-driven experiences.
- Fully managed database services that free up DBA/DevOps time to focus on high-value work that is more profitable to the business. Organizations that switch from self-managed databases eliminate manual work, realize significant cost savings, reduce risk from security breaches and downtime and increase productivity and innovation. In an IDC survey, for example, Cloud SQL customers achieve an average three-year ROI of 246% because of the value and efficiencies this fully managed service delivers.
Google Data Cloud improves the efficiency and productivity of your teams, resulting in increased innovation across your organization. This is the unified, open approach to data-driven transformation bringing unmatched speed, scale, security, and with AI built in.
In case you missed it: Check out our Data Cloud and AI Summit that happened on March 29th, to learn more about the latest innovations across databases, data analytics, BI and AI. In addition, learn more about the value of managed database services like Cloud SQL in this IDC study.
A Breakdown of Cloud-based Data Ingestion Practices

8800
Of your peers have already read this article.
3:00 Minutes
The most insightful time you'll spend today!
Businesses around the globe are realizing the benefits of replacing legacy data silos with cloud-based enterprise data warehouses, including easier collaboration across business units and access to insights within their data that were previously unseen. However, bringing data from numerous disparate data sources into a single data warehouse requires you to develop pipelines that ingest data from these various sources into your enterprise data warehouse. Historically, this has meant that data engineering teams across the organization procure and implement various tools to do so. But this adds significant complexity to managing and maintaining all these pipelines and makes it much harder to effectively scale these efforts across the organization. Developing enterprise-grade, cloud-native pipelines to bring data into your data warehouse can alleviate many of these challenges. But, if done incorrectly, these pipelines can present new challenges that your teams will have to spend their time and energy addressing.
Developing cloud-based data ingestion pipelines that replicate data from various sources into your cloud data warehouse can be a massive undertaking that requires significant investment of staffing resources. Such a large project can seem overwhelming and it can be difficult to identify where to begin planning such a project. We have defined the following principles for data pipeline planning to begin the process. These principles are intended to help you answer key business questions about your effort and begin to build data pipelines that address your business and technical needs. Each section below details a principle of data pipelines and certain factors your teams should consider as they begin developing their pipelines.
Principle 1: Clarify your objectives
The first principle to consider for pipeline development is clarify your objectives. This can be broadly defined as taking a holistic approach to pipeline development that encompasses requirements from several perspectives: technical teams, regulatory or policy requirements, desired outcomes, business goals, key timelines, available teams and their skill sets, and downstream data users. Clarifying your objectives clearly identifies and defines requirements from each key stakeholder at the beginning of the process and continually checks development against these requirements to ensure the pipelines built will meet these requirements.This is done by first clearly defining the desired end state for each project in a way that addresses a demonstrated business need of downstream data users. Remember that data pipelines are almost always the means to accomplish your end state, rather than the end state itself. An example of an effectively defined end-state is “enabling teams to gain a better understanding of our customers by providing access to our CRM data within our cloud data warehouse” rather than “move data from our CRM to our cloud data warehouse”. This may seem like a merely semantic difference, but framing the problem in terms of business needs helps your teams make technical decisions that will best meet these needs.
After clearly defining the business problem you are trying to solve, you should facilitate requirement gathering from each stakeholder and use these requirements to guide the technical development and implementation of your ingestion pipelines. We recommend gathering stakeholders from each team, including downstream data users, prior to development to gather requirements for the technical implementation of the data pipeline. These will include critical timelines, uptime requirements, data update frequency, data transformation, DevOps needs, and security, policy, or regulatory requirements by which a data pipeline must meet.
Principle 2: Build your team
The second principle to consider for pipeline development is build your team. This means ensuring you have the right people with the right skills available in the right places to develop, deploy, and maintain your data pipelines. After you have gathered your pipeline requirements, you can begin to develop a summary architecture that will be used to build and deploy your data pipelines. This will help you identify the human talent you will need to successfully build, deploy, and manage these data pipelines and identify any potential shortfalls that would require additional support from either third-party partners or new team members.
Not only do you need to ensure you have the right people and skill sets available in aggregate, but these individuals need to be effectively structured to empower them to maximize their abilities. This means developing team structures that are optimized for each team’s responsibilities and their ability to support adjacent teams as needed.
This also means developing processes that prevent blockers to technical development whenever possible, such as ensuring that teams have all of the appropriate permissions they need to move data from the original source to your cloud data warehouse without violating the concept of least privilege. Developers need access to the original data source (depending on your requirements and architecture) in addition to the destination data warehouse. Examples of this are ensuring that developers have access to develop and/or connect to a Salesforce Connected App or read access to specific Search Ads 360 data fields.
Principle 3: Minimize time to value
The third principle to consider for pipeline development is minimize time to value. This means considering the long-term maintenance burden of a data pipeline prior to developing and deploying it in addition to being able to deploy a minimum viable pipeline as quickly as possible. Generally speaking, we recommend the following approach to building data pipelines to minimize their maintenance burden: Write as little code as possible. Functionally, this can be implemented by:
1. Leveraging interface-based data ingestion products whenever possible. These products minimize the amount of code that requires ongoing maintenance and empower users who aren’t software developers to build data pipelines. They can also reduce development time for data pipelines, allowing them to be deployed and updated more quickly.
- Products like Google Data Transfer Service and Fivetran allow for managed data ingestion pipelines by any user to centralize data from SaaS applications, databases, file systems, and other tooling. With little to no code required, these managed services enable you to connect your data warehouse to your sources quickly and easily.
- For workloads managed by ETL developers and data engineers, tools like Google Cloud’s Data Fusion provide an easy-to-use visual interface for designing, managing and monitoring advanced pipelines with complex transformations.
2. Whenever interface-based products or data connectors are insufficient, use pre-existing code templates. Examples of this include templates available for Dataflow that allow users to define variables and run pipelines for common data ingestion use cases, and the Public Datasets pipeline architecture that our Datasets team uses for onboarding.
3. If neither of these options are sufficient, utilize managed services to deploy code for your pipelines. Managed services, such as Dataflow or Dataproc, eliminate the operational overhead of managing pipeline configuration by automatically scaling pipeline instances within predefined parameters.
Principle 4: Increase data trust and transparency
The fourth principle to consider for pipeline development is increase data trust and transparency. For the purposes of this document, we define this as the process of overseeing and managing data pipelines across all tools. Numerous data ingestion pipelines that each leverage different tools or are not developed under a coordinated management plan can result in “tech sprawl”, which significantly increases the management overhead of data ingestion pipelines as the quantity of data pipelines increases. This becomes especially cumbersome if you are subject to service-level agreements, or legal, regulatory, or policy requirements for overseeing data pipelines. Preventing tech sprawl is, by far, the best strategy for dealing with it by developing streamlined pipeline management processes that automate reporting. Although this can theoretically be achieved by building all of your data pipelines using a single cloud-based product, we do not recommend doing so because it prevents you from taking advantage of features and cost optimizations that come with choosing the best product for your use case.
A monitoring service such as Google Cloud Monitoring Service or Splunk that automates metrics, events, and metadata collection from various products, including those hosted in on-premise and hybrid computing environments, can help you centralize reporting and monitoring of your data pipelines. A metadata management tool such as Google Cloud’s Data Catalog or Informatica’s Enterprise Data Catalog can help you better communicate the nuances of your data so users better understand which data resources are best fit for a given use case. This significantly reduces your pipeline’s governance burden by eliminating manual reporting processes that often result in inaccuracies or lagging updates.
Principle 5: Manage costs
The fifth principle to consider for pipeline development is manage costs. This encompasses both the cost of cloud resources and the staffing costs necessary to design, develop, deploy, and maintain your cloud resources. We believe that your goal should not necessarily be to minimize cost, but rather maximizing the value of your investment. This means maximizing the impact of every dollar spent by minimizing waste in cloud resource utilization and human time. There are several factors to consider when it comes to managing costs:
- Use the right tool for the job – Different data ingestion pipelines will have different requirements for latency, uptime, transformations, etc. Similarly, different data pipeline tools have different strengths and weaknesses. Choosing the right tool for each data pipeline can help your pipelines operate significantly more efficiently. This can reduce your overall cost, free up staffing time to focus on the most impactful projects, and make your pipelines much more efficient.
- Standardize resource labeling – Implement and utilize a consistent labeling schema across all tools and platforms to have the most comprehensive view of your organization’s spending. One example is requiring all resources to be labeled by the cost center or team at time of creation. Consistent labeling allows you to monitor your spend across different teams and calculate the overall value of your cloud spending.
- Implement cost controls – If available, leverage cost controls to prevent errors that result in unexpectedly large bills.
- Capture cloud spend – Capture your spend on all cloud resource utilization for internal analysis using a cloud data warehouse and a data visualization tool. Without it, you won’t understand the context of changes in cloud spend and how they correlate with changes in business.
- Make cost management everyone’s job – Managing costs should be part of the responsibilities of everyone who can create or utilize cloud resources. To do this well, we recommend making cloud spend reporting more transparent internally and/or implementing chargebacks to internal cost centers based on utilization.
Long-term, the increased granularity in cost reporting available within Google Cloud can help you better measure your key performance indicators. You can shift from cost-based reporting (i.e. – “We spent $X on BigQuery storage last month”) to value-based reporting (i.e. – “It costs $X to serve customers who bring in $Y revenue”).
To learn more about managing costs, check out Google Cloud’s “Understanding the principles of cost optimization” white paper.
Principle 6: Leverage continually improving services
The sixth principle is leverage continually improving services. Cloud services are consistently improving their performance and stability, even if some of these improvements are not obvious to users. These improvements can help your pipelines run faster, cheaper, and more consistently over time. You can take advantage of the benefits of these improvements by:
- Automating both your pipelines and pipeline management: Not only should data pipelines be automated, but almost all aspects of managing your pipelines can also be automated. This includes pipeline/data lineage tracking, monitoring, cost management, scheduling, access management and more. This helps reduce long-term operational costs of each data pipeline that can significantly alter your value proposition and prevent any manual configurations from negating the benefits of later product improvements.
- Minimizing pipeline complexity whenever possible: While ingestion pipelines are relatively easy to develop using UI-based or managed services, they also require continued maintenance as long as they are in use. The most easily maintained data ingestion pipelines are typically the ones that minimize complexity and leverage automatic optimization capabilities. Any transformation in a data ingestion pipeline is a manual optimization of the pipeline that may struggle to adapt or scale as the underlying services improve. You can minimize the need for such transformations by building ELT (extract, load, transform) pipelines rather than ETL (extract, transform, load) pipelines. This pushes transformations down to the data warehouse that is use a specifically optimized query engine to transform your data rather than manually configured pipelines.
Next steps
If you’re looking for more information about developing your cloud-based data platform, check out our Build a modern, unified analytics data platform whitepaper. You can also visit our data integration site to learn more and find ways to get started with your data integration journey.
Once you’re ready to begin building your data ingestion pipelines, learn more about how Cloud Data Fusion and Fivetran can help you make sure your pipelines address these principles.
Datashare for Financial Services: Securing the Publishers and Consumers’ Access to Market Data

8549
Of your peers have already read this article.
4:30 Minutes
The most insightful time you'll spend today!
Access to the cloud has advanced the distribution and consumption of financial information on a global scale. In parallel, the global financial data landscape has been transformed by an influx of alternative data sources, including social media, meteorological data, satellite imagery, and other data. Exchanges and market data providers now find they need to include these new datasets to enrich their products and compete, which has meant they now must consider cloud-based models to keep up with the demands of their customers who expect easy, quick, flexible and cost-efficient ways to consume market data.
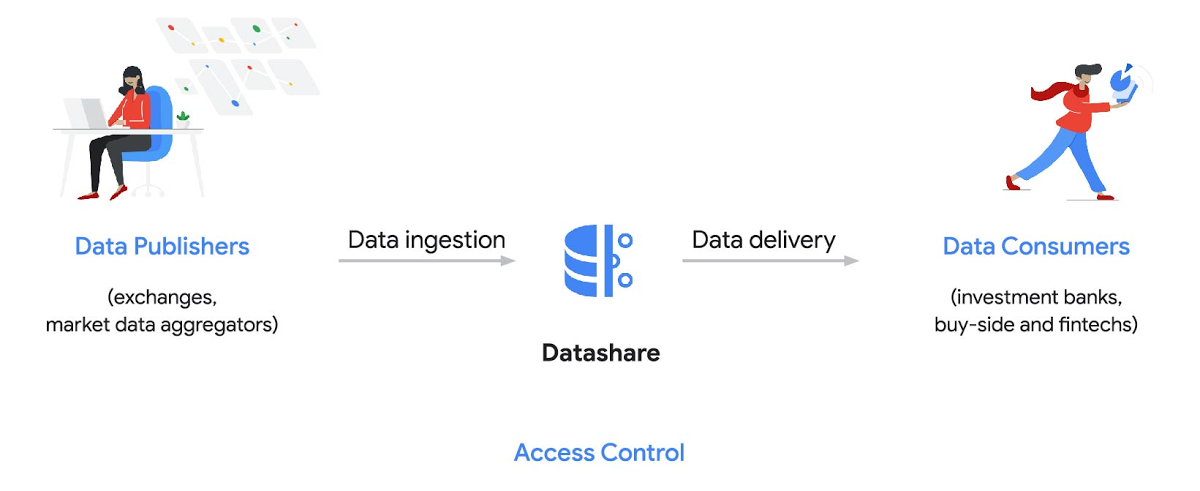
To address these needs, today we’re announcing the general availability of Datashare for financial services, a new Google Cloud solution that brings together the entire capital markets ecosystem—data publishers, and data consumers—to exchange market data securely and easily.
Datashare helps organize third-party financial information, making it accessible and useful to market data publishers and data consumers. We open-sourced the entire Datashare solution so market data publishers can now onboard their licensed datasets to Google Cloud securely, quickly and easily, while data consumers can consume that data as a service in tools of their preference, such as BigQuery.
Three ways to distribute and consume your data
Batch data delivery
Datashare provides a batch data delivery mechanism for data publishers to deliver their reference data, historical tick data, alternative market data sources and more via BigQuery, reducing the administrative burden on data consumers to extract insights from data.
Real-time data streaming delivery
By using this event-based data delivery channel for rapidly changing instrument prices, tick data, orders, news and others via Pub/Sub, data consumers can reliably process individual messages or rewind to a point in time to replay a prior market scenario and test model changes.
Monetizing licensed datasets
Market data publishers can onboard their licensed datasets to Google Cloud and make them available via a one-stop-shop on Google Cloud Marketplace, enabling a new sales channel to expand market reach.
Reference architecture
Check out the diagram below to see how you can share your batch and real-time data directly to your Google Cloud customers with BigQuery and Pub/Sub.

As you can see in the above reference architecture, both publishers and consumers can derive several benefits from the solution:
Benefits for data publishers
- You no longer have to maintain your own delivery and licensing infrastructure.
- You can easily package and deliver granular data products and experiments with SQL.
- You can have a solution that scales with your business as data volumes and number of customers grow.
Benefits for data consumers
- Your data is ready for analysis and machine learning (ML)— you no longer have to maintain extract, transform, and load (ETL) pipelines to load files and transform data.
- You can avoid the expense and burden of maintaining multiple copies of large data files.
- You can be more targeted with consumption of data using BigQuery queries, improving performance, and compliance, and reducing cost.
Accessing the datasets
Google Cloud has been working with multiple industry firms on innovating in the market data space. By using Datashare for publishing, data publishers can make their entire datasets available on Google Cloud. Early adopters of Datashare include firms such as OneTick and Accern. OneTick’s datasets include reference and historical futures data (that can be accessed in our console with your login). Accern’s datasets include alternative data such as market sentiment and credit analysis data (that can be accessed in our console with your login).
To make it more helpful, we partnered with Accern to create a hypothetical scenario to describe the data acquisition and analytics process step-by-step.
Accern use case
As a sustainability analyst, you require an economic, social and governance (ESG) dataset to determine which sector is the most widely covered ESG sector by analysts, and to also identify the sector with the lowest ESG sentiment score. Now, you can discover and acquire an ESG dataset in Google Cloud.
Step 1. Navigate to the Financial Services solutions page in the Google Cloud console:

Step 2. Click a dataset, for example Accern AI-Generated ESG Insights, then review the overview details, plans and pricing, documentation and support information. To view the available pricing tiers, click ‘View All Plans’. Once you’ve decided on a tier that you would like to subscribe to, click ‘Select’, choose a billing account and review and accept the terms of service to complete the subscription. Once the steps are complete, click ‘Subscribe’ at the bottom. An overlay window will appear, click ‘Register with Accern’ to activate and complete the subscription.
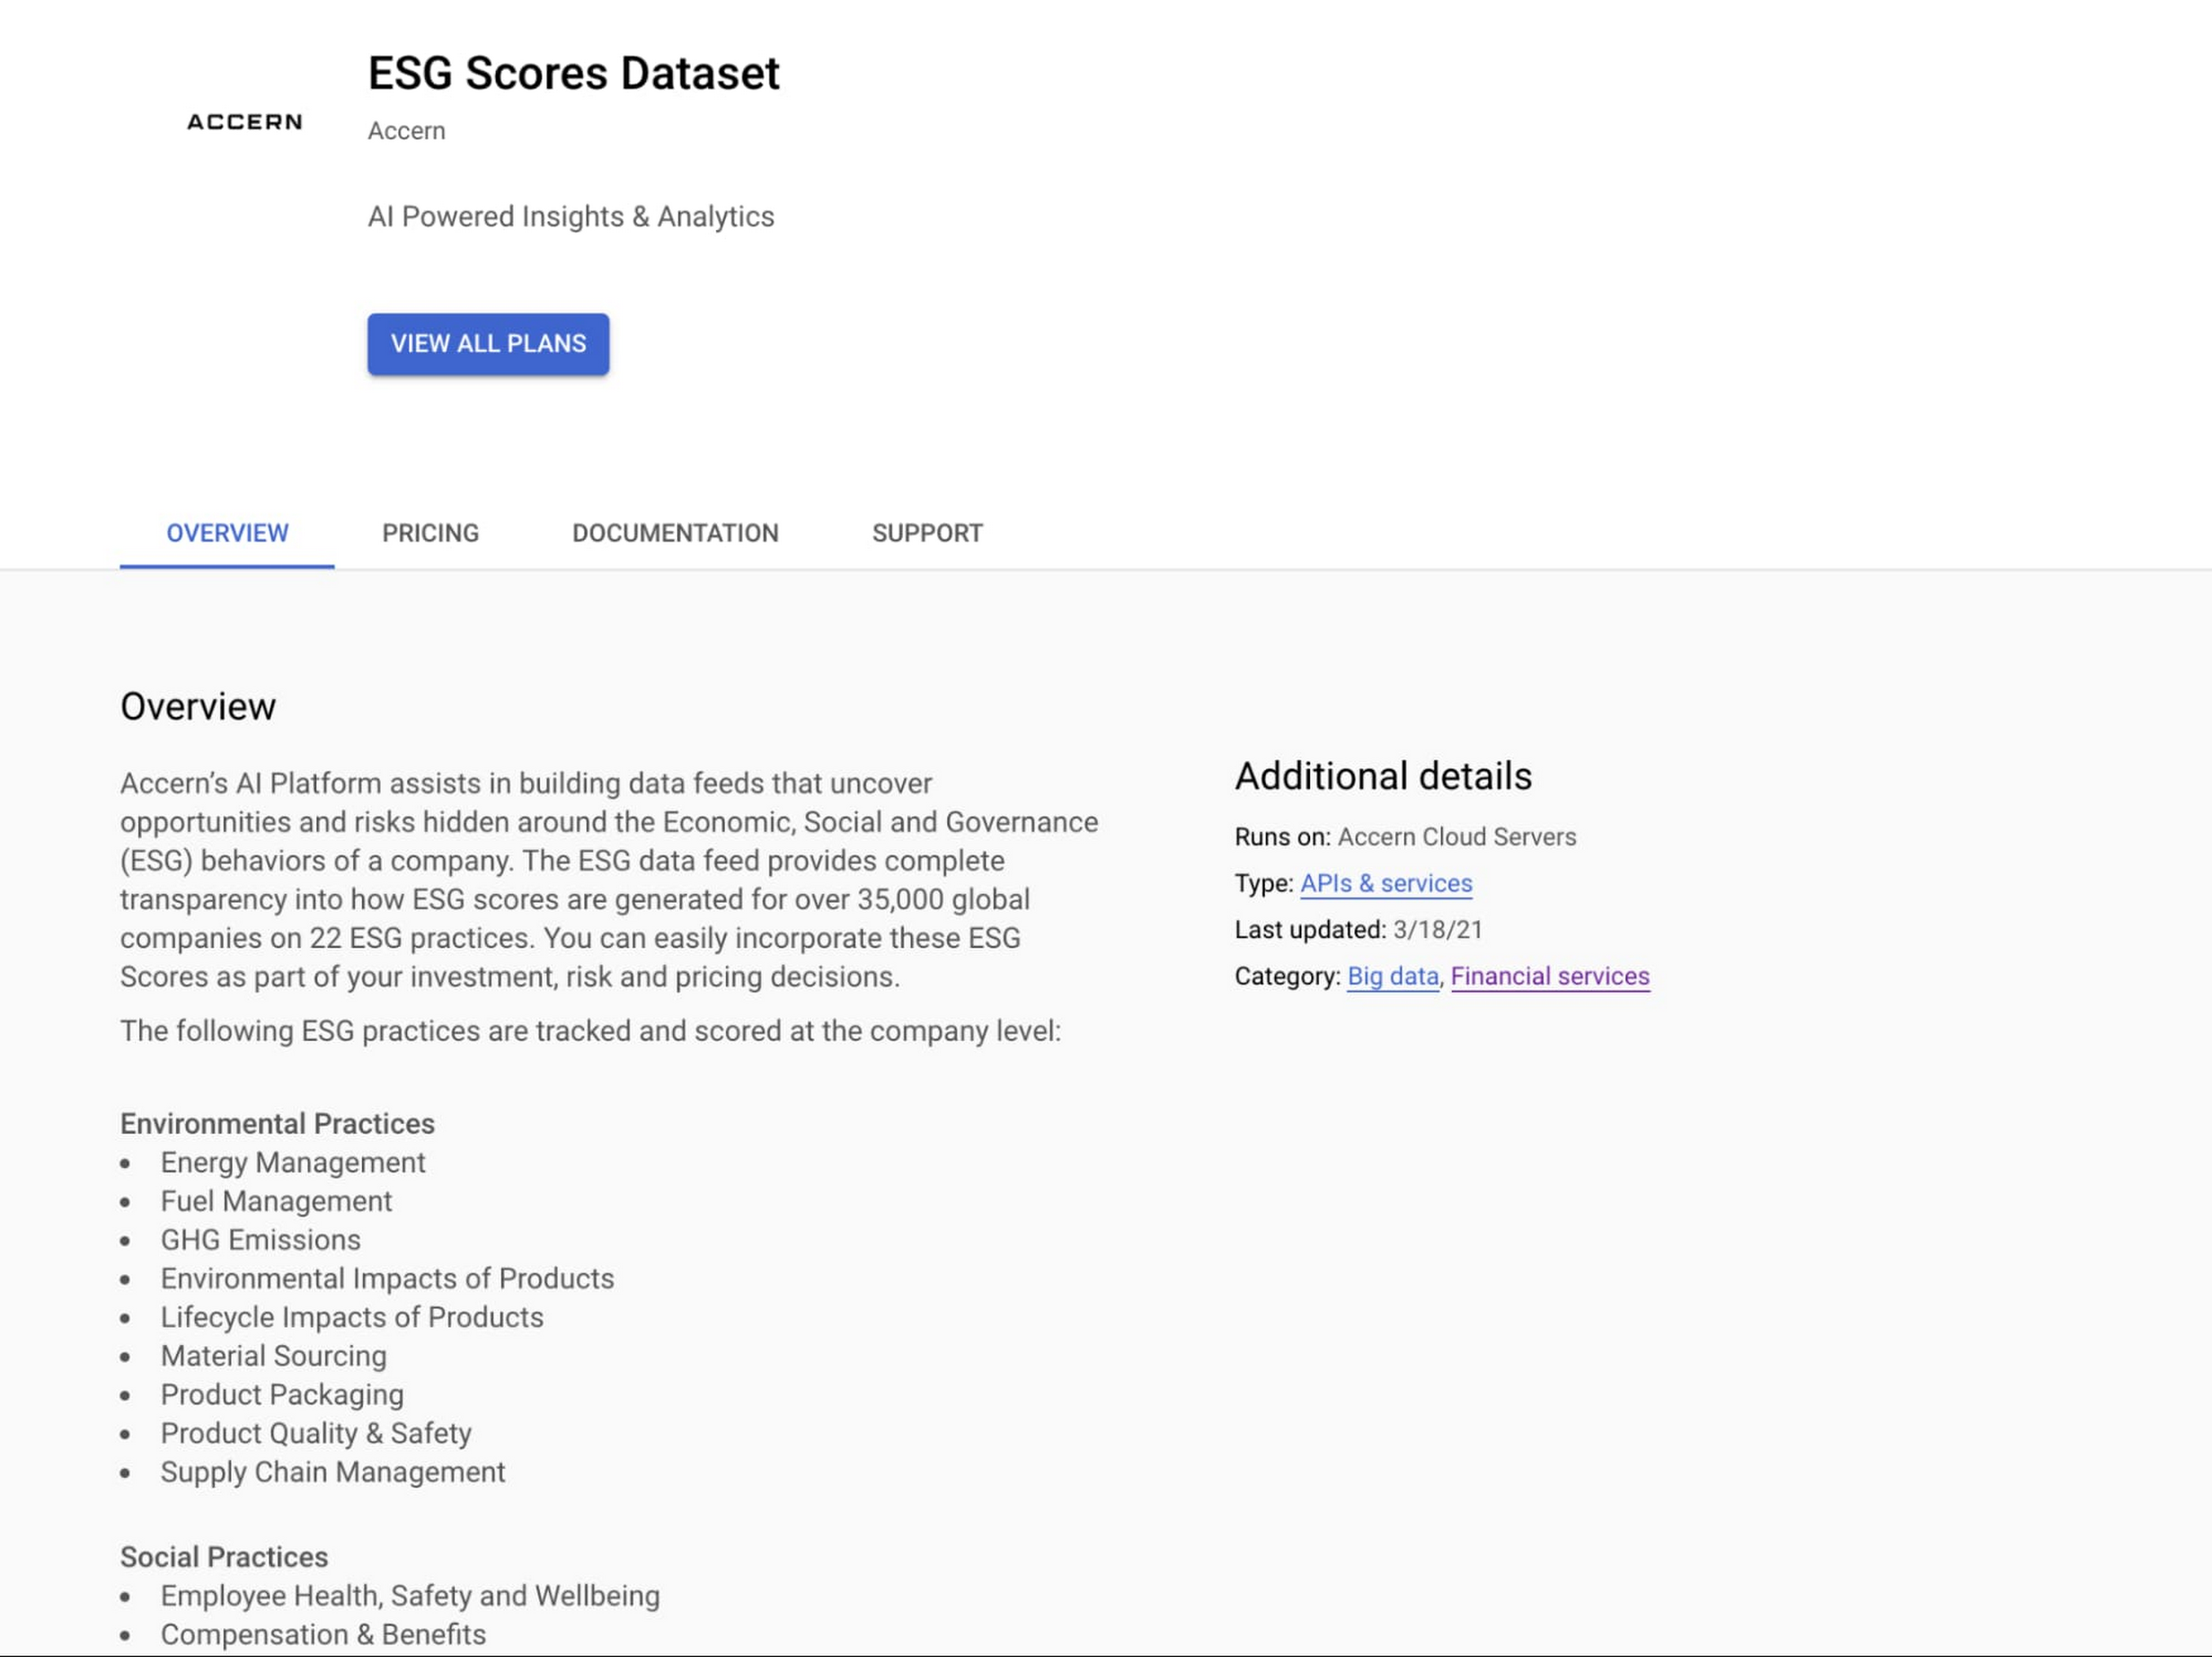

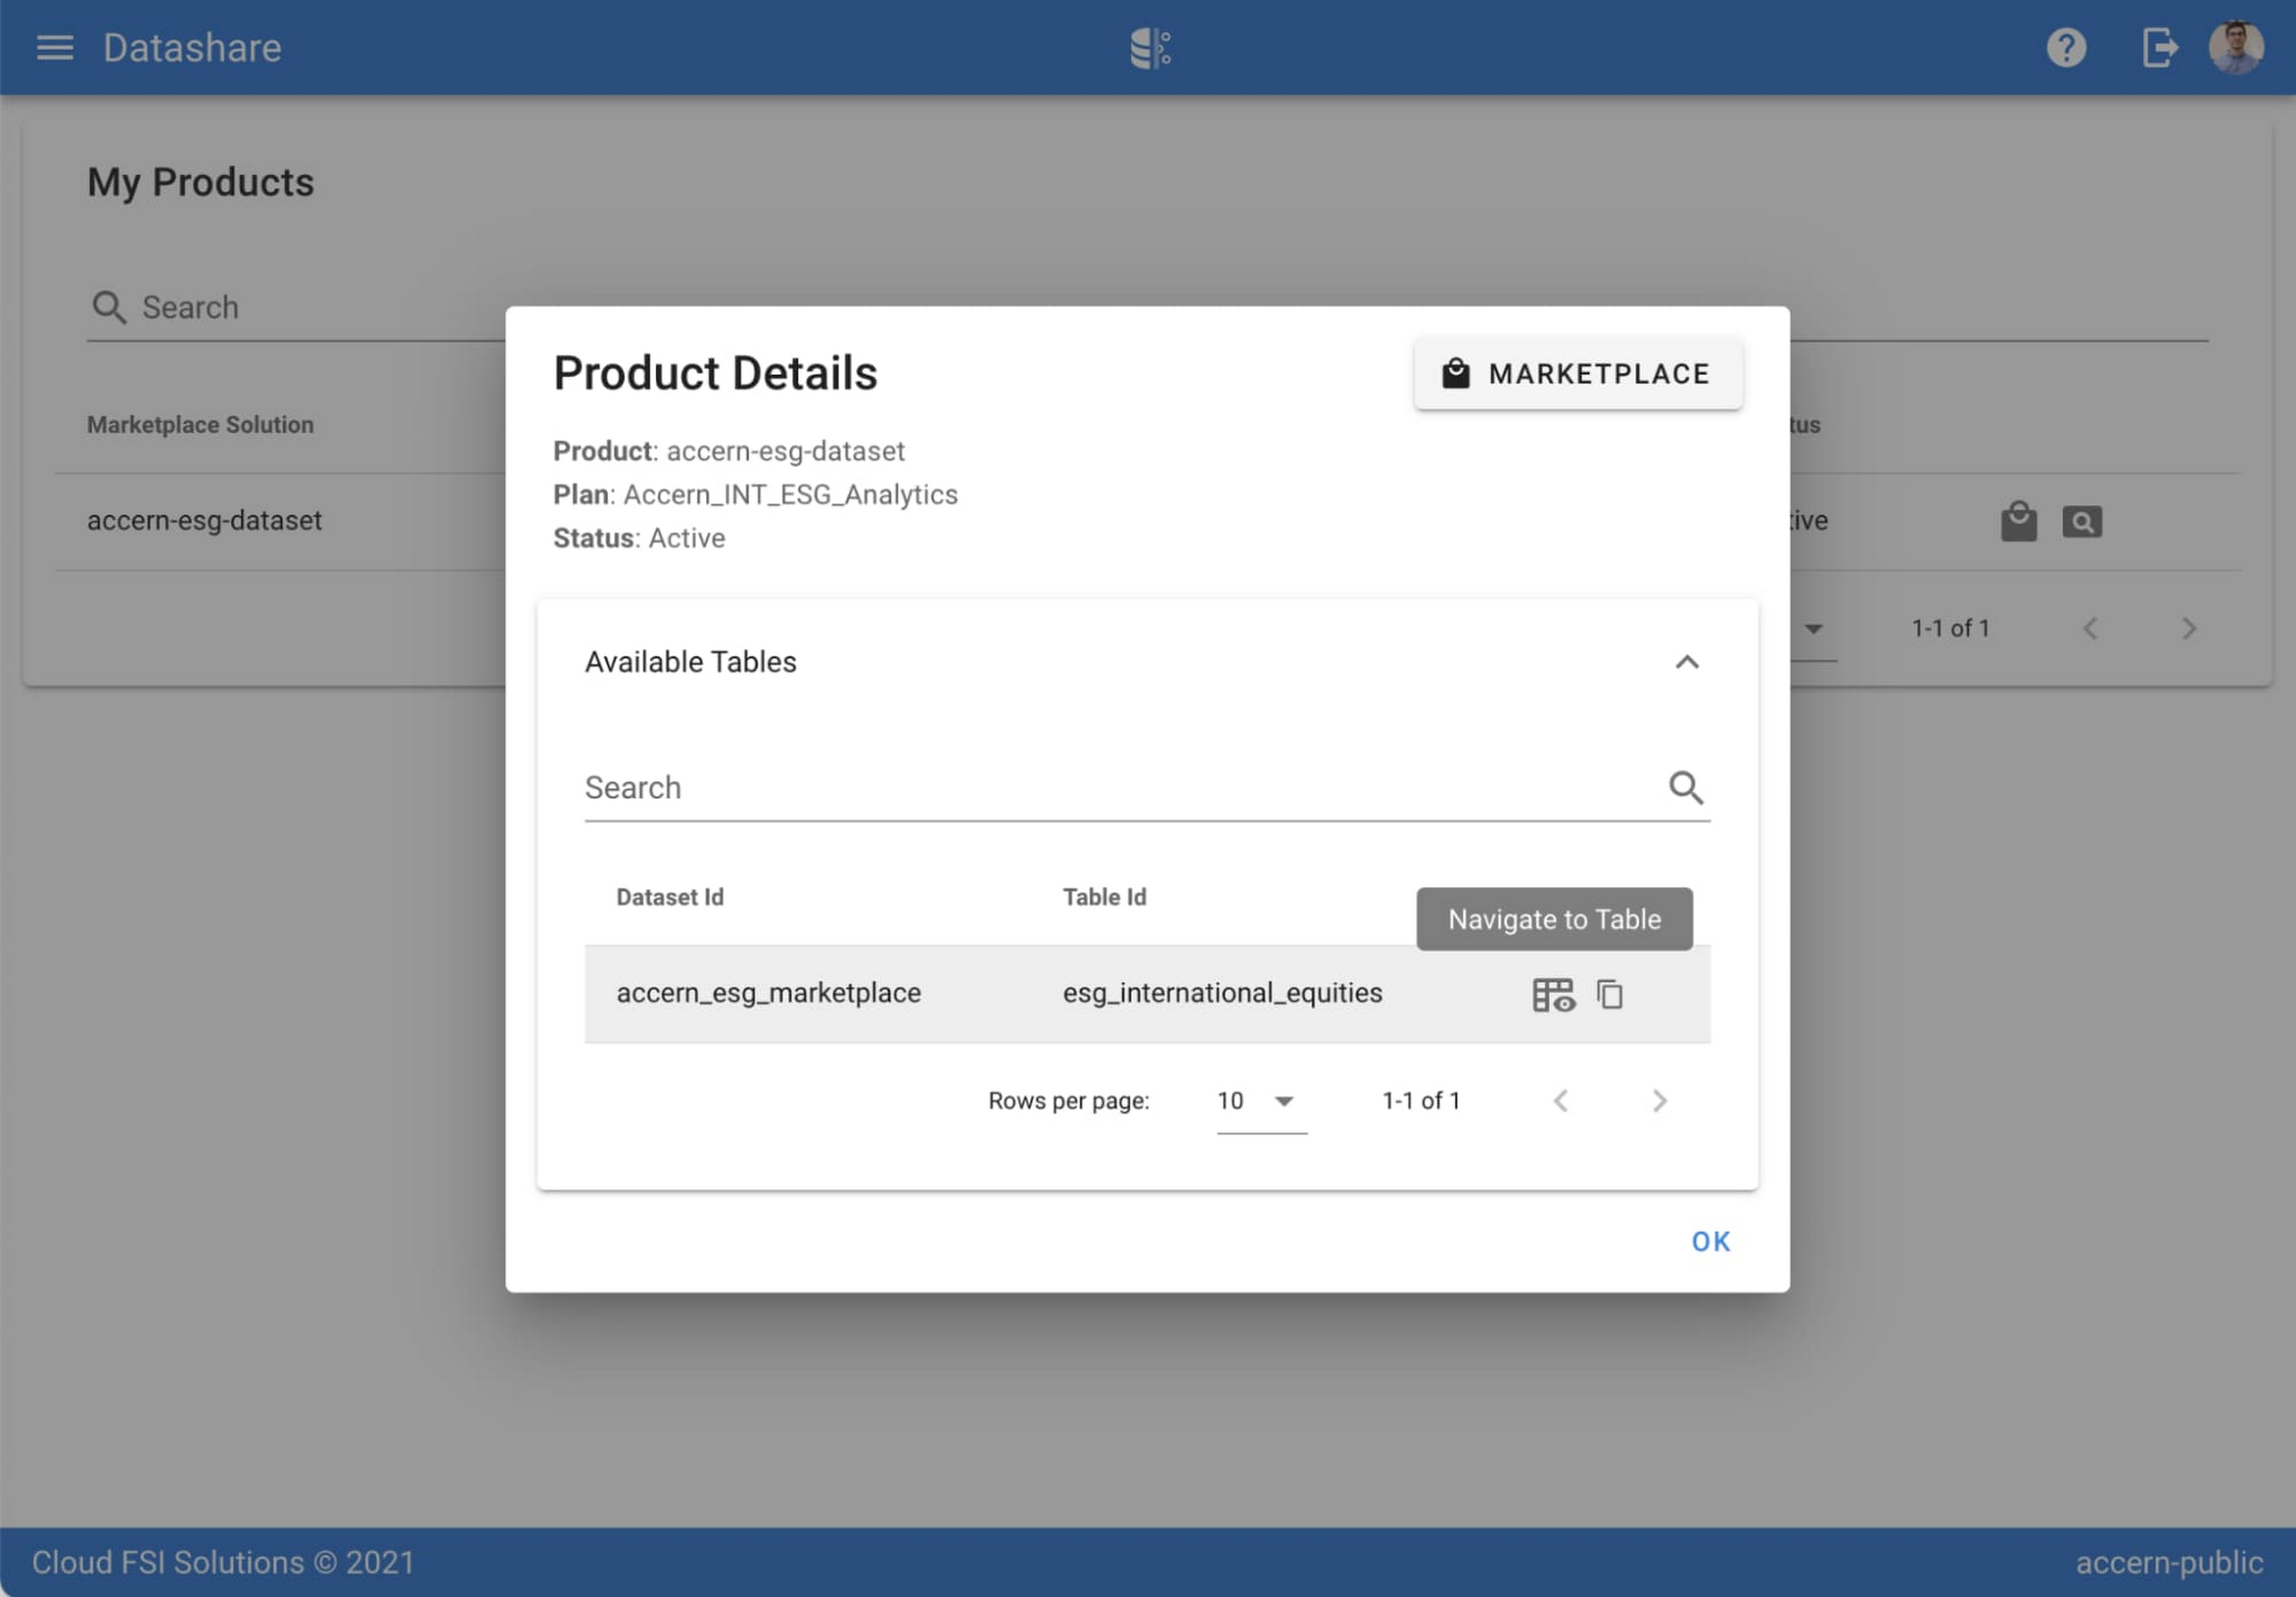
Step 3. Once activation is complete, you’ll be directed to the Datashare ‘My Products’ screen. Voila! You are now subscribed to Accern’s ESG Scores dataset and can access it in your Google Cloud instance using BigQuery. To access the data, click the hour glass icon on the corresponding ‘My Products’ record that you just purchased. An overlay will present you with the details on the dataset and/or table. Click the ‘Navigate to Table’ button to navigate through to the BigQuery console.


Step 4. Now that you have access and are in the BigQuery console, it’s time to generate data insights.
For this example, we’ve eliminated the company identifying information that is included as part of the subscription and aggregated company ESG in a view where each row represents a day, an industry sector, a specific identified ‘ESG Issues’ (event_group and event) and the respective ‘ESG Sentiment’ per issue.

For example, row 1 indicates that within the ‘Healthcare’ sector, there was a ‘Social – Civil Society’ issue identified and it had a negative ESG sentiment score of -15.35.
Step 5. Generate a report by exporting it to Data Studio to build visualizations and conduct additional analysis on the ESG data.
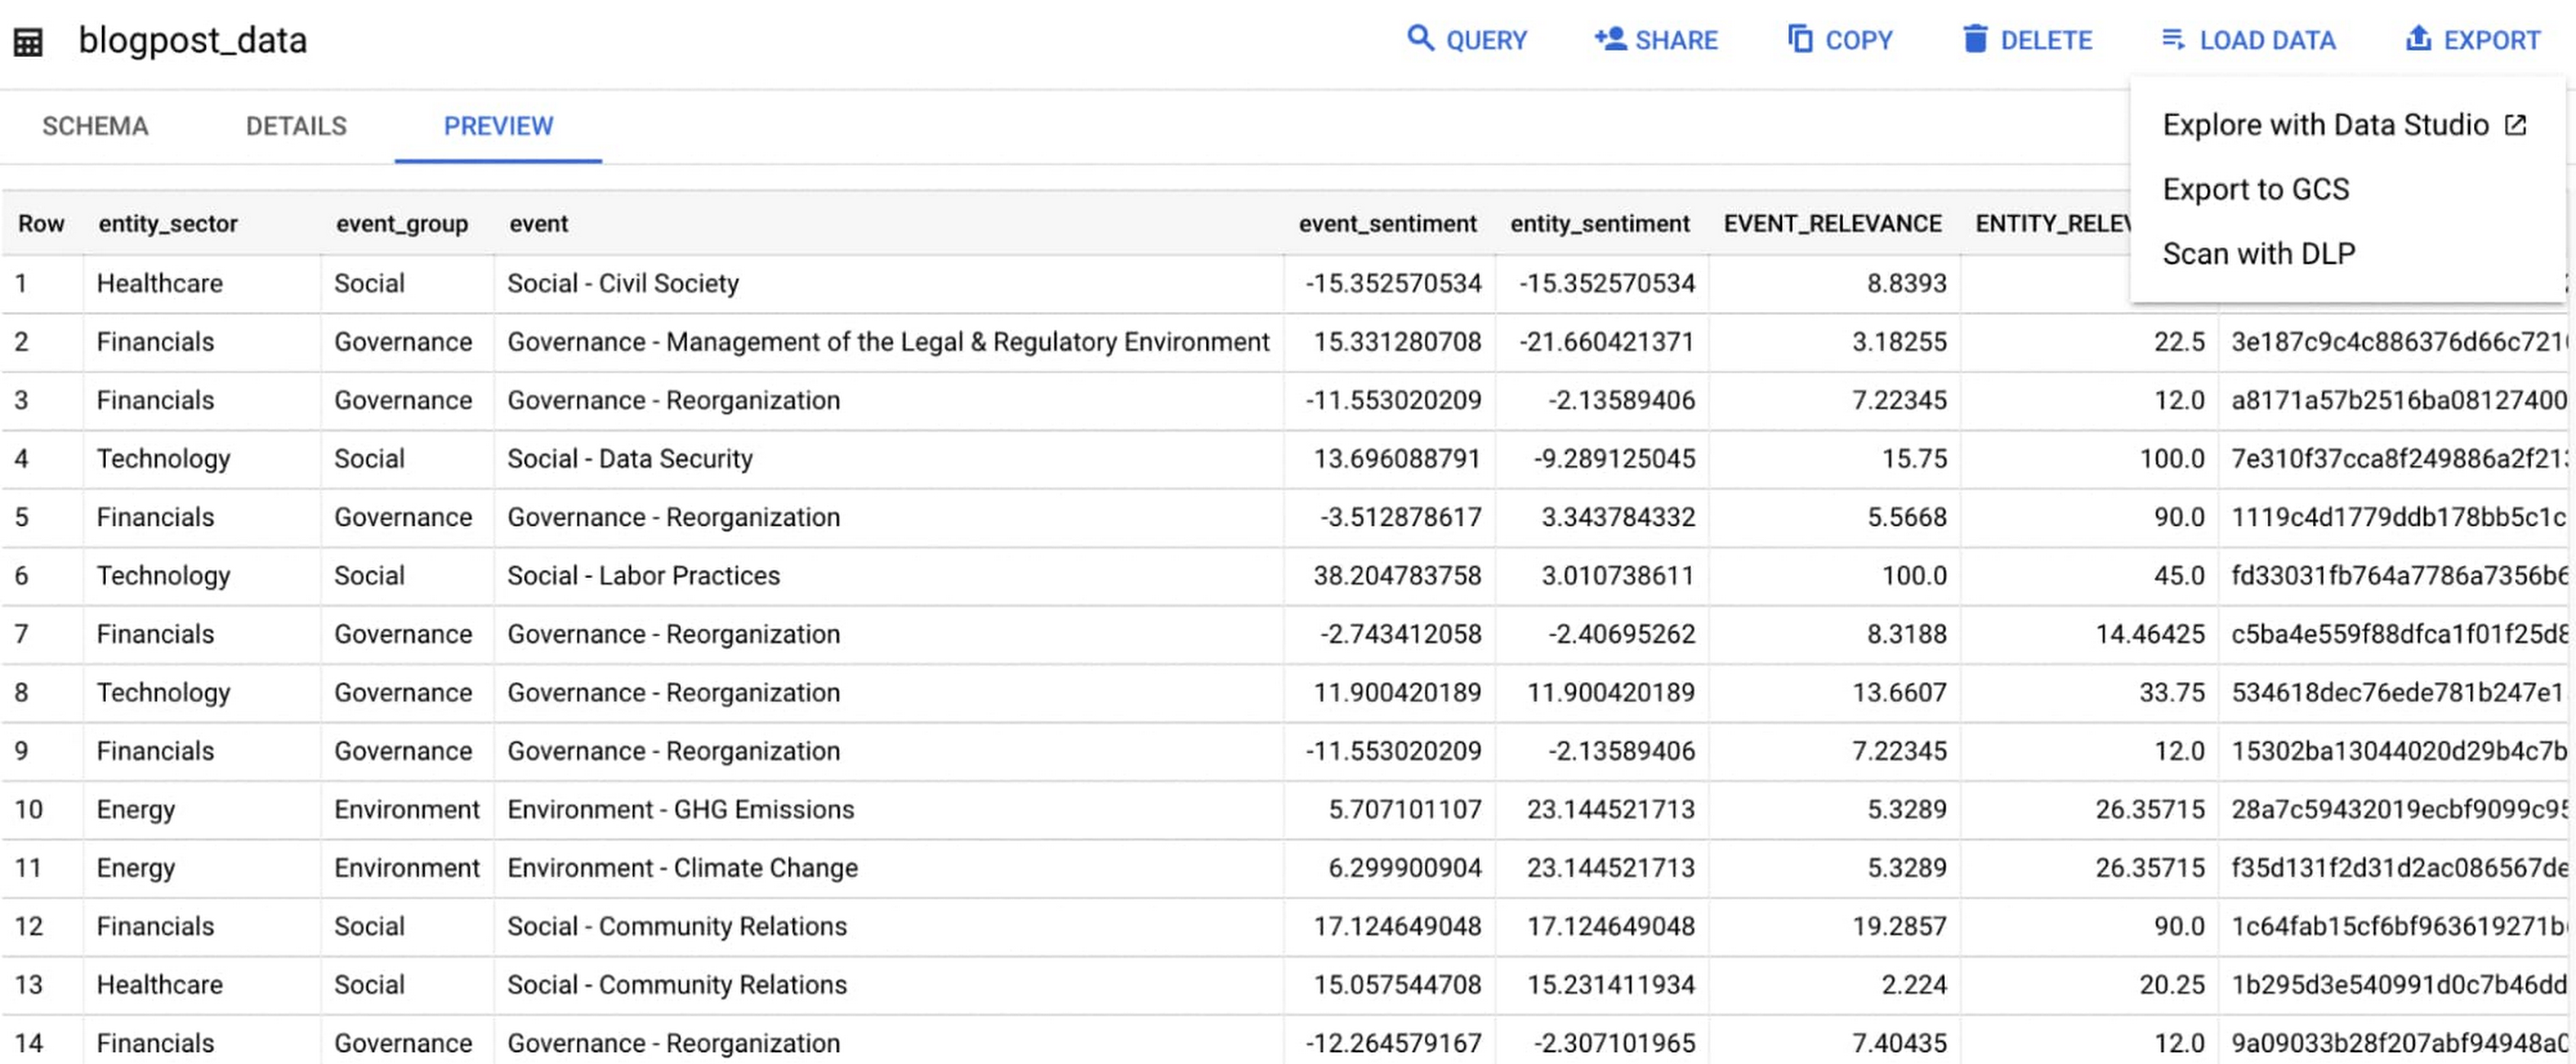
Select ‘Export’ and ‘Explore with Data Studio’.
Step 6. Build a simple/basic report.
Now that the ESG data appears in Data Studio, you can start by building a simple chart to help you understand which industry sectors have the highest volume of discussions around ESG and the overall ESG Sentiment per industry sector.
To build the chart:
- Select the chart type ‘Table’.
- Include
Entity_Sectoras your dimension to aggregate results by ‘Industry Sector.’ - Include
Signal_IDas a measure to count the number of ESG passages identified per ‘Industry Sector.’ - Include
AVG(Event_Sentiment)as a measure to display the overall ESG Sentiment per ‘Industry Sector’ across ESG Issues.

You can see sectors that are most discussed when it comes to ESG related topics and their corresponding ‘ESG Sentiment’ scores.
Step 7. Build your final report in Data Studio.
As a next step you can further drill into the data to understand ESG data specific to each ‘Industry Sector’ and identify positive and negative ESG practices.
Accern has built a more complex sample dashboard and made it available publicly here. You can interact with this report and play around with the data. The dashboard can help to identify material ESG insights for each sector to inform your investment and risk processes. If you have additional questions, you can reach out to Accern directly.

Discovering, accessing and analyzing licensed datasets is quick and easy. Stay tuned for more updates on new licensed datasets.
Publishing your data via Datashare
If you are a publisher of market data, alternative, or exotic data, you can use Datashare to get it published on Google Cloud Marketplace.
Start by joining the Partner Advantage program by registering for the Partner Advantage Portal and applying for the Partner Advantage Build Model engagement. Visit our getting started guide for information to get started on publishing licensed datasets in the Marketplace. Stay tuned for a future blog post about using Datashare to publish datasets in the Marketplace.
More solutions for capital markets
Check out other Google Cloud solutions for capital markets.
6788
Of your peers have already watched this video.
2:30 Minutes
The most insightful time you'll spend today!
What is BigQuery?
BigQuery is Google Cloud’s enterprise data warehouse designed to help you ingest, store, analyze, and visualize big data with ease.
Organizations rely on data warehouses to aggregate data from disparate sources, process it, and make it readily available for data analysis that supports their strategic decision-making.
You can ingest data into BigQuery either through batch uploading or streaming data directly to deliver real-time insights.
As a fully-managed data warehouse, Google takes care of the infrastructure so you can focus on analyzing your data up to petabyte scale.
BigQuery supports the same Structured Query Language, or SQL, for analyzing your data, which you may be familiar with if you’ve worked with ANSI-compliant relational databases in the past.
If you’re looking to create machine learning models using your enterprise data, you can do so with BigQuery ML.
With only a few lines of SQL, you can train and execute models on your BigQuery data without needing to move it around.
When it comes time to visualize your data, BigQuery integrates with Looker, as well as several other business intelligence tools across our partner ecosystem.
Now, how do you use BigQuery?
Luckily, it’s straightforward to get up and running with BigQuery.
After creating a GCP project, you can immediately start querying public data sets, which Google Cloud hosts and makes available to all BigQuery users, or you can load your own data into BigQuery to analyze.
Interacting with BigQuery to load data, run queries, or even create ML models can be done in three different ways.
First is by using the UI and the Cloud Console. Second is by using the BigQuery command line tool. And third is by making calls to the BigQuery API, using client libraries available in several languages.
BigQuery is integrated with Google Cloud’s Identity and Access Management Service so you can securely share your data and analytical insights across the organization.
What does it cost to use BigQuery?
With BigQuery, you pay for storing and querying data and streaming inserts.
Loading and exporting data are free of charge.
Storage costs are based on the amount of data stored and have two rates based on how often the data is changing.
Query costs can be either on demand, meaning you are charged per query by the amount of data processed, or flat rate for customers who want to purchase dedicated resources.
Start-up Paves Way for More Inclusive Clinical Research: Honoring Black Founders of Acclinate with Google Cloud

8395
Of your peers have already read this article.
4:00 Minutes
The most insightful time you'll spend today!
Editor’s note: February is Black History Month—a time for us to come together to celebrate the diverse set of experiences, perspectives and identities that make up the Black experience. Over the next few weeks, we will highlight Black-led startups and how they use Google Cloud to grow their businesses. Today’s feature highlights Acclinate and its founders, Del and Tiffany.
As patients, as caregivers, and as parents taking our own children to the doctor, we want recommended medications to be safe and effective. It’s a right everyone deserves.
It’s known that certain medications don’t work in the same way in all populations. For example, Albuterol, a medication often prescribed for asthma, is less effective in 67% of all Puerto Ricans and 47% of Black Americans. These problems—which can have deadly consequences—result from historically limited diversity in pharmaceutical clinical trials.
We founded our startup Acclinate to integrate culture and technology to achieve more inclusive clinical research. Help pharmaceutical companies and healthcare organizations access and engage communities of color so research is more inclusive.

Bridging the health equity gap by building trust
It’s important that health research organizations access and engage communities of color so their efforts reflect all the people they serve. Take a disease like diabetes, which affects a significantly higher proportion of Black Americans. When you look at even recent clinical trials for diabetic drugs, the representation of Black Americans among participants is only in the low single digits, despite comprising 13 percent of the U.S. population and more than 40 percent of diabetes patients in this country. Industry leaders have been aware of the lack of diversity issue, but some have chosen to ignore it or brush it aside. The biggest problem, in our opinion, is that there have been no penalties for not achieving higher diversity figures in clinical trials, and only minor financial repercussions to pharma/biotech companies when their treatments either do not work across all groups once approved, or there is a lack of uptake by all groups due to the lack of testing in those groups. The lack of clinical trial diversity has adversely impacted the reputation of the industry and the ability to recruit diverse populations in the future.
Acclinate integrates culture and technology to promote diverse patient representation in medical research. Our approach is not transactional. We build trust through our #NOWINCLUDED community, which is an ongoing, ever-expanding digital platform that educates and engages with communities of color on health issues.
#NOWINCLUDED includes a website app, and social media presence where members can learn information about diseases, particularly those with greater negative impacts on people of color, such as cancer, diabetes, and cardiovascular diseases. Members can share stories and ask questions. By providing access to trusted resources about these health issues and the latest clinical research, we empower Black people to take control of their health and consider participating in research that is shaping the future of healthcare.
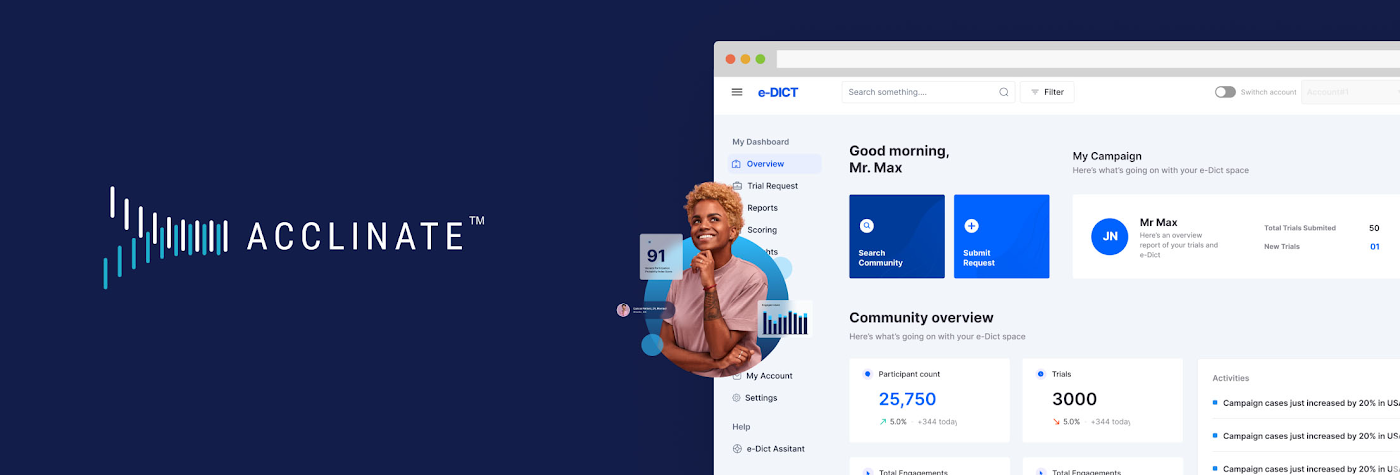
For healthcare-related organizations, we offer the opportunity to better understand the attitudes, aspirations, and unmet needs of underrepresented minority communities. Data from #NOWINCLUDED feeds our HIPAA-compliant SaaS platform, e-DICT™ (Enhanced Diversity in Clinical Trials), which uses predictive analytics and machine learning to identify individuals matching the requirements and most likely to be receptive to participation in a particular clinical trial.
Acclinate scales its platform with Google Cloud
We rely on Google Cloud services, including Vertex AI, to know whom to ask, when to ask, and how to ask for clinical trial participation. With Vertex AI, we enjoy a unified platform for developing our artificial intelligence models, including tools for preparing and storing our datasets. We can easily train and compare models using AutoML, which requires minimal ML expertise or effort with its intuitive graphical interface. This allows us to leverage more than ten ordinal and categorical data points to determine in real time a community member’s likelihood to enroll, which we call our Participation Probability Index (PPI). Our models evolve in an iterative process the more we interact with, and learn about, our community members.
We follow the pay-per-use Google Cloud Platform architecture model using serverless technology, which helps reduce infrastructure management costs and lets us focus on product development and engaging with communities across the U.S.
CloudSQL, a fully managed relational database service, integrates easily with BigQuery so we can glean insights for our clients in real time, all with Google Cloud’s robust security, governance, and reliability controls. Virtual Private Cloud (VPC) gives us scalable and flexible networking for our cloud-based resources and services. We also use Identity and Access Management (IAM) to simplify oversight of Google Cloud resource permissions for different user groups and roles, with appropriate security protections.
API Gateway manages our APIs using Cloud Functions, which both use consumption-based pricing, plus give our developers consistent and highly secure access to our services through a well-defined REST API. We use Memorystore for Redis to reduce platform latency. This is done with a fully managed service powered by the Redis in-memory data store, which builds application caches for fast data access. All of this comes together to provide an outstanding experience for our platform’s users and contributors.
- DSC00049.JPG
- DSC00010 (2).JPG
- pitch del tiff.jpg
Expanding influence with the Google for Startups Accelerator for Black Founders
Three months of one-on-one Google support and mentorship as part of the most recent Google for Startups Accelerator : Black Founders cohort not only helped us build our product, but also helped us earn external credibility. People use Google every day, so whether we’re trying to engage in conversations with industry experts or with somebody in a rural community, it is helpful to have the buy-in of a globally-recognized brand as we take on a historically difficult, systemic issue with challenges around trust. Getting access to the products, best practices, and people we need to build and grow through the Accelerator program has been priceless. For example, working with the Google AdWords team helped us generate important traffic from people interested in learning more about #NOWINCLUDED or sharing their story with us. Jason Scott, who leads the Google for Startups Accelerator: Black Founders program, is still connecting us to people in his network and identifying key opportunities for us months after the program wrapped. He continues to demonstrate that he is invested in seeing us succeed.
Our company has made great progress against our goals, in part thanks to receiving capital from the Google for Startups Black Founders Fund. We received $100K in non-dilutive funding along with Google Cloud credits, Google.org Ads grants, and hands-on support. We used the funds to pay for the transition and development costs associated with moving to Google Cloud. The Google support and accountability has been incredible. After receiving the Google for Startups Black Founders Fund award, we’ve gone on to raise another $1M and moved our cloud from Salesforce to Google Cloud.
We also had the amazing opportunity to be selected as one of six companies to take part in a face-to-face web conference with Sundar Pichai, Google’s CEO. We were thrilled to hear him explain his vision around health equity and the role Google plays. Ultimately, for us, it’s not just about the funding we get, but we are also gratified to receive support from an entity that truly believes in addressing this issue. We know Google is aligned with our mission of health and racial equity.
Championing diversity in clinical trials
Our 2022 looks bright. We expanded our presence to Washington, D.C. as part of the Johnson & Johnson Innovation JLABS ecosystem. We were also selected to take part in the BLUE KNIGHT initiative created between Johnson & Johnson Innovation and the Biomedical Advanced Research and Development Authority (BARDA) under the U.S. Department of Health and Human Services.
Acclinate is also on track to have contracts with five of the top 25 largest biopharmaceutical companies in the U.S this year. They’ve taken note, as has the Food and Drug Administration (FDA), that the lack of diversity in clinical trials represents a significant health concern—to the extent that the FDA has provided strong guidance for pharmaceutical companies to diversify their clinical trials. At the same time, the industry is also responding to pressure from communities of people of color to make equitable representation a priority.
Today, we are in the fortunate but challenging position to have significant inbound opportunities coming our way. In response, we continue to recruit and hire talented people to join our team. On the technology side, we are happy to be aligned with Google Cloud to have powerful cloud infrastructure that will scale with us, as well as high-caliber champions united in partnership. With people’s lives at stake, we are passionate in our commitment to helping ensure medications do what they are supposed to do: heal and improve the quality of life for everyone who takes them.
Hear Acclinate cofounders Del Smith and Tiffany Whitlow chat with Google’s Head of Startup Developer Ecosystem Jason Scott and fellow Black Founders Fund recipient Bobby Bryant about building on Google Cloud in a recent Google for Startups Instagram Live.
If you want to learn more about how Google Cloud can help your startup, visit our page here to get more information about our program, and sign up for our communications to get a look at our community activities, digital events, special offers, and more
Blue Apron: Offering a better recipe for modern analytics

1638
Of your peers have already read this article.
5:30 Minutes
The most insightful time you'll spend today!
When Blue Apron had issues running its data warehouse on another cloud provider, it built an analytics platform using Looker and Google BigQuery to enable faster business decisions about food inventory.
Blue Apron’s mission is to make incredible home cooking accessible to everyone. Launched in 2012, Blue Apron is reimagining the way that food is produced, distributed, and consumed.

Google Cloud Results
- Enables near real-time business decisions to better manage food inventory and delivery by reducing query times exponentially
- Helps improve customer service and optimize business processes with faster insights
- Reduces costs while reclaiming up to a week per month of engineering
The popularity of meal kit delivery services has surged in recent years as consumer attitudes toward home cooking and grocery shopping have shifted. As a pioneer in the category, Blue Apron helps its customers create incredible home cooking experiences by sending culinary-driven recipes with high-quality ingredients and step-by-step instructions straight to customers’ doors. Blue Apron also offers a monthly wine subscription service and a la carte culinary tools and products through its marketplace.
If that sounds simple, it isn’t. Ingredients for the meal kits must be sourced at the right time, quality, and price. Orders must be packed efficiently and in exactly the right proportions. Most importantly, meal kits must be delivered to the customer fresh and on time.
To meet these criteria and make data meaningful and intuitive to its managers, one of the tools Blue Apron relies on is Looker, an analytics platform that lets business users explore data and ask sophisticated questions using familiar terms.
A Google Cloud partner and winner of the 2016 Google Cloud Global Partner Award for Solution Innovation, Looker integrates its solution with Google Cloud Platform to help customers modernize their analytics.
Blue Apron previously used Looker with a single database instance hosted on another cloud provider. As data volumes grew and queries became more complex, it became difficult to scale. Blue Apron’s only options were choosing ever-larger server classes and increasing storage throughput by purchasing a higher number of provisioned IOPS. To improve speed, scalability, and cost efficiency, Blue Apron moved its data warehouse to Google BigQuery.
“The combination of Looker and Google BigQuery is powerful, allowing us to get data-hungry analysts essential information much faster,” says Sam Chase, Tech Lead, Data Operations at Blue Apron. “Because we choose to pay by the query, it’s also flexible and cost effective—plus storage is cheap, so we can just put data in and query what we need.”
The analytics platform of the future
When you’re making business decisions about a customer’s dinner, speed matters. Looker takes full advantage of the power of Google BigQuery, making it easy to build a data exploration platform. Blue Apron’s applications publish event data to Kafka—approximately 140 million events per day—and data is then streamed into Google BigQuery, which performs lightning-fast queries on both streamed and static data. Now, business users and analytics teams can make decisions based on near real-time information in Looker, instead of waiting until the next business day for results.
“After we moved to Google BigQuery, query time was reduced exponentially. It’s an astonishing difference, allowing us to run 300 queries per day,” says Sam.
Previously, Blue Apron spent up to a week out of every month optimizing its data warehouse to attempt to improve query performance. With Google BigQuery, all maintenance is handled by Google, reclaiming 25% of up to two engineers’ time. Even when multiple people are using Looker concurrently, query performance never degrades and storage never runs out.
“Because Google BigQuery is architected as a giant, shared cluster, growth is smooth,” says Lloyd Tabb, Founder and CTO of Looker. “Like a race car going from 0 to 120 mph, there are no shift points, just smooth acceleration. To us, it looks like the future.”
An empowering, integrated toolset
Looker takes advantage of aggressive caching and support for date-based table partitioning in Google BigQuery to increase performance, simplify the load process, and improve data manageability. By partitioning data by time, Blue Apron can also take advantage of better long-term storage pricing without sacrificing query performance. When using Google BigQuery with Looker, analysts can easily see how much data is going to be scanned before each query is run.
Blue Apron is also using Looker for Google BigQuery Data Transfer Service to provide actionable analytics for all of the company’s Google marketing data from Google AdWords and DoubleClick by Google in one place to understand campaign performance across channels, saving its data operations team months of work. Using Looker Blocks, marketers can quickly make sense of the data with reports and dashboards, and set alerts when campaign performance hits certain thresholds.
Looker Blocks for Google AdWords and DoubleClick by Google provide all the analysis you’d get straight from the Google console, plus additional value-add analysis that’s impossible to replicate without SQL. Complex metrics such as ROI on ad spend, flexible multi-touch attribution, and predictive lifetime value empower marketers with a better understanding of their customers and where to spend their next dollar.
In addition to these turnkey dashboards and pieces of analysis, marketers can customize views to meet their unique needs and workflows. These capabilities help the Blue Apron marketing team make decisions regarding the allocation of spend to maximize customer acquisition and retention.
“Everyone at Blue Apron is excited about using Google BigQuery with Looker,” says Sam. “Business users and marketers are more empowered to look for answers, instead of waiting for analytics teams. Because users know they can get results rapidly, our business processes are evolving and improving.”
For data cleansing and transformation, Blue Apron uses Google Cloud Dataproc to run fully managed Apache Spark clusters on Google Cloud Platform. It’s also leveraging Google BigQuery integration with Google Workspace to bring data into Google Sheets for further distribution and analysis.
“Transferring data between Google tools is fast because it all happens on the Google network,” says Sam. “We can pull data from Google BigQuery, run transformations with Spark, and then write it back to Google BigQuery. That’s very helpful in providing our business users and data analysts with the richest, most current data.”
A perfect match for better insights
As Blue Apron seeks to expand its reach and deepen its engagement with customers, it is making Google BigQuery and Looker available to more users, providing a high-quality interactive analytics experience. “Our ability to pull a lot of data in and compute fast results affects everyone in our company,” says Sam. “Using Google BigQuery and Looker to iterate quickly and build new models to make our operations more efficient will directly impact our customers.”
For Looker, Google BigQuery represents the next step in data warehouse evolution. “Google BigQuery is a perfect match for Looker, combining easy setup with near infinite scale-out and elasticity,” says Lloyd. “People can make smarter decisions faster that directly benefit their business and customers.”
More Relevant Stories for Your Company

Brazilian Insurer Uses Google BigQuery to Underwrite Critical Decisions
To stay competitive in the rapidly changing insurance marketplace, Mitsui Sumitomo Seguros (MSS) recognized the need to leverage its available data to stabilize and scale existing operations, improve sales decisions and better engage employees. MSS managers required frequent and easy access to newly organized data (including performance metrics and market

Guide: Bring new life to your databases with an Oracle migration
Organizations today are being forced to make difficult decisions. Innovation has moved down the list for many companies, replaced with realities like making sure your business systems stay up and running during a disaster, managing unexpected shifts in demand,and above all, staying in business. In the short term, this means

Data to Business Outcomes with Google’s Data Analytics Design Pattern
Companies today are inundated with vast amounts of data from various sources. This overwhelming amount of data is meant to benefit the company, but often leaves data teams feeling overwhelmed, which can create data bottlenecks and result in a slow time to value. In fact, only twenty seven percent of

HSBC Overcomes Capacity Challenges and Innovation-Blocks With Google BigQuery
At HSBC, we serve 39 million customers, in-person and online, from consumers to businesses, in 66 countries. We maintain data centers in 21 countries, with more than 94,000 servers. With an on-premises infrastructure supporting our business, we kept running into capacity challenges, which really became an innovation blocker and ultimately
