





Updating Twitter’s Ad Engagement Analytics Platform for the Modern Age

3099
Of your peers have already read this article.
3:30 Minutes
The most insightful time you'll spend today!
As part of the daily business operations on its advertising platform, Twitter serves billions of ad engagement events, each of which potentially affects hundreds of downstream aggregate metrics. To enable its advertisers to measure user engagement and track ad campaign efficiency, Twitter offers a variety of analytics tools, APIs, and dashboards that can aggregate millions of metrics per second in near-real time.
In this post, you’ll get details on how the Twitter Revenue Data Platform engineering team, led by Steve Niemitz, migrated their on-prem architecture to Google Cloud to boost the reliability and accuracy of Twitter’s ad analytics platform.
Deciding to migrate
Over the past decade, Twitter has developed powerful data transformation pipelines to handle the load of its ever-growing user base worldwide. The first deployments for those pipelines were initially all running in Twitter’s own data centers. The input data streamed from various sources into Hadoop Distributed File System (HDFS) as LZO-compressed Thrift files in an Elephant Bird container format. The data was then processed and aggregated in batches by Scalding data transformation pipelines. Then, aggregation results were output into Manhattan, Twitter’s homegrown distributed key-value store, for serving. Additionally, a streaming system using Twitter’s homegrown systems Eventbus (a messaging tool built on top of DistributedLog), Heron (a stream processing engine), and Nighthawk (a sharded Redis deployment) powered the real-time analytics that Twitter had to provide, filling the gap between the current time and the last batch run.
While this system consistently sustained massive scale, its original design and implementation was starting to reach some limits. In particular, some parts of the system that had grown organically over the years were difficult to configure and extend with new features. Some intricate, long-running jobs were also unreliable, leading to sporadic failures. The legacy end-user serving system was very expensive to run and couldn’t support large queries.
To accommodate for the projected growth in user engagement over the next few years and streamline the development of new features, the Twitter Revenue Data Platform engineering team decided to rethink the architecture and deploy a more flexible and scalable system in Google Cloud.
Platform modernization: First iteration
In the middle of 2017, Steve and his team tackled the first redesign iteration of its advertising data platform modernization, leading to Twitter’s collaboration with Google Cloud.
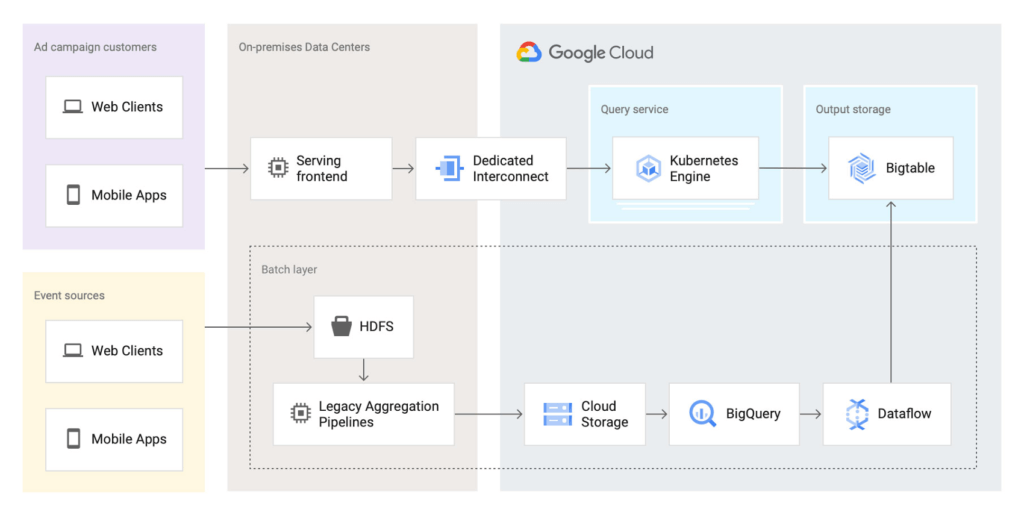
At first, the team left the data aggregation legacy Scalding pipelines unchanged and continued to run them in Twitter’s data centers. But the batch layer’s output was switched from Manhattan to two separate storage locations in Google Cloud:
- BigQuery—Google’s serverless and highly scalable data warehouse, to support ad-hoc and batch queries.
- Cloud Bigtable—Google’s low-latency, fully managed NoSQL database, to serve as a back end for online dashboards and consumer APIs.
The output aggregations from the Scalding pipelines were first transcoded from Hadoop sequence files to Avro on-prem, staged in four-hour batches to Cloud Storage, and then loaded into BigQuery. A simple pipeline deployed on Dataflow, Google Cloud’s fully managed streaming and batch analytics service, then read the data from BigQuery and applied some light transformations. Finally, the Dataflow pipeline wrote the results into Bigtable.
The team built a new query service to fetch aggregated values from Bigtable and process end-user queries. They deployed this query service in a Google Kubernetes Engine (GKE) cluster in the same region as the Bigtable instance to optimize for data access latency.
Here’s a look at the architecture:
This first iteration already brought many important benefits:
- It de-risked the overall migration effort, letting Twitter avoid migrating both the aggregation business logic and storage at the same time.
- The end-user serving system’s performance improved substantially. Thanks to Bigtable’s linear scalability and extremely low latency for data access, the serving system’s P99 latencies decreased from 2+ seconds to 300ms.
- Reliability increased significantly. The team now rarely, if ever, gets paged for the serving system anymore.
Platform modernization: second iteration
With the new serving system in place, in 2019 the Twitter team began to redesign the rest of the data analytics pipeline using Google Cloud technologies. The redesign sought to solve several existing pain points:
- Because the batch and streaming layers ran on different systems, much of the logic was duplicated between systems.
- While the serving system had been moved into the cloud, the existing pain points of the Hadoop aggregation process still existed.
- The real-time layer was expensive to run and required significant operational attention.
With these pain points in mind, the team began evaluating technologies that could help solve them. They considered several open-source stream processing frameworks initially: Apache Flink, Apache Kafka Streams, and Apache Beam. After evaluating all possible options, the team chose Apache Beam for a few key reasons:
- Beam’s built-in support for exactly-once operations at extremely large scale across multiple clusters.
- Deep integration with other Google Cloud products, such as Bigtable, BigQuery, and Pub/Sub, Google Cloud’s fully managed, real-time messaging service.
- Beam’s programming model, which unifies batch and streaming and lets a single job operate on either batch inputs (Cloud Storage), or streaming inputs (Pub/Sub).
- The ability to deploy Beam pipelines on Dataflow’s fully managed service.
The combination of Dataflow’s fully managed approach and Beam’s comprehensive feature set let Twitter simplify the structure of its data transformation pipeline, as well as increase overall data processing capacity and reliability.
Here’s what the architecture looks like after the second iteration:
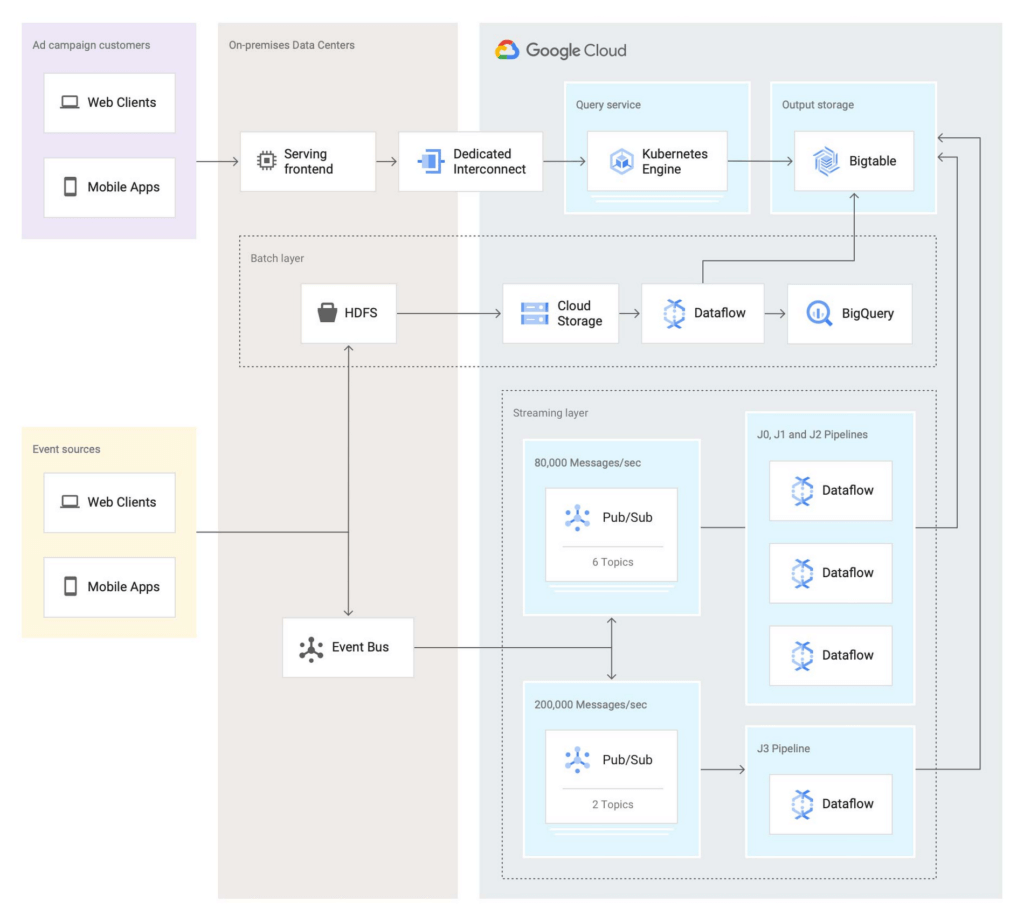
In this second iteration, the Twitter team re-implemented the batch layer as follows: Data is first staged from on-prem HDFS to Cloud Storage. A batch Dataflow job then regularly loads the data from Cloud Storage, processes the aggregations, and dual-writes the results to BigQuery for ad-hoc analysis and Bigtable for the serving system.
The Twitter team also deployed an entirely new streaming layer in Google Cloud. For data ingestion, an on-prem service now pushes two different streams of Avro-formatted messages to Pub/Sub. Each message contains a bundle of multiple raw events and affects between 100 and 1,000 aggregations. This leads to more than 3 million aggregations per second performed by four Dataflow jobs (J0-3 in the diagram above). All Dataflow jobs share the same topology, although each job consumes messages from different streams or topics.
One stream, which contains critical data, enters the system at a rate of 200,000 messages per second and is partitioned in two separate Pub/Sub topics. A Dataflow job (J3 in the diagram) consumes those two streams, performs 400,000 aggregations per second, and outputs the results to a table in Bigtable.
The other stream, which contains less critical but higher volume data, enters the system at a rate of around 80,000 messages per second and is partitioned into six separate topics. Three Dataflow jobs (J0, J1, and J2) share the processing of this larger stream, with each of them handling two of the available six topics in parallel, then also outputting the results to a table in Bigtable. In total, those three jobs process over 2 million aggregations/second.
Partitioning the high-volume stream into multiple topics offers a number of advantages:
- The partitioning is organized by applying a hash function on the aggregation key and then dividing the function’s result by the number of available partitions (in this case, six). This guarantees that any per-key grouping operation in downstream pipelines is scoped to a single partition, which is required for consistent aggregation results.
- When deploying updates to the Dataflow jobs, admins can drain and relaunch each job individually in sequence, allowing the remaining pipelines to continue uninterrupted and minimizing impact on the end users.
- The three jobs can each handle two topics without issue currently, and there is still room to scale horizontally up to six jobs if needed. The number of topics (six) is arbitrary, but is a good balance at the moment based on current needs and potential spikes in traffic.
To assist with job configuration, Twitter initially considered using Dataflow’s template system, a powerful feature that enables the encapsulation of Dataflow pipelines into repeatable templates that can be configured at runtime. However, since Twitter needed to deploy jobs with topologies that might change over time, the team decided instead to implement a custom declarative system where developers can specify different parameters for their jobs in a pystachio DSL: tuning parameters, data sources to operate on, sink tables for aggregation outputs, and the jobs’ source code location. A new major version of Dataflow templates, called Flex Templates, will remove some of the previous limitations with the template architecture and allow any Dataflow job to be templatized.
For job orchestration, the Twitter team built a custom command line tool that processes the configuration files to call the Dataflow API and submit jobs. The tool also allows developers to submit a job update by automatically performing a multi-step process, like this:
- Drain the old job:
- Call the Dataflow API to identify which data sources are used in the job (for example, a Pub/Sub topic reader).
- Initiate a drain request.
- Poll the Dataflow API for the watermark of the identified sources until the maximum watermark is hit, which indicates that the draining operation is complete.
- Launch the new job with the updated code.
This simple, flexible, and powerful system allows developers to focus on their data transformation code without having to be concerned about job orchestration or the underlying infrastructure details.
Looking ahead
Six months after fully transitioning its ad analytics data platform to Google Cloud, Twitter has already seen huge benefits. Twitter’s developers have gained in agility as they can more easily configure existing data pipelines and build new features much faster. The real-time data pipeline has also greatly improved its reliability and accuracy, thanks to Beam’s exactly-once semantics and the increased processing speed and ingestion capacity enabled by Pub/Sub, Dataflow, and Bigtable.
Twitter engineers have enjoyed working with Dataflow and Beam for several years now, since version 2.2, and plan to continue expanding their usage. Most importantly, they’ll soon merge the batch and streaming layers into a single, authoritative streaming layer.
Throughout this project, the Twitter team collaborated very closely with Google engineers to exchange feedback and discuss product enhancements. We look forward to continuing this joint technical effort on several ongoing large-scale cloud migration projects at Twitter. Stay tuned for more updates!
Google Dataflow Named Leader in The 2021 Forrester Wave™: Streaming Analytics

6652
Of your peers have already read this article.
2:00 Minutes
The most insightful time you'll spend today!
We are excited to announce that Google has been named a Leader in The Forrester Wave™: Streaming Analytics, Q2 2021 report. Thank you to our strong community of customers and partners for working with us to deliver a customer focused product. We believe Forrester’s recognition is an acknowledgement of our leadership across an integrated set of capabilities that rely on data to drive transformation. We were also honored to be named a leader in The Forrester Wave™: Cloud Data Warehouse, Q1 2021.
Forrester gave Dataflow a score of 5 out of 5 across 12 different criteria and according to the report: “Google Cloud Dataflow has strengths in data sequencing, advanced analytics, performance, and high-availability. Google Dataflow’s sweet spot is for enterprises that have a preponderance of real-time data generated on Google Cloud Platform or wish to simplify all data processing by using a single platform that unifies both streaming and batch jobs.”
Harnessing the power of real-time data
The speed with which businesses are able to respond to change is the difference between those that successfully navigate the future and those that get left behind. In order to accelerate their digital transformation, reimagine their business and leverage the power of real-time data, today’s data leaders require a streaming analytics platform that provides both depth and breadth.
Cloud Pub/Sub and Cloud Dataflow, based on more than a decade of experience in internet scale systems for Google’s own needs, provide customers with a reliable, scalable, performant platform. In addition, we’ve designed these products for ease of use to make streaming analytics accessible to more users, which is why customers such as Sky and others from across all industries use Dataflow to run streaming analytics workloads.
5 out of 5 across key streaming analytics criteria
While Forrester gave Dataflow a score of 5 out of 5 in 12 criteria, the product achieved the highest possible scores in areas that are top of mind for our customers.
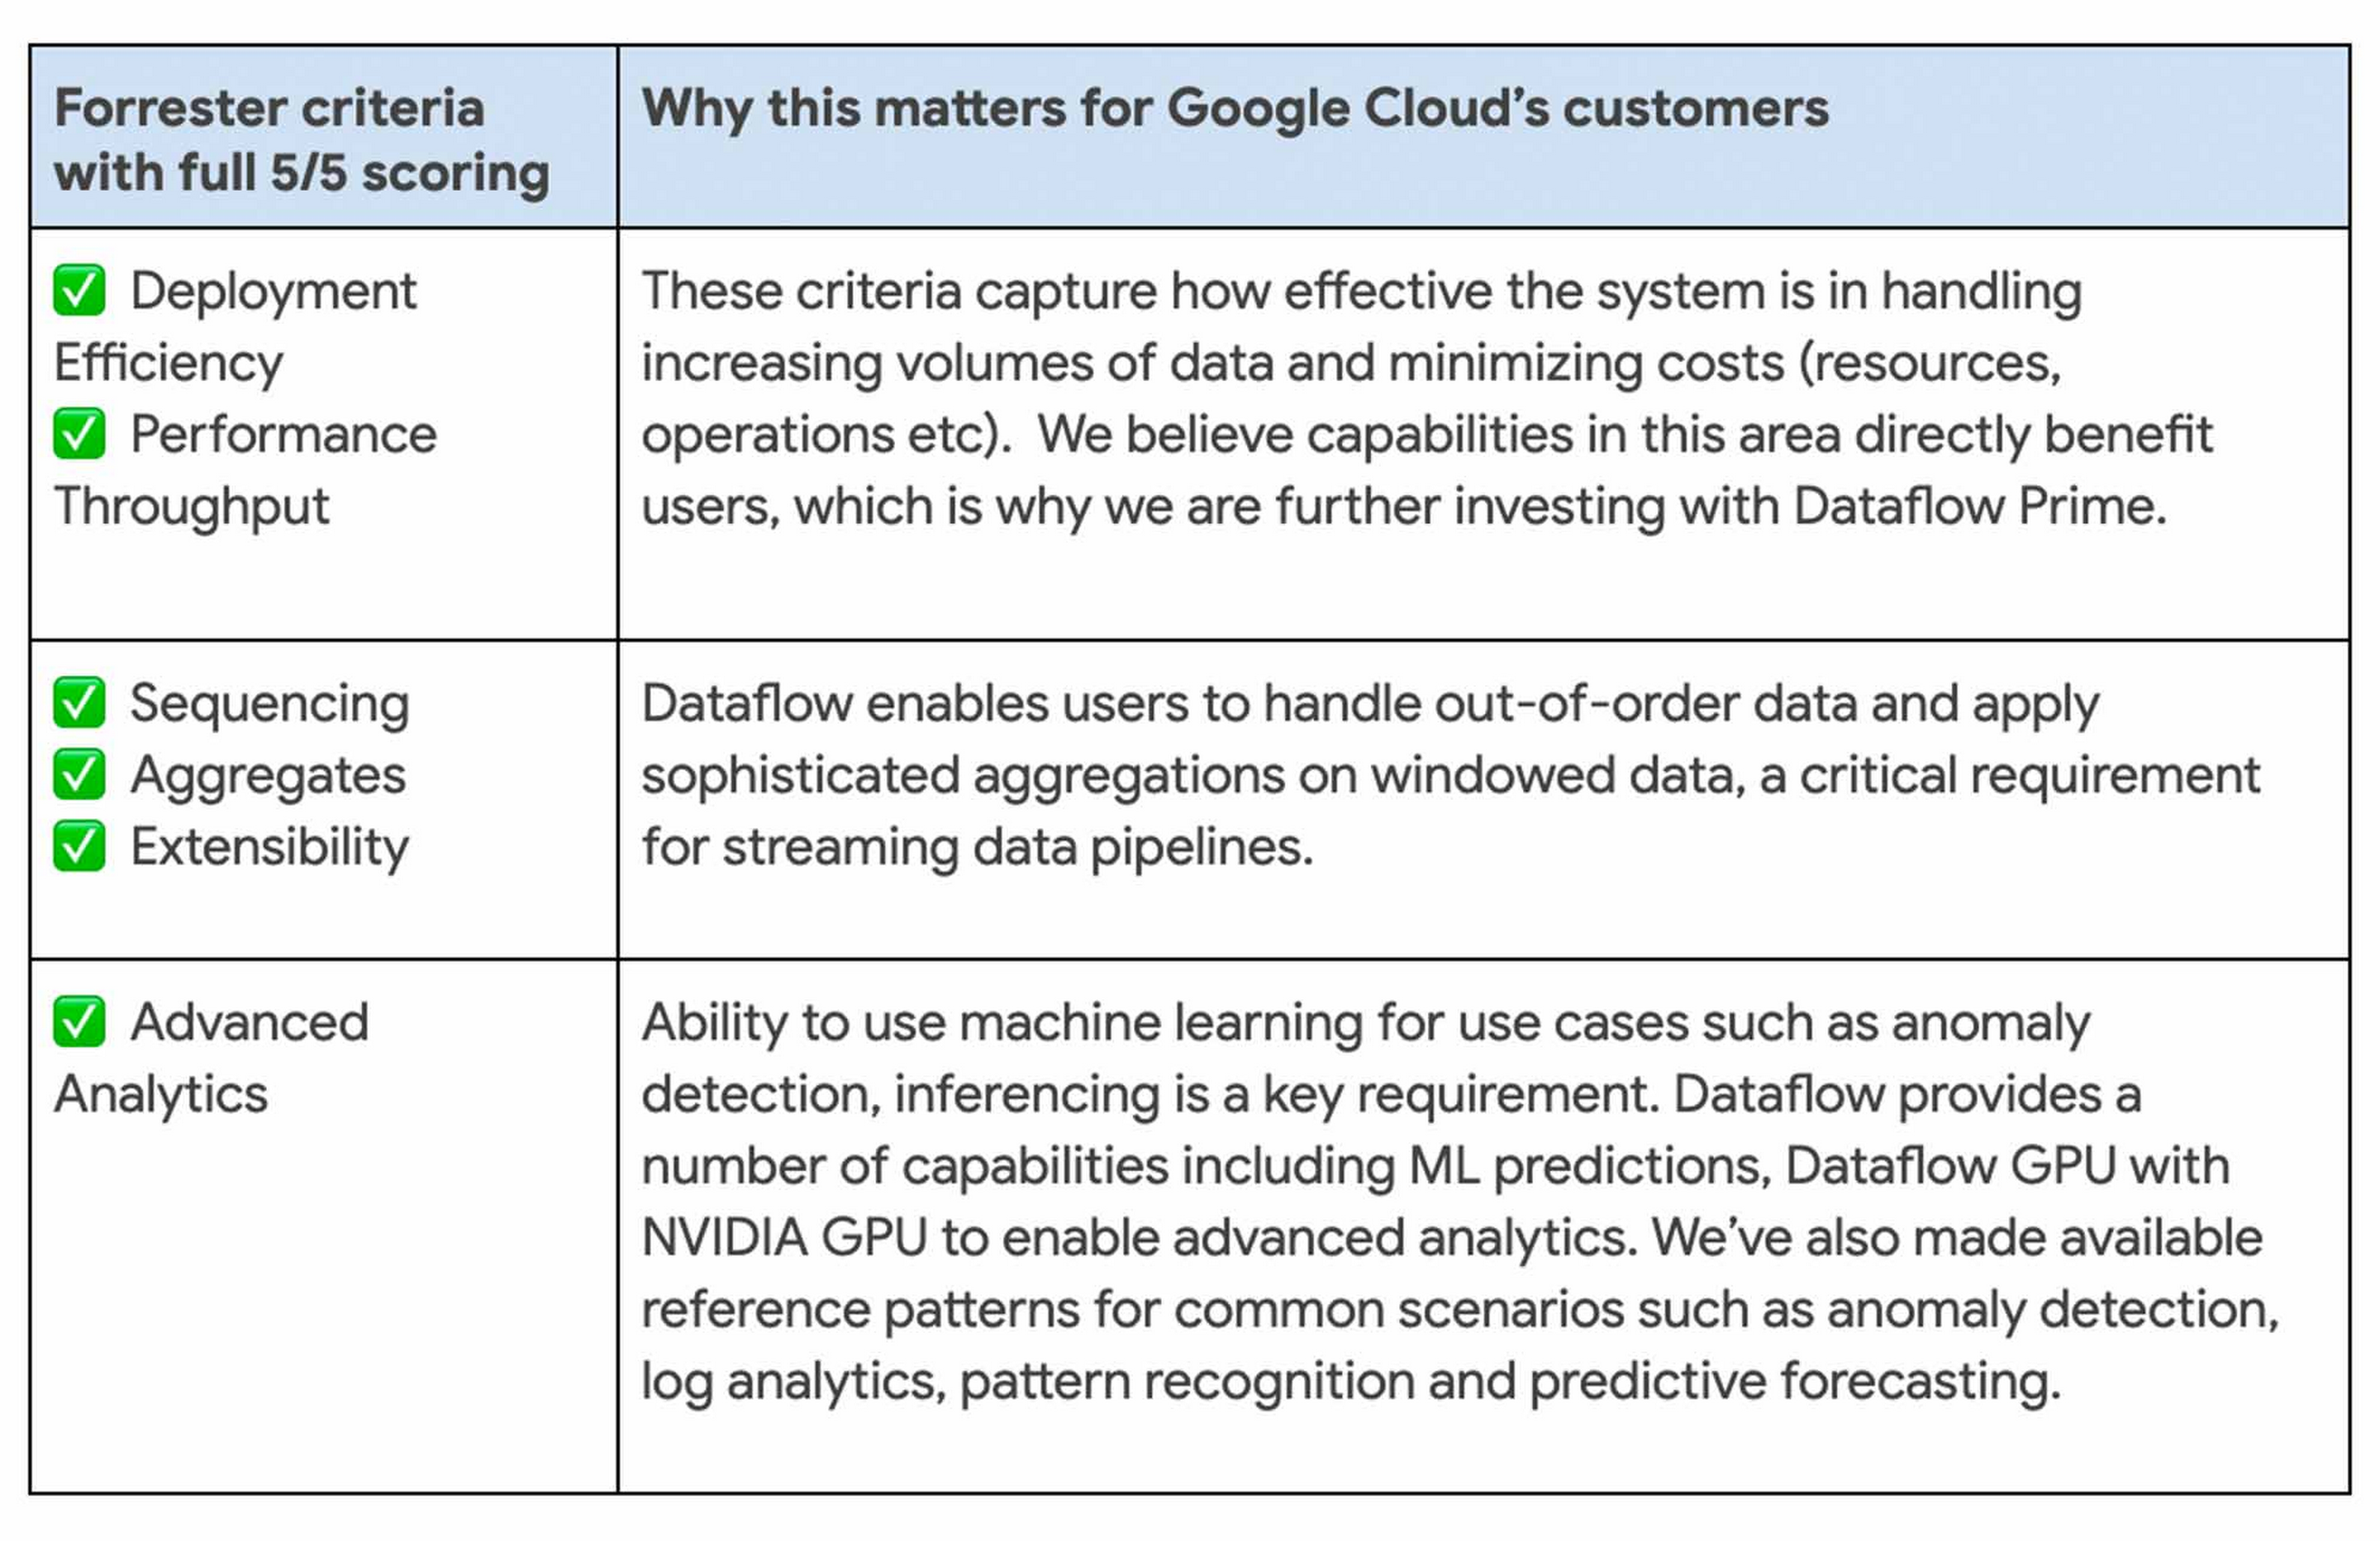
We continue to be focused on solving problems that matter to you. For example, just in the last month we announced Dataflow Prime and Auto Sharding for BigQuery – two new auto tuning capabilities that bring efficiency and simplicity to your streaming pipelines.
Dataflow achieves highest score possible in strategy
With Google, organizations gain an industry leading product and a partner that has the vision and strategy to help you tackle new business challenges and provide delightful experiences to your customers.

In summary, we are honored to be a Leader in The Forrester Wave™, Streaming Analytics, and look forward to continuing to innovate and partner with you on your digital transformation journey.
Download the full report: The Forrester Wave™: Streaming Analytics, Q2 2021 and check out these smart analytics reference patterns. To learn more about Dataflow, visit our website and get to know the product by taking an interactive tutorial. You can also watch recordings from the Data Cloud Summit event (May 2021), where we provided an in-depth view of new product innovations in Dataflow and other data analytics products.
How OnlineSales.ai and Google Cloud Helped TATA 1mg Increase Ad Revenue by 700%

1374
Of your peers have already read this article.
3:30 Minutes
The most insightful time you'll spend today!
Editor’s note: We invited partners from across our retail ecosystem to share stories, best practices, and tips and tricks on how they are helping retailers transform during a time that continues to see tremendous change. This original blog post was published by OnlineSales.ai. Please enjoy this updated entry from our partner.

Tata’s online healthcare entity, Tata 1mg, aims to revolutionize how a consumer finds the right healthcare professional for their needs. The platform offers e-pharmacy services, diagnostics, and health content and has more than 200,000 active brands in its rapidly expanding list of suppliers, sellers and manufacturers. Several of these brands would need regular involvement from the marketplace team in order to set up and run ad campaigns. As one of the largest platforms, Tata 1mg approached OnlineSales.ai to address their growing needs for an efficient Retail Media Monetisation suite to help scale up their existing monetisation efforts.
Tata 1mg needed more data-driven insights and customizability for their monetisation efforts
Tata 1mg saw several challenges that they needed to address.
- Manual effort: Tata 1mg marketplace team’s monetization process was largely manual and required heavy time and resource investment to activate advertisers, which subsequently ate into their overall ad revenues.
- Non-scalable framework: Given the fast-growing number of advertisers on their marketplace – well into the hundreds of thousands – it became increasingly clear that their existing monetization framework was not scalable.
- Inadequate reporting & analytics: The existing framework facilitated only simple reporting, and brands were not able to draw the deep insights they needed to make data-led decisions and refine their advertising ROIs.
- Steep learning curve: Several brands lacked dedicated advertising experts who could bring the experience and skills needed to plan successful ad campaigns and optimize budgets. The involved learning curve led to increased advertiser-churn.
- Lack of personalized offerings: The manual nature of Tata 1mg’s monetization framework left little room for customizability, and account managers could offer very little in terms of tailored ad-buying experiences to different types of advertisers.
All of these issues led to regular revenue leakage. Tata 1mg realized the need for a central platform that addressed the above-mentioned issues and would also be able to cater to new ad channels and the requirements thereof. Developing such a solution in house was evaluated, but was found to be expensive and would require a lot of time to build.
OnlineSales.ai’s AI/ML-powered solution on Google Cloud offered the automation and flexibility to support modern omnichannel advertising needs
Therefore, Tata 1mg looked to OnlineSales.ai Monetize, an AI/ML-powered retail media monetisation suite on Google Cloud, to help address their needs for a cloud-based monetisation platform that offered the flexibility to support omnichannel advertising models, had automation built in to reduce manual tasks, provided detailed intelligence and analytics, and delivered quick, reliable scalability.
- White labeled self-serve platform: OnlineSales.ai’s retail media platform was implemented within a short 4 weeks. After thorough testing and implementation, the platform was successfully launched, and enabled sellers to run ads on a fully self-serve platform. This required zero involvement from the Tata team.
- Unified omni channel buying: The team at OnlineSales.ai worked closely with the platform’s core teams to activate and mobilize various advertising products through a self-serve platform, while simultaneously addressing any unique requirements they had.
- Omnichannel analytics with AI-led suggestions: Sellers are now also able to generate detailed reports that provide them critical insights into campaigns, and help them make better use of their budgets – enhancing their experience and interest in advertising on the platform.
- Personalized buying experiences: The tailored UX offered by OnlineSales.ai’s Monetize helped Tata engage brands of all levels in technical aptitude to use the platform easily. This also allowed admins to configure what types of inventories were available to different brands or advertiser segments.
OnlineSales.ai makes use of Google Cloud Dataflow to facilitate computations on real-time streaming. Microservices are deployed on the Google Kubernetes Engine (GKE) platform due to the solution’s well-known ability to handle scale.
In addition, Dataproc is used by the company to run batch processing apps while Cloud Load Balancing helps manage traffic across different regions; all at scale. Onlinesales.ai also uses Memorystore as a database for their ad servers in order to have very low latency, and deploys BigQuery to run analytical applications and facilitate powerful reporting. The bulk of their office applications are deployed on different VMs on Compute Engine, and the company also makes use of Cloud Storage for data storage and transfers between applications.
Learn more about OnlineSales.ai available on the Google Cloud Marketplace.
About OnlineSales.ai
OnlineSales.ai, offers a fully white labeled retail media platform which helps retailers unlock additional revenue by activating advertising real estate on their platform. With its AI/ML-powered solution, OnlineSales.ai allows retailers to turn brands of all sizes into advertisers – at scale. Its self-serve platform simplifies the ad buying process, and enhances outcomes with smart automation, boosting ad retailers’ ad revenues by multiples.
A Breakdown of Cloud-based Data Ingestion Practices

8820
Of your peers have already read this article.
3:00 Minutes
The most insightful time you'll spend today!
Businesses around the globe are realizing the benefits of replacing legacy data silos with cloud-based enterprise data warehouses, including easier collaboration across business units and access to insights within their data that were previously unseen. However, bringing data from numerous disparate data sources into a single data warehouse requires you to develop pipelines that ingest data from these various sources into your enterprise data warehouse. Historically, this has meant that data engineering teams across the organization procure and implement various tools to do so. But this adds significant complexity to managing and maintaining all these pipelines and makes it much harder to effectively scale these efforts across the organization. Developing enterprise-grade, cloud-native pipelines to bring data into your data warehouse can alleviate many of these challenges. But, if done incorrectly, these pipelines can present new challenges that your teams will have to spend their time and energy addressing.
Developing cloud-based data ingestion pipelines that replicate data from various sources into your cloud data warehouse can be a massive undertaking that requires significant investment of staffing resources. Such a large project can seem overwhelming and it can be difficult to identify where to begin planning such a project. We have defined the following principles for data pipeline planning to begin the process. These principles are intended to help you answer key business questions about your effort and begin to build data pipelines that address your business and technical needs. Each section below details a principle of data pipelines and certain factors your teams should consider as they begin developing their pipelines.
Principle 1: Clarify your objectives
The first principle to consider for pipeline development is clarify your objectives. This can be broadly defined as taking a holistic approach to pipeline development that encompasses requirements from several perspectives: technical teams, regulatory or policy requirements, desired outcomes, business goals, key timelines, available teams and their skill sets, and downstream data users. Clarifying your objectives clearly identifies and defines requirements from each key stakeholder at the beginning of the process and continually checks development against these requirements to ensure the pipelines built will meet these requirements.This is done by first clearly defining the desired end state for each project in a way that addresses a demonstrated business need of downstream data users. Remember that data pipelines are almost always the means to accomplish your end state, rather than the end state itself. An example of an effectively defined end-state is “enabling teams to gain a better understanding of our customers by providing access to our CRM data within our cloud data warehouse” rather than “move data from our CRM to our cloud data warehouse”. This may seem like a merely semantic difference, but framing the problem in terms of business needs helps your teams make technical decisions that will best meet these needs.
After clearly defining the business problem you are trying to solve, you should facilitate requirement gathering from each stakeholder and use these requirements to guide the technical development and implementation of your ingestion pipelines. We recommend gathering stakeholders from each team, including downstream data users, prior to development to gather requirements for the technical implementation of the data pipeline. These will include critical timelines, uptime requirements, data update frequency, data transformation, DevOps needs, and security, policy, or regulatory requirements by which a data pipeline must meet.
Principle 2: Build your team
The second principle to consider for pipeline development is build your team. This means ensuring you have the right people with the right skills available in the right places to develop, deploy, and maintain your data pipelines. After you have gathered your pipeline requirements, you can begin to develop a summary architecture that will be used to build and deploy your data pipelines. This will help you identify the human talent you will need to successfully build, deploy, and manage these data pipelines and identify any potential shortfalls that would require additional support from either third-party partners or new team members.
Not only do you need to ensure you have the right people and skill sets available in aggregate, but these individuals need to be effectively structured to empower them to maximize their abilities. This means developing team structures that are optimized for each team’s responsibilities and their ability to support adjacent teams as needed.
This also means developing processes that prevent blockers to technical development whenever possible, such as ensuring that teams have all of the appropriate permissions they need to move data from the original source to your cloud data warehouse without violating the concept of least privilege. Developers need access to the original data source (depending on your requirements and architecture) in addition to the destination data warehouse. Examples of this are ensuring that developers have access to develop and/or connect to a Salesforce Connected App or read access to specific Search Ads 360 data fields.
Principle 3: Minimize time to value
The third principle to consider for pipeline development is minimize time to value. This means considering the long-term maintenance burden of a data pipeline prior to developing and deploying it in addition to being able to deploy a minimum viable pipeline as quickly as possible. Generally speaking, we recommend the following approach to building data pipelines to minimize their maintenance burden: Write as little code as possible. Functionally, this can be implemented by:
1. Leveraging interface-based data ingestion products whenever possible. These products minimize the amount of code that requires ongoing maintenance and empower users who aren’t software developers to build data pipelines. They can also reduce development time for data pipelines, allowing them to be deployed and updated more quickly.
- Products like Google Data Transfer Service and Fivetran allow for managed data ingestion pipelines by any user to centralize data from SaaS applications, databases, file systems, and other tooling. With little to no code required, these managed services enable you to connect your data warehouse to your sources quickly and easily.
- For workloads managed by ETL developers and data engineers, tools like Google Cloud’s Data Fusion provide an easy-to-use visual interface for designing, managing and monitoring advanced pipelines with complex transformations.
2. Whenever interface-based products or data connectors are insufficient, use pre-existing code templates. Examples of this include templates available for Dataflow that allow users to define variables and run pipelines for common data ingestion use cases, and the Public Datasets pipeline architecture that our Datasets team uses for onboarding.
3. If neither of these options are sufficient, utilize managed services to deploy code for your pipelines. Managed services, such as Dataflow or Dataproc, eliminate the operational overhead of managing pipeline configuration by automatically scaling pipeline instances within predefined parameters.
Principle 4: Increase data trust and transparency
The fourth principle to consider for pipeline development is increase data trust and transparency. For the purposes of this document, we define this as the process of overseeing and managing data pipelines across all tools. Numerous data ingestion pipelines that each leverage different tools or are not developed under a coordinated management plan can result in “tech sprawl”, which significantly increases the management overhead of data ingestion pipelines as the quantity of data pipelines increases. This becomes especially cumbersome if you are subject to service-level agreements, or legal, regulatory, or policy requirements for overseeing data pipelines. Preventing tech sprawl is, by far, the best strategy for dealing with it by developing streamlined pipeline management processes that automate reporting. Although this can theoretically be achieved by building all of your data pipelines using a single cloud-based product, we do not recommend doing so because it prevents you from taking advantage of features and cost optimizations that come with choosing the best product for your use case.
A monitoring service such as Google Cloud Monitoring Service or Splunk that automates metrics, events, and metadata collection from various products, including those hosted in on-premise and hybrid computing environments, can help you centralize reporting and monitoring of your data pipelines. A metadata management tool such as Google Cloud’s Data Catalog or Informatica’s Enterprise Data Catalog can help you better communicate the nuances of your data so users better understand which data resources are best fit for a given use case. This significantly reduces your pipeline’s governance burden by eliminating manual reporting processes that often result in inaccuracies or lagging updates.
Principle 5: Manage costs
The fifth principle to consider for pipeline development is manage costs. This encompasses both the cost of cloud resources and the staffing costs necessary to design, develop, deploy, and maintain your cloud resources. We believe that your goal should not necessarily be to minimize cost, but rather maximizing the value of your investment. This means maximizing the impact of every dollar spent by minimizing waste in cloud resource utilization and human time. There are several factors to consider when it comes to managing costs:
- Use the right tool for the job – Different data ingestion pipelines will have different requirements for latency, uptime, transformations, etc. Similarly, different data pipeline tools have different strengths and weaknesses. Choosing the right tool for each data pipeline can help your pipelines operate significantly more efficiently. This can reduce your overall cost, free up staffing time to focus on the most impactful projects, and make your pipelines much more efficient.
- Standardize resource labeling – Implement and utilize a consistent labeling schema across all tools and platforms to have the most comprehensive view of your organization’s spending. One example is requiring all resources to be labeled by the cost center or team at time of creation. Consistent labeling allows you to monitor your spend across different teams and calculate the overall value of your cloud spending.
- Implement cost controls – If available, leverage cost controls to prevent errors that result in unexpectedly large bills.
- Capture cloud spend – Capture your spend on all cloud resource utilization for internal analysis using a cloud data warehouse and a data visualization tool. Without it, you won’t understand the context of changes in cloud spend and how they correlate with changes in business.
- Make cost management everyone’s job – Managing costs should be part of the responsibilities of everyone who can create or utilize cloud resources. To do this well, we recommend making cloud spend reporting more transparent internally and/or implementing chargebacks to internal cost centers based on utilization.
Long-term, the increased granularity in cost reporting available within Google Cloud can help you better measure your key performance indicators. You can shift from cost-based reporting (i.e. – “We spent $X on BigQuery storage last month”) to value-based reporting (i.e. – “It costs $X to serve customers who bring in $Y revenue”).
To learn more about managing costs, check out Google Cloud’s “Understanding the principles of cost optimization” white paper.
Principle 6: Leverage continually improving services
The sixth principle is leverage continually improving services. Cloud services are consistently improving their performance and stability, even if some of these improvements are not obvious to users. These improvements can help your pipelines run faster, cheaper, and more consistently over time. You can take advantage of the benefits of these improvements by:
- Automating both your pipelines and pipeline management: Not only should data pipelines be automated, but almost all aspects of managing your pipelines can also be automated. This includes pipeline/data lineage tracking, monitoring, cost management, scheduling, access management and more. This helps reduce long-term operational costs of each data pipeline that can significantly alter your value proposition and prevent any manual configurations from negating the benefits of later product improvements.
- Minimizing pipeline complexity whenever possible: While ingestion pipelines are relatively easy to develop using UI-based or managed services, they also require continued maintenance as long as they are in use. The most easily maintained data ingestion pipelines are typically the ones that minimize complexity and leverage automatic optimization capabilities. Any transformation in a data ingestion pipeline is a manual optimization of the pipeline that may struggle to adapt or scale as the underlying services improve. You can minimize the need for such transformations by building ELT (extract, load, transform) pipelines rather than ETL (extract, transform, load) pipelines. This pushes transformations down to the data warehouse that is use a specifically optimized query engine to transform your data rather than manually configured pipelines.
Next steps
If you’re looking for more information about developing your cloud-based data platform, check out our Build a modern, unified analytics data platform whitepaper. You can also visit our data integration site to learn more and find ways to get started with your data integration journey.
Once you’re ready to begin building your data ingestion pipelines, learn more about how Cloud Data Fusion and Fivetran can help you make sure your pipelines address these principles.
5666
Of your peers have already watched this video.
56:20 Minutes
The most insightful time you'll spend today!
How Real Companies Are Innovating with AI Today—and the Benefits They’re Seeing
What do you get when you mix Target, women’s swim wear, and AI? “Joy!” says Mike McNamara, CIO and CDO, Target.
McNamara is just one of the many stories of real businesses conquering old challenges, and new disruptive industry challenges, with artificial intelligence.
McNamara, Nick Rockwell, CTO, The New York Times, Larry Colagiovanni, VP New Product Development, eBay, and Dirk John, CIO, LATAM Airlines, demonstrate how AI solutions allow businesses to find opportunity in chaos, innovation under tough conditions, and revenue in the most unlikely of places.
AI at Target
McNamara shows how AI is being applied to solve some of the most basic, yet critical, challenges that retailers like Target–and any business with large inventories—face. (start at 4:04)
AI at The New York Times
Nick Rockwell, CTO, The New York Times, shares how AI and big data tools are being used to leverage old assets and drive business ideas from them. (start at 12:18)
AI at eBay
Larry Colagiovanni, VP New Product Development, eBay, talks about how AI is helping eBay drive conversational commerce, help buyers sift through 1.1 billion items, and personalize the shopping experience.(start at 28:07)
AI at LATAM Airlines
Dirk John, CIO, LATAM Airlines, discusses how LATAM Airlines adopted advanced analytics tools in just a few weeks to accelerate the company’s understanding of their customers’ needs.(start at 35:58)
“It’s an Astonishing Difference”: What Data Operation Execs say About Google Cloud’s Data Warehouse

5652
Of your peers have already read this article.
8:30 Minutes
The most insightful time you'll spend today!
The popularity of meal kit delivery services has surged in recent years as consumer attitudes toward home cooking and grocery shopping have shifted. As a pioneer in the category, Blue Apron helps its customers create incredible home cooking experiences by sending culinary-driven recipes with high-quality ingredients and step-by-step instructions straight to customers’ doors. Blue Apron also offers a monthly wine subscription service and a la carte culinary tools and products through its marketplace.
If that sounds simple, it isn’t.
Ingredients for the meal kits must be sourced at the right time, quality, and price. Orders must be packed efficiently and in exactly the right proportions. Most importantly, meal kits must be delivered to the customer fresh and on time.
To meet these criteria and make data meaningful and intuitive to its managers, one of the tools Blue Apron relies on is Looker, an analytics platform that lets business users explore data and ask sophisticated questions using familiar terms. Looker integrates its solution with Google Cloud Platform to help customers modernize their analytics.
“The combination of Looker and Google BigQuery is powerful, allowing us to get data-hungry analysts essential information much faster. Because we choose to pay by the query, it’s also flexible and cost effective—plus storage is cheap, so we can just put data in and query what we need.”
—Sam Chase, Tech Lead, Data Operations, Blue Apron
Blue Apron previously used Looker with a single database instance hosted on another cloud provider. As data volumes grew and queries became more complex, it became difficult to scale. Blue Apron’s only options were choosing ever-larger server classes and increasing storage throughput by purchasing a higher number of provisioned IOPS. To improve speed, scalability, and cost efficiency, Blue Apron moved its data warehouse to Google BigQuery.
“The combination of Looker and Google BigQuery is powerful, allowing us to get data-hungry analysts essential information much faster,” says Sam Chase, Tech Lead, Data Operations at Blue Apron. “Because we choose to pay by the query, it’s also flexible and cost effective—plus storage is cheap, so we can just put data in and query what we need.”
“After we moved to Google BigQuery, query time was reduced exponentially. It’s an astonishing difference, allowing us to run 300 queries per day.”
—Sam Chase, Tech Lead, Data Operations, Blue Apron
The analytics platform of the future
When you’re making business decisions about a customer’s dinner, speed matters. Looker takes full advantage of the power of Google BigQuery, making it easy to build a data exploration platform.
Blue Apron’s applications publish event data to Kafka—approximately 140 million events per day—and data is then streamed into Google BigQuery, which performs lightning-fast queries on both streamed and static data. Now, business users and analytics teams can make decisions based on near real-time information in Looker, instead of waiting until the next business day for results.
“After we moved to Google BigQuery, query time was reduced exponentially. It’s an astonishing difference, allowing us to run 300 queries per day,” says Sam.
Previously, Blue Apron spent up to a week out of every month optimizing its data warehouse to attempt to improve query performance. With Google BigQuery, all maintenance is handled by Google, reclaiming 25% of up to two engineers’ time. Even when multiple people are using Looker concurrently, query performance never degrades and storage never runs out.
“Because Google BigQuery is architected as a giant, shared cluster, growth is smooth,” says Lloyd Tabb, Founder and CTO of Looker. “Like a race car going from 0 to 120 mph, there are no shift points, just smooth acceleration. To us, it looks like the future.”
An empowering, integrated toolset
Looker takes advantage of aggressive caching and support for date-based table partitioning in Google BigQuery to increase performance, simplify the load process, and improve data manageability. By partitioning data by time, Blue Apron can also take advantage of better long-term storage pricing without sacrificing query performance. When using Google BigQuery with Looker, analysts can easily see how much data is going to be scanned before each query is run.
Blue Apron is also using Looker for Google BigQuery Data Transfer Service to provide actionable analytics for all of the company’s Google marketing data from Google AdWords and DoubleClick by Google in one place to understand campaign performance across channels, saving its data operations team months of work. Using Looker Blocks, marketers can quickly make sense of the data with reports and dashboards, and set alerts when campaign performance hits certain thresholds.
“Everyone at Blue Apron is excited about using Google BigQuery with Looker. Business users and marketers are more empowered to look for answers, instead of waiting for analytics teams. Because users know they can get results rapidly, our business processes are evolving and improving.”
—Sam Chase, Tech Lead, Data Operations, Blue Apron
Looker Blocks for Google AdWords and DoubleClick by Google provide all the analysis you’d get straight from the Google console, plus additional value-add analysis that’s impossible to replicate without SQL. Complex metrics such as ROI on ad spend, flexible multi-touch attribution, and predictive lifetime value empower marketers with a better understanding of their customers and where to spend their next dollar.
In addition to these turnkey dashboards and pieces of analysis, marketers can customize views to meet their unique needs and workflows. These capabilities help the Blue Apron marketing team make decisions regarding the allocation of spend to maximize customer acquisition and retention.
“Everyone at Blue Apron is excited about using Google BigQuery with Looker,” says Sam. “Business users and marketers are more empowered to look for answers, instead of waiting for analytics teams. Because users know they can get results rapidly, our business processes are evolving and improving.”
For data cleansing and transformation, Blue Apron uses Google Cloud Dataproc to run fully managed Apache Spark clusters on Google Cloud Platform. It’s also leveraging Google BigQuery integration with G Suite to bring data into Google Sheets for further distribution and analysis.
“Transferring data between Google tools is fast because it all happens on the Google network,” says Sam. “We can pull data from Google BigQuery, run transformations with Spark, and then write it back to Google BigQuery. That’s very helpful in providing our business users and data analysts with the richest, most current data.”
A perfect match for better insights
As Blue Apron seeks to expand its reach and deepen its engagement with customers, it is making Google BigQuery and Looker available to more users, providing a high-quality interactive analytics experience. “Our ability to pull a lot of data in and compute fast results affects everyone in our company,” says Sam. “Using Google BigQuery and Looker to iterate quickly and build new models to make our operations more efficient will directly impact our customers.”
For Looker, Google BigQuery represents the next step in data warehouse evolution. “Google BigQuery is a perfect match for Looker, combining easy setup with near infinite scale-out and elasticity,” says Lloyd. “People can make smarter decisions faster that directly benefit their business and customers.”
More Relevant Stories for Your Company

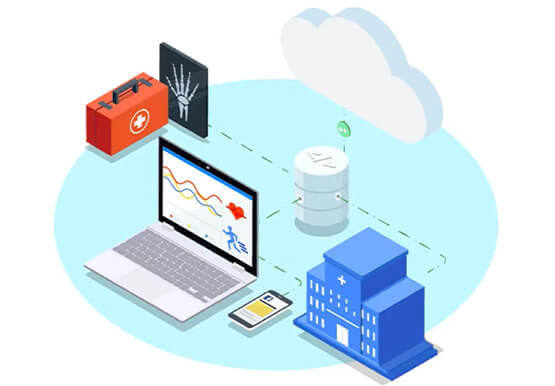


Hospitals Can Offer Interconnected Patient Experiences Using Google’s Natural Language Services
Machine Learning (ML) in healthcare helps extract data from conversations, medical records, forms, research reports, insurance claims and other documents across the care value-chain to help care providers have a holistic view of their patients to draw insights for diagnoses and treatments. With Natural Language Processing(NLP), healthcare organizations can program

Home Depot Leverages Google Cloud’s BigQuery and DataFlow to Break Data Silos and Craft Personalized CX
The Home Depot, Inc., is the world’s largest home improvement retailer with annual revenue of over $151B. Delighting our customers—whether do-it-yourselfers or professionals—by providing the home improvement products, services, and equipment rentals they need, when they need them, is key to our success. We operate more than 2,300 stores throughout

A Pre-ML Checklist That Will Save You Hours of Work
One of the toughest challenges for data scientists, and big data engineers is gathering, preparing, and transforming data, and creating data pipelines. Gathering data for a machine learning or big data initiative can be hard work. The mere act of getting it all together can leave data teams so excited

How Modern is Your Data Warehouse? Find Out With This Test
As more and more businesses turn to advanced data analytics to help them make smarter decisions, run real-time analytics, and improve business operations, an increasing number are modernizing their data warehouses to make it all possible. For many businesses, knowing how to modernize means understanding where their data warehouse sits
