





How 4K+ Coffee Lovers Get their Cuppa at Costa Coffee with the Help of Google Maps

3832
Of your peers have already read this article.
1:30 Minutes
The most insightful time you'll spend today!
Editor’s note: Gordon Lucas, Global Head of Digital Engineering at Costa Coffee, explains how Google Maps Platform helps direct customers to each of its 4,000 plus Costa Coffee shops across the world, as well as streamline payments, and optimize deliveries.
When brothers Sergio and Bruno Costa opened the first Costa Coffee in central London in 1971, they relied on word of mouth to grow trade. Personal recommendations encouraged people who lived and worked locally to visit the coffee shop and sample what became (and still remains) our signature blend coffee, Mocha Italia.
Fast forward 50 years and we have more than 4,000 coffee shops spread over 31 countries. To make it as easy as possible for our global customers to pick up a Mocha Italia, a Costa Americano, or any other Costa Coffee product wherever we operate, we decided to create a visual app. We wanted the app to help customers across the world find their most convenient eat-in, takeaway, drive-thru, partner store, or delivery platform, and highlight which services are available and at what times.

Enhancing the customer experience with intelligent maps
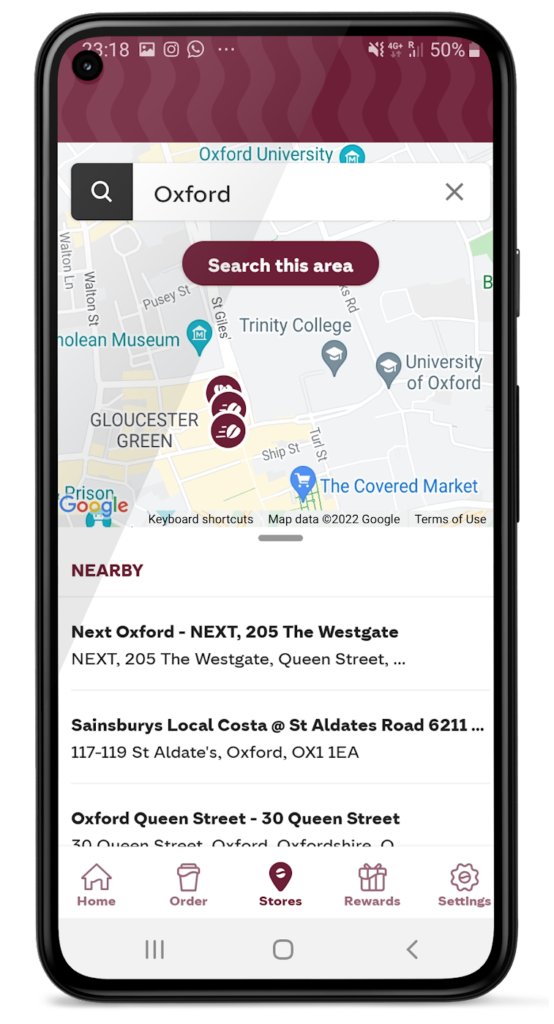
We were already using Google Maps Platform products on our website to provide our customers with a basic store locator service. So when we launched our mobile app in 2017, we added more interactive geospatial features to make our customers’ journeys quicker and easier.
We chose to enhance our existing Google Maps Platform solution because our developers enjoyed using it. Google Maps Platform offered all the capabilities we needed to boost our solutions, and we were excited to see how we’d be able to leverage geospatial data to improve the experience of our customers.
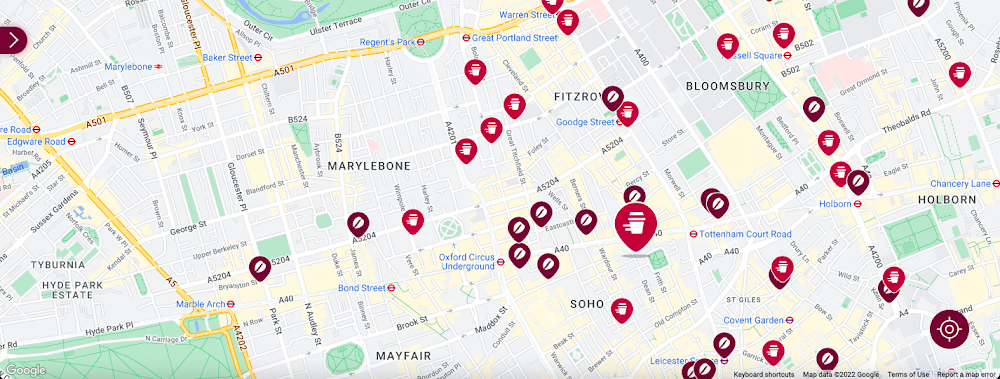
Our Google Cloud Premier Partner, Snowdrop Solutions, supported us in deploying all our requirements so the app’s new features could be rolled out globally. We wanted to direct pedestrians and vehicles to standalone Costa Coffee shops and kiosks in supermarkets and gas stations. We also wanted a dynamic map feature to highlight which locations offered click-and-collect, drive-thru, and delivery services. We then wanted to link these services to our online payments systems, seamlessly integrating our transaction process to make it as easy as possible for our customers.
To that end, we used the Maps Static API to embed maps within our app, and the Geocoding API to convert addresses into coordinates to create markers on our maps. We also use the Places API to allow customers to search for a Costa Coffee facility based on their location.
A new route for customer satisfaction
We had one issue when it came to locating Costa Coffee shops, however. We noticed that some customers were selecting the wrong store to collect orders. Fortunately, Google Maps Platform provided a quick fix that solved this issue. We updated the service to provide customers with a map of their collection point upon receipt of their order, remindIng them which store to collect from. A tweak like adding a map to a receipt improves customer satisfaction. The drop in calls to our customer service is testimony to this.
Geospatial intelligence became invaluable in the pandemic
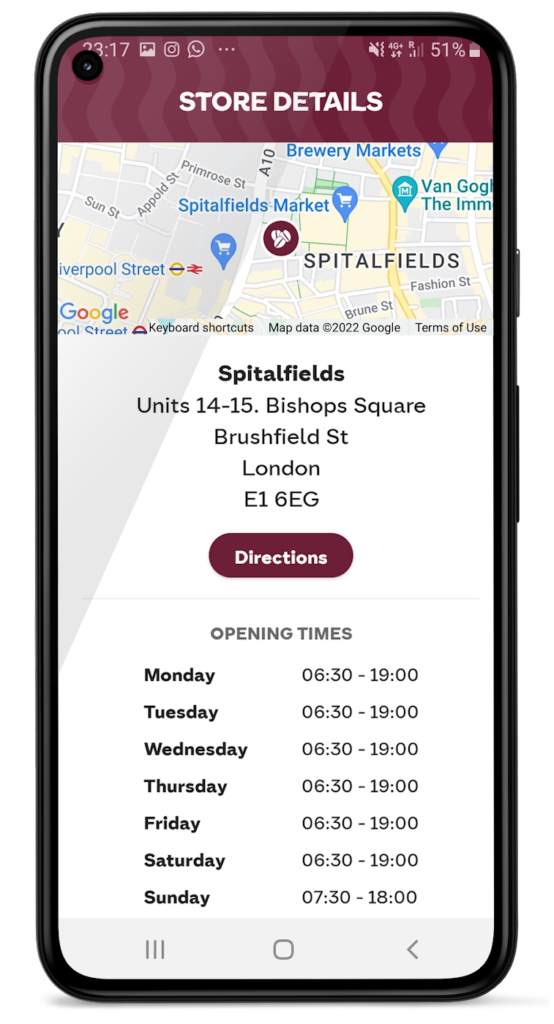
We had to adjust our service when the pandemic hit and Google Maps Platform was again instrumental in helping us. Because we had to comply with unique lockdown measures and travel restrictions across different locations, it could be challenging for our customers to stay up-to-date on the changing opening times and service guidelines of our shops. So we used Google Maps Platform Places API to show our customers which nearby stores, click-and-collect outlets, or drive-thrus were open, and when, during lockdowns.
Integrating this with our mobile ordering system also enabled us to promote COVID-safe contactless payments. Customers can locate a Costa Coffee shop, select, order, purchase, and collect their order or have it delivered to their cars without the need for any human contact. This reduces service wait times and minimizes the risk of transmission between customers and baristas. It also makes our employees feel more safe at work.
Geospatial data optimizes our entire operation
When the lockdown ended, our in-app order data showed a spike in demand, illustrating how much our customers miss their Costa Coffee experience. This data not only helps us to identify demand, it lets us track user preferences, informs where to direct supplies to meet a raised demand, and creates more accurate forecasts. This data can also help us manage costs.
Geospatial intelligence is also used to improve the experience of customers, from when they first look to order a cappuccino to when they arrive at the shop to enjoy it. We are using geomarketing to surface local offers. Say a Costa Coffee shop is trialing a new beverage, a pop-up can suggest users of our app try it next time they’re nearby.
Google Maps Platform has become integral to our digital operations. New features and capabilities of Google Maps Platform products have allowed us to continue innovating. The Costa Coffee footprint now spreads physically and digitally around the globe, and with the help of Google Maps Platform we can still offer the same tailored personal service that spurred the initial success of the Costa Brothers 50 years ago.
For more information on Google Maps Platform, visit our website.
Rethinking time management: Helping employees manage their time efficiently

3589
Of your peers have already read this article.
3:30 Minutes
The most insightful time you'll spend today!
As business leaders evaluate their hybrid work models, employee productivity is top of mind. They’re trying to understand how to balance organizational needs for productivity with employee needs for autonomy, flexibility, and work/life balance. In my role as Google’s Productivity Advisor, I help organizations and employees realize that being productive means working smartly and efficiently — not overworking. And one key to productivity is developing strong time management skills.
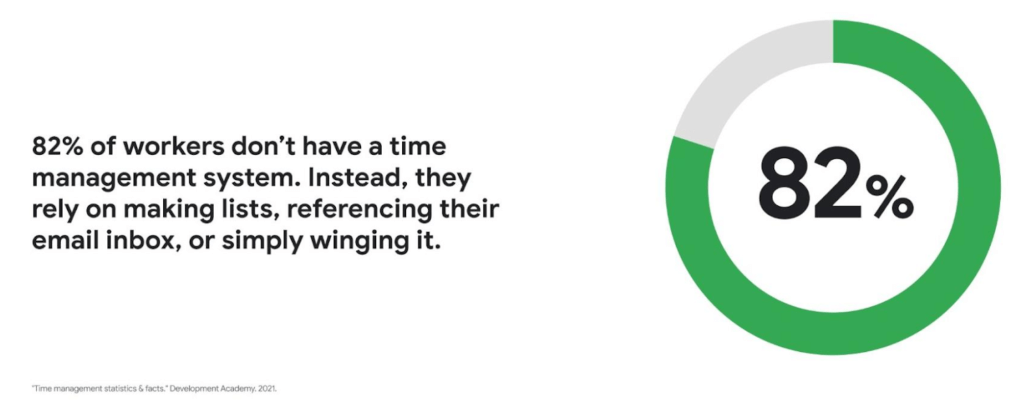
Recent research found that 82% of workers don’t have a proper time management system, however. Instead, they rely on making lists, referencing their inbox, or simply winging it. And the result is telling: 21% of people say “their work is never under control or only under control one day per week.”
Everyone works differently, and one of the best things about hybrid work is that it empowers people to work in their own way, at their own pace. However, if your employees are managing their time inefficiently over the long term, their risk of burnout increases — which can be bad news for employee wellbeing, morale and productivity.
In order for any hybrid work plan to be effective and your teams to be healthy, your employees need to build their time management muscle. You can help them do so with a three-step process:
- Understand how your employees are currently managing their time
- Encourage your employees to identify time management strengths and areas for improvement
- Empower your employees to maximize their time management practices
Step 1: Understanding your employees’ work habits
Before you can help your employees manage their time more effectively, you first need to understand how they spend it. To start, identify habits that might be preventing your employees from establishing productive workflows. For example, some employees might be working too much outside of business hours or spending the majority of their working hours in meetings.
While observation may help you glean some of this information, it’s best to go straight to the source. To find out if your employees feel they’re managing their time efficiently, simply ask them! You can distribute an anonymous questionnaire using a survey tool, like Google Forms, with questions like:
- Are you having trouble getting all your work done?
- Do you feel like you have enough independent working time?
- Do alerts and notifications interrupt or enhance your workflow?
- Which productivity and collaboration tools do you find the most and the least useful?
- How do you communicate best with your coworkers when working on- and off-site?
One major hurdle to effective time management can be too many meetings. To learn if meeting fatigue is plaguing your teams, include a survey question asking employees if they feel like they devote too much time to meetings. Help them get specific by encouraging them to use a tool like Time Insights. With this feature, employees can see exactly how much time they spend in meetings and how much focus time they schedule each week to accurately answer your survey.
Fielding an anonymous questionnaire is a great way to start your time management audit. The learnings that emerge can help you identify patterns in your workplace and among your teams — but they won’t reveal how individual employees work. For that, you’ll need to reach out to them directly.
Step 2: Identifying individual strengths to harness and areas for improvement
Once you have a general idea of how your team works, you can dig deeper into your individual employees’ time management methods and working styles. With this information, you can then help them identify the practices that work — and don’t work — for them.
Suggest to your employees that they spend a week observing their productivity patterns and time management methods. You might encourage people to look at:
- Their level of energy at different times during the day and/or on different days of the week
- The different types of work, such as strategic or administrative, they like doing and when
- How much time they spend doing work versus communicating about work
- How they feel during and after group meetings
- The amount of time they spend in deep-focus versus time spent switching among different tasks
If your organization uses digital timesheets, your employees can consult built-in, automatic time-tracking insights to see where they’re spending their time. Otherwise, you can easily create a custom time-tracking app using a no-code solution like AppSheet to help your employees measure the time they devote to their various responsibilities.
Once everyone has completed their weeklong study, set up dedicated meetings to review your employees’ observations with them individually. Armed with this new understanding, you and your employees can clarify when and how each person does their best work, identify areas for improvement, and start adjusting accordingly.
Step 3: Empowering your employees to flex their time management muscle
Now that you have clarity on how your employees spend their time, you can work with them to develop personal time management practices. To set them up for success, look for opportunities that take advantage of their strengths and offset their challenges — no matter how they like to work.
It’s important to remember there’s no one-size-fits-all solution to using time productively. Some workers love to tackle the most difficult tasks first thing in the morning; others feel more energized at the end of their day. Some people think best in conversation while others prefer to be alone with their thoughts. To help your employees develop time management practices that fit their working style, they need to feel empowered to decide how they can use their time and tools productively.
When it comes to time management, calendars are your best friend, so encourage your employees to take advantage of simple features. Google Calendar lets everyone see availability; by glancing at a shared calendar, coworkers will know when to reach out to someone (and when not to). You can also prompt your employees to block off quiet time during windows when they feel most productive, and use tools like Focus time to protect the time they need for heads-down work.
Email and chat are important, but they can also become a distraction if not used intentionally. Most people open email first thing in the morning, leave it open all day, and check it often. Instead, when you and your employees need to focus, try closing the email tab or using Gmail features to snooze and star emails to stay on task. The same approach applies to chat: check it strategically and turn off notifications when you need deep focus.
Finally, be intentional about building and maintaining trust with your teams as they develop new time management skills. If you decide to use Google Meet for regular check-ins, partner with your employees to develop meeting agendas directly inside Calendar invites to ensure your shared time will be used efficiently.
Valuing impact over output
Hybrid work offers an opportunity for business leaders to rethink their perspective on employee time management and what it means to be productive. Remember, the goal of building effective time management skills isn’t always to become more efficient so one can take on additional work. Often times, taking a step back helps us simplify how we work in order to deepen our impact. When you empower your employees to create a personal time management system, I think you’ll find they will be happier and healthier, with more to contribute to your organization.
Center for Internet Security’s Latest Benchmark for Securing Chrome
5390
Of your peers have already read this article.
1:30 Minutes
The most insightful time you'll spend today!
As the way people work continues to evolve, keeping security policies in place that protect organizations but give workers the ability to get things done is more important than ever. IT and security teams must aim to stay a step ahead of web-based security threats that come their organization’s way. To help, the Center for Internet Security (CIS) team has released the latest CIS Benchmark 2.1 for Google Chrome. This Benchmark offers independent recommendations on which Chrome policies to configure to help support organizations’ security and compliance needs. Thanks to Chrome being built with security at its core, in many cases, Chrome default settings are aligned with CIS recommendations.
Chrome is secure by default, but we also pride ourselves on providing customizations for enterprises to allow Chrome to better fit the needs of their business. And with hundreds of policies available through Chrome Browser Cloud Management and Group Policy Objects (Note: The CIS Benchmark is also available as a GPO), organizations can do just that.
Throughout the CIS guide you’ll notice that there are different designations for configuration profiles. Any labeled Level 1, are considered to be a good baseline for an organization. Level 2 profiles are recommended for deployments that require the highest level of security, but note that these settings could have a trade off on user productivity. We recommend looking at each setting and determining if it’s a good fit for your business.
The benchmark is made up of five sections:
- Enforced Defaults — Notes policies that are configured by default when you install Chrome. Enforcing these settings at an enterprise level can prevent these settings from being changed by business users to less secure options.
- Attack Surface Reduction — Details how to disable web features that may not be necessary in your enterprise environment and could reduce your overall attack surface.
- Privacy — Surfaces settings that improve user privacy.
- Data Loss Prevention — Contains settings that can help prevent data loss and protect your organization’s data. (Note: These recommendations cover additional capabilities that can be added to Chrome through BeyondCorp Enterprise).
- Forensics (Post Incident) — Shares recommendations on policies that give insights into post incident forensics and analysis.
Organizations can use these benchmarks to optimize the best way to secure Chrome in their environment. Download the CIS Benchmark here and check out our team’s configuration guide for additional recommendations on how to configure Chrome.
Note: This benchmark was created using a consensus review process composed of subject matter experts. Consensus participants provide perspective from a diverse set of backgrounds such as consulting, software development, audit and compliance, security research, operations, government, and legal. While these recommendations come from a trusted source, it’s important for each organization to weigh which policies make the most sense for their business.
Google Cloud’s Journey about Building DEI into Business

3885
Of your peers have already read this article.
1:30 Minutes
The most insightful time you'll spend today!
Diversity, equity, and inclusion (DEI) are more than buzzwords, they are critical components of workplace culture that have real, tangible impacts on your entire organization. Well-executed and robust DEI initiatives ensure that every single employee feels welcomed and valued when they are at work. And that’s not all—done right, DEI will create a thriving environment that fosters increased engagement, productivity, and ultimately, new innovation.
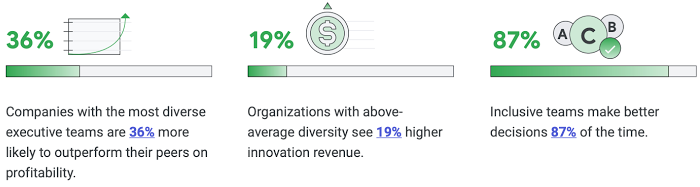
Now, more than ever there is more urgency to incorporate diversity and inclusion into every aspect of your business. Not only because it enhances your ability to be responsive to users and customers, but because it builds trust and a sense of belonging for your employees.
So, how do you build a representative workforce and inclusive teams?
Read our short eBook to learn steps you can take to build DEI into your business along with insights from our own journey at Google Cloud.
Why I Moved to the G Suite: Rentokil CIO

4454
Of your peers have already read this article.
2:13 Minutes
The most insightful time you'll spend today!
Whether it’s getting rid of pests, cleaning up a crime scene or tending to office plants, Rentokil Initial is a service business whose primary aim is to offer customers the best possible standard. This can only be achieved if teams work closely together, sharing expertise and ideas and communicating constantly.
We used to have 180 email domains and 40 mail systems in place, so finding contact details and responding quickly to colleagues was a challenge. To tackle this, in 2009, we moved 0 business users, including our ‘on the road’ service technicians and salespeople onto a single communications platform, G Suite.
Since switching to G Suite, we’ve saved millions of pounds (£) on IT maintenance and several hundred thousand pounds by cutting the time spent on administrative tasks through using tools such as Google Docs, Sites and Forms. For senior management, Google Hangouts Meet has also proved its worth, saving roughly 54 hours of the senior management’s time a week – that’s over 2,000 hours a year. In addition to maximizing productivity, online sharing through G Suite products has enabled us to spread knowledge and ideas organically across countries and divisions.
Individual teams have fully embraced the opportunity to share knowledge, using the group intranet, powered by Google Sites, to post training videos and access technical images. But it’s not all about official documents and meetings: online sharing is helping us to become a more personal, sociable organization, which is important for staff retention and working culture. Colleagues use our intranet to share personal achievements, from sleeping on the streets for a homeless charity to boxing in international championships, giving a true flavor of the diversity within the company.
Employees at all levels are embracing G Suite to connect with colleagues. For example, our UK Managing Director uses Google+ to post updates and pictures of his ‘road trips’ across the UK and his encounters with colleagues, from the CFO to our longest standing pest control technicians, providing new insight into his role in the business. The ability to connect directly with our executives and create communities amongst our new employees is radically changing and modernizing the culture of our company.
All in all, we’ve been amazed by the journey which G Suite has taken us on, connecting our teams no matter where they are and no matter what they’re doing and making a difference in almost every corner of our business. Thanks to Google we see ourselves as better connected, able to offer a better service to customers and more competitive on a global scale.
CARTO’s Data Visualization Powered by Google Cloud and deck.g

4084
Of your peers have already read this article.
7:00 Minutes
The most insightful time you'll spend today!
Editor’s note: Today’s blog post is from Alberto Asuero, CTO of CARTO, the location intelligence platform. Today he shares more details about the source of the data for advanced data visualizations created with Google Maps Platform and deck.gl and how the CARTO platform enables this workflow.
During Google Cloud Next in October, the Google team announced the newest release of the deck.gl visualization library, thanks to a collaboration with our geospatial company CARTO and the vis.gl Technical Steering Committee (TSC). The deck.gl release includes a deep integration with the new WebGL-powered features in the Maps JavaScript API that allows deck.gl to render 2D and 3D visualizations directly on the Google basemap.
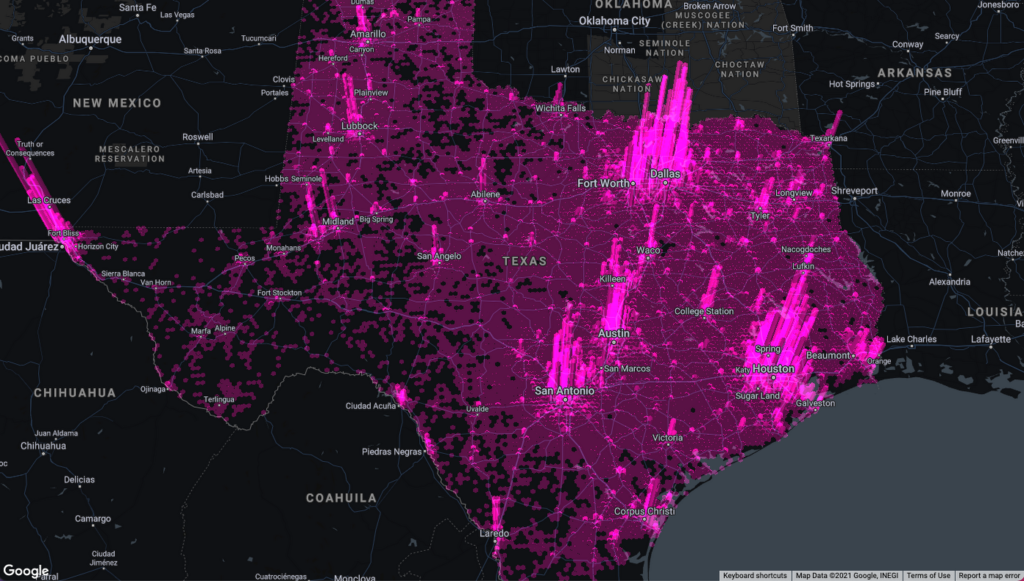
Our team built an example app that visualizes a variety of data sources that show the potential for electrification of truck fleets in Texas. This app showcases the different types of advanced data visualizations that can be created with Google Maps Platform and deck.gl. Today, I want to share more details about the source of the data for these visualizations and how the CARTO platform enables this workflow.
Google Cloud provides a strong serverless data warehousing solution, BigQuery, with support for geospatial queries. When you are dealing with spatial data, creating maps to explore and visualize these datasets is an important and common need. The CARTO Spatial Extension for BigQuery provides an easy way to create connections to the data warehouse, design a map with data coming from BigQuery tables, and then add these visualizations to a web app using deck.gl.
Making a simple map
To create a simple map using the CARTO platform, you can sign up for a trial account. Once you have signed in, you can set up a connection to your BigQuery instance using a service account. Then, you can go to the Data Explorer and browse the available datasets to find the table you want to use as the datasource in your map. For more information, check out the CARTO documentation.
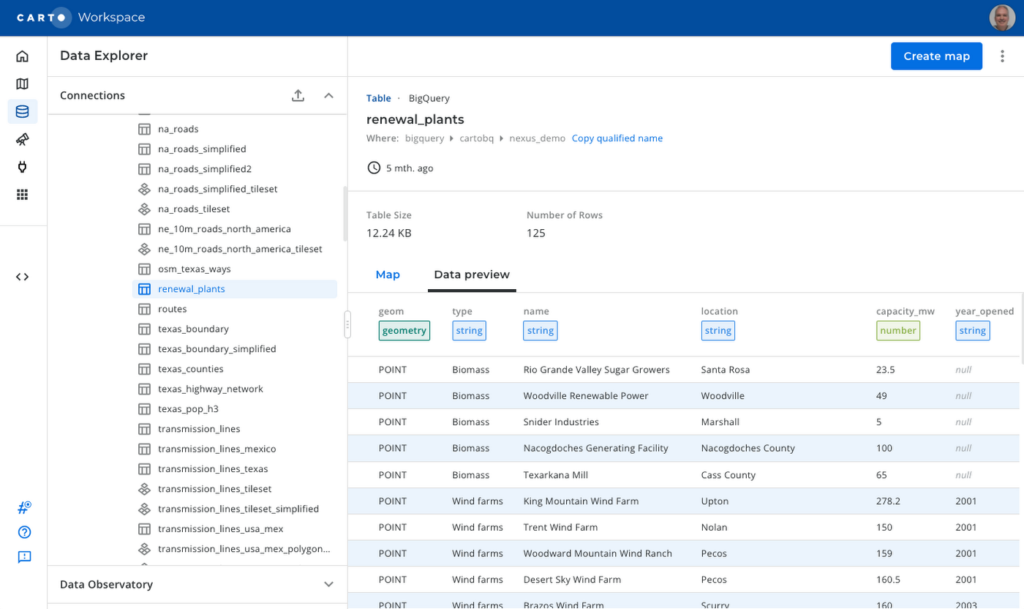
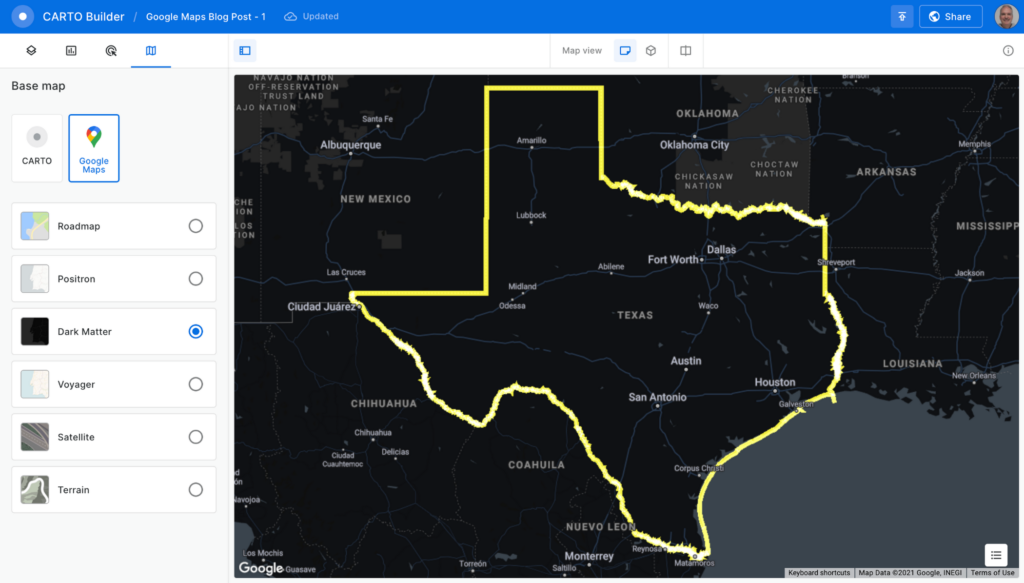
To create a visualization of power transmission lines in Texas, you can start with the Texas state boundary to provide some context. In the Data Explorer, you can preview the table and click the “Create map” button in the top-right corner to start designing your visualization.
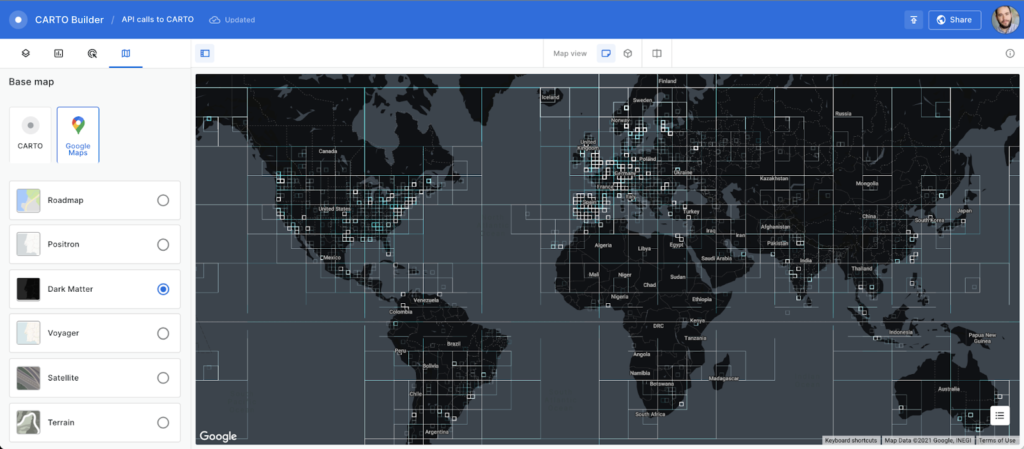
Using the CARTO Builder map making tool, select one of the available Google vector basemap styles and customize the layer style.
You can visualize tables and the results from queries executed in the data warehouse, which is a powerful feature because you can also execute spatial analysis functions using SQL, including those from the CARTO Analytics Toolbox. In this case, you can intersect the lines in the table containing all the U.S. transmission lines within the Texas boundary. Click on the “Add source from…” button and select the “Custom Query (SQL)” option to add the following query:
SELECT *FROM cartobq.nexus_demo.transmission_linesWHERE ST_INTERSECTS(geometry,(SELECT geom FROM cartobq.nexus_demo.texas_boundary_simplified));
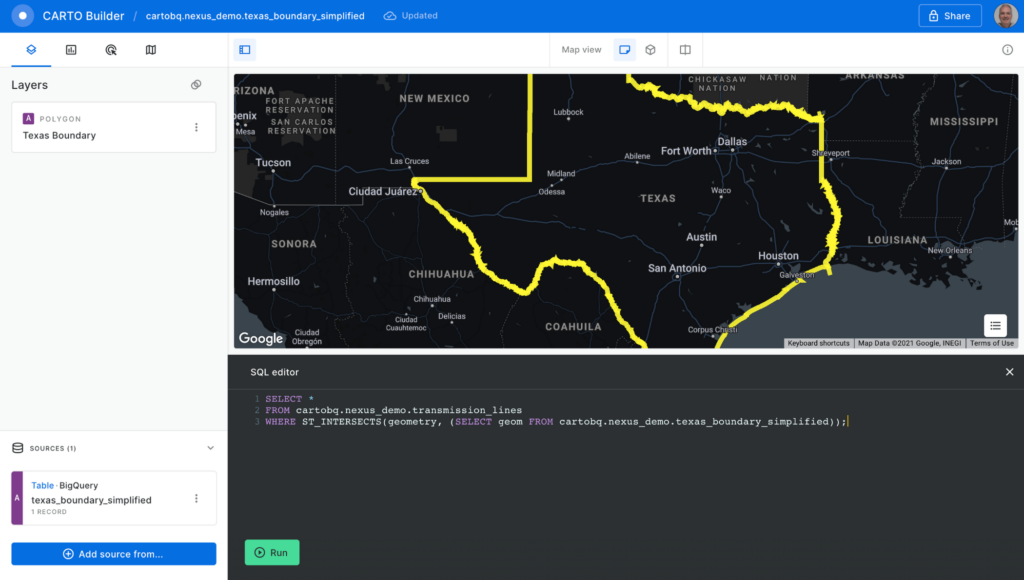
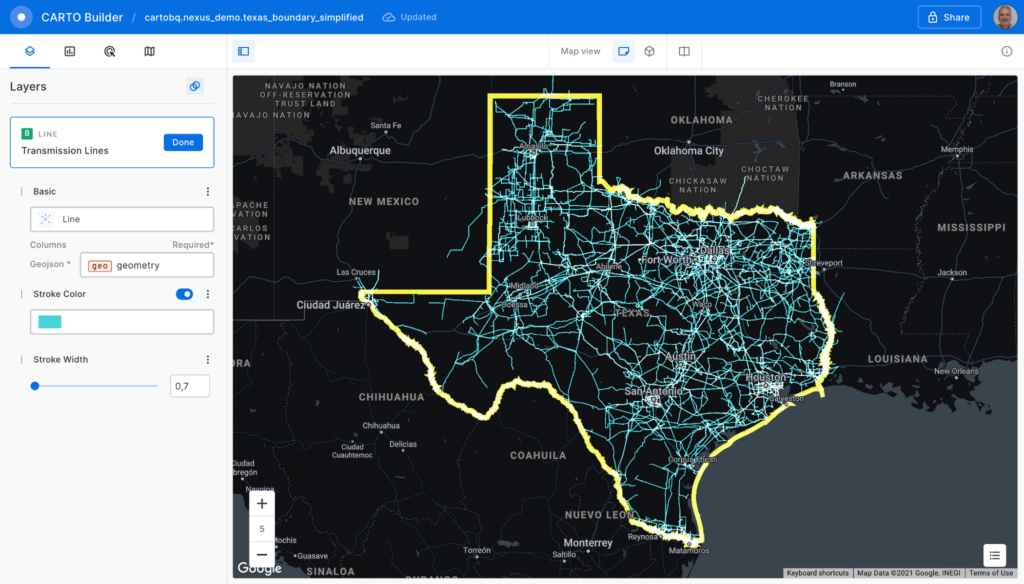
Click the “Run” button, and the query is executed in BigQuery. The results are sent back to the Builder tool. Perform some style customizations in the new layer, and your map is ready.
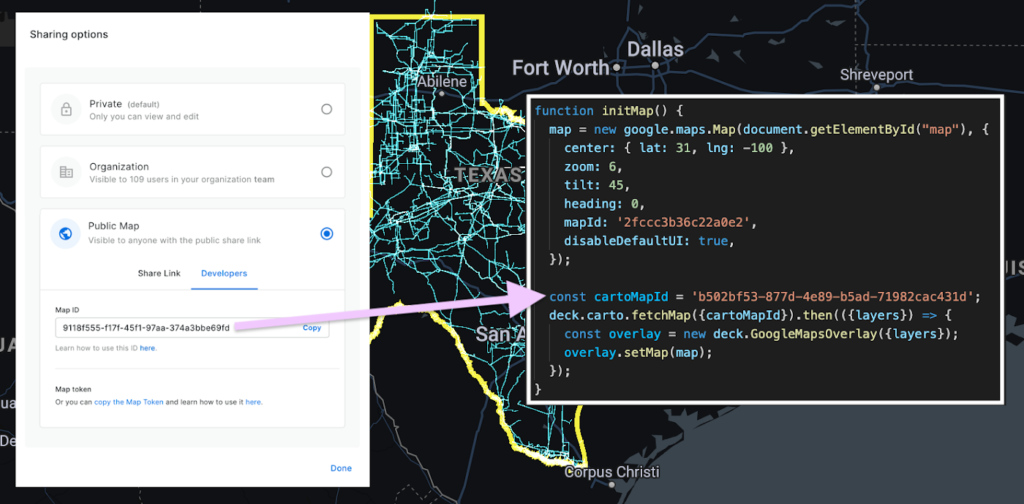
Before adding the map to the Google Maps Platform application, you’ll need to make it public. Click on the “Share” button and select the “Developers” tab to copy the map ID.
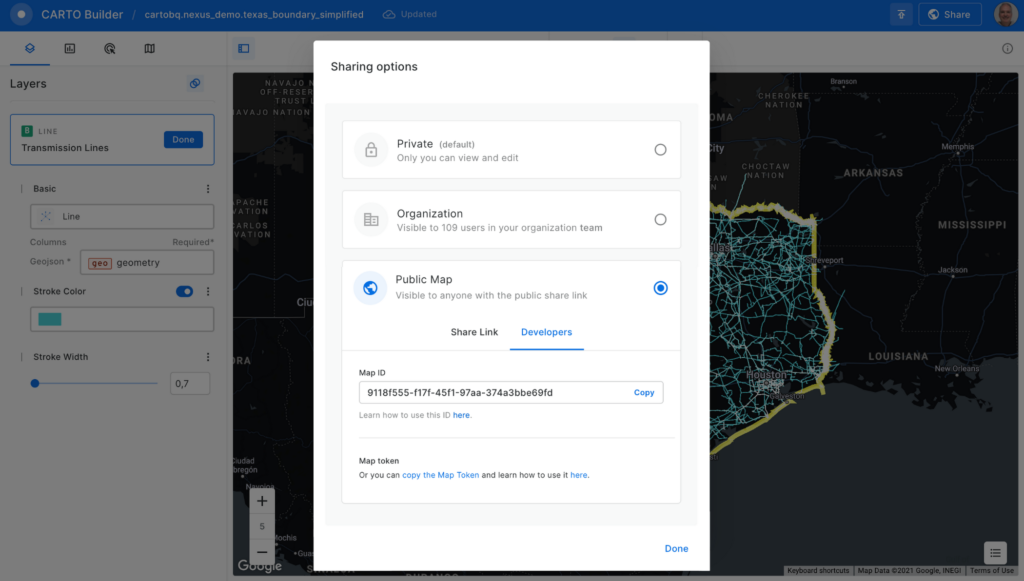
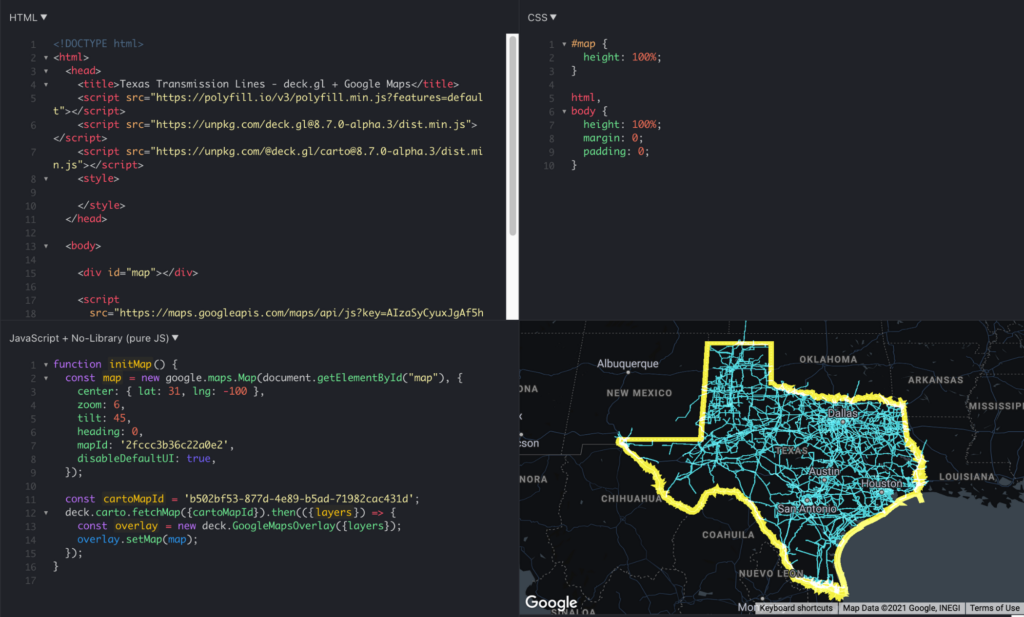
Now, you can add the visualization into your Google Maps Platform application, which is as easy as adding these four lines of code:
const cartoMapId = 'b502bf53-877d-4e89-b5ad-71982cac431d'; deck.carto.fetchMap({cartoMapId}).then(({layers}) => { const overlay = new deck.GoogleMapsOverlay({layers}); overlay.setMap(map); });
You can use the map ID copied from CARTO Builder to call the fetchMap function. This function connects to the platform and retrieves all the information needed for the visualization, including a collection of deck.gl layers with all the styling properties you’ve specified. Create an instance of the deck.gl GoogleMapsOverlay with this collection of layers and add it to the map.
You can see the full example in this fiddle.
Visualizing very large datasets
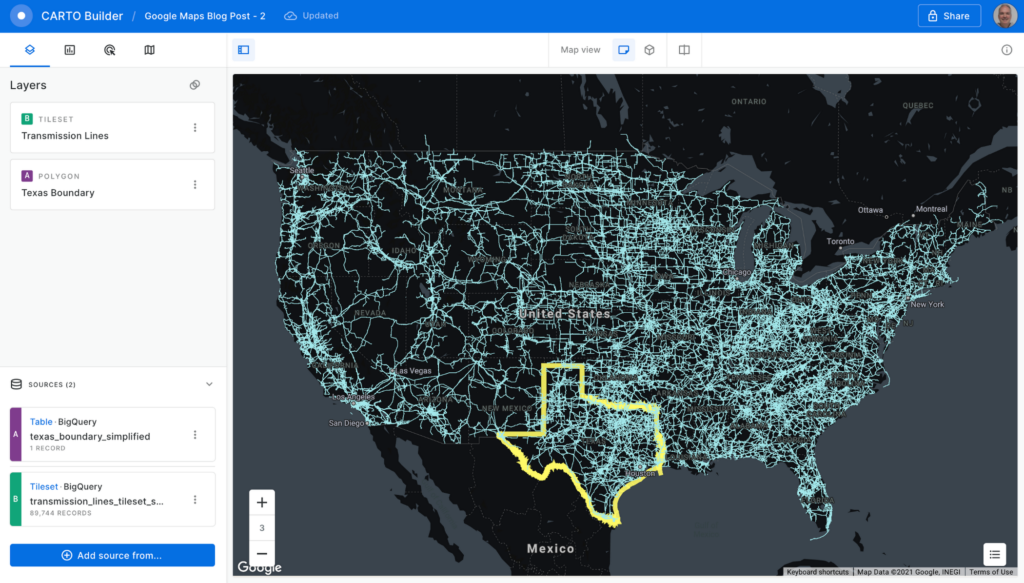
One of the main features of BigQuery is the ability to scale processing to massive datasets. With the CARTO platform, you can also visualize very large datasets using tilesets, an optimized data structure containing pre-generated vector tiles for fast visualization. Tilesets are generated within BigQuery using the Analytics Toolbox functions in a parallelized process that can handle billions of points.
For example, you can create a visualization using tilesets with the whole dataset of transmission lines for the U.S., more than 100MB of geometries.
The issue with these large datasets is that they do not fit in memory all at once, so you need to split them into tiles for them to be rendered progressively. CARTO takes care of this, allowing you to create tilesets directly in BigQuery or dynamically generate them on the fly.
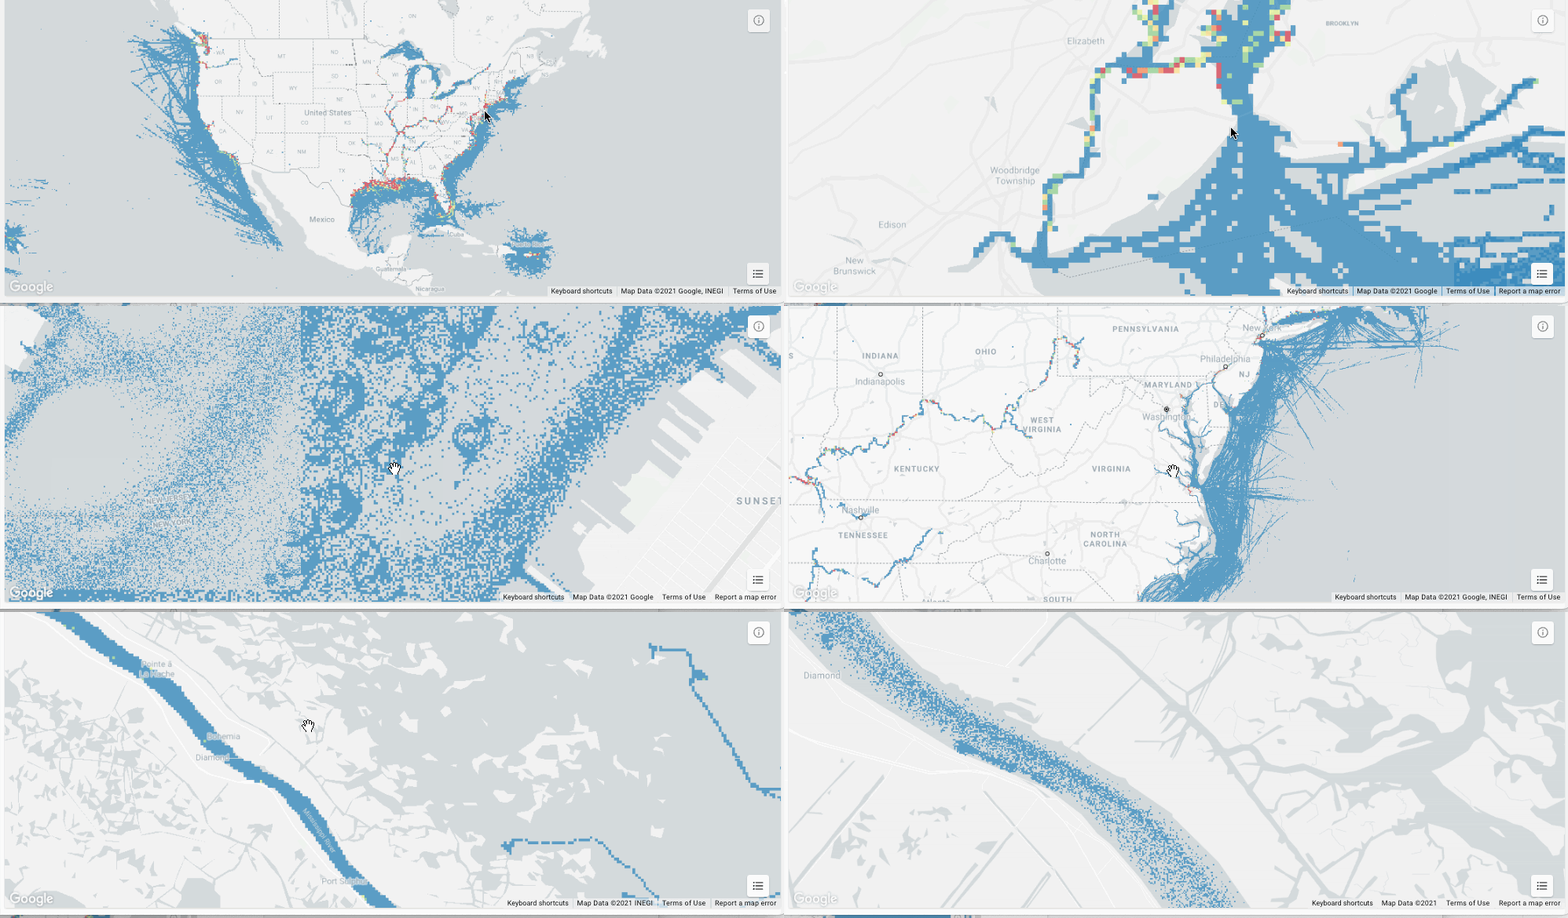
This method for data loading in maps can scale as much as needed; for example, take a look at this 17 billion point visualization of vessel data.
What about live data?
BigQuery supports streaming data that is continuously updated. In these scenarios, you want to be able to update your visualization at regular intervals, as the data changes. It’s easy to update this visualization using deck.gl. You just need to set the autoRefresh parameter to true when fetching the map and specify the function you want to execute when new data is downloaded:
const {layers} = await deck.carto.fetchMap({ cartoMapId, autoRefresh: true, onNewData: (parsedMap) => { … } });
You can add points to a table with an INSERT function on the BigQuery console and see the data updated on the map in real time.
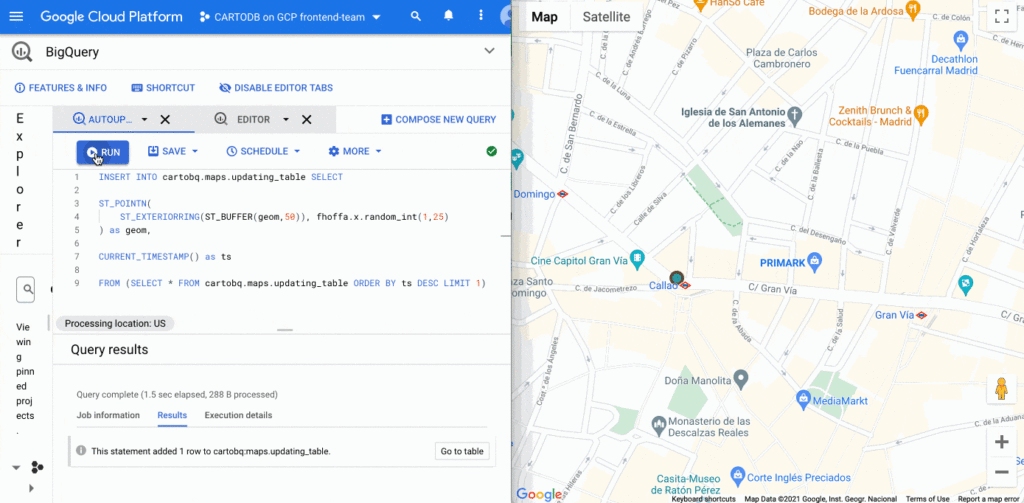
Going further
In addition to the simple ways to create visualizations shown above, deck.gl has the flexibility to create a wide variety of visualizations. The CARTO platform provides you with the functionality to access data from your data warehouse and create these data visualizations with advanced cartographic capabilities, but you can extend it and go beyond that using any of the advanced visualizations available in the deck.gl layer catalog.
There are two additional options that give you more control over the deck.gl code. The first one is to use the CartoLayer directly without fetchMap. You’ll need to indicate the connection to use from the CARTO platform and the data source type and name or query. Then we can specify the styling properties.
const overlay = new deck.GoogleMapsOverlay({layers: [new deck.carto.CartoLayer({connection: 'bqconn',type: deck.carto.MAP_TYPES.TABLE,data: `cartobq.public_account.retail_stores`,getFillColor: [238, 77, 90],pointRadiusMinPixels: 6,}),],});
The second option is to use the fetchLayerData function that allows you to have more control over the format used for data transfer between BigQuery and your application and can be used with advanced visualizations that require an specific data format like ArcLayer, H3HexagonLayer or TripsLayer.
deck.carto.fetchLayerData({type: deck.carto.MAP_TYPES.TABLE,source: `cartobq.geo_for_good_meetup.texas_pop_h3`,connection: 'bqconn',format: deck.carto.FORMATS.JSON,credentials: {accessToken: 'eyJhbGciOiJIUzI1NiJ9.eyJhIjoiYWNfbHFlM3p3Z3UiLCJqdGkiOiI1YjI0OWE2ZCJ9.Y7zB30NJFzq5fPv8W5nkoH5lPXFWQP0uywDtqUg8y8c'}}).then(({data}) => {const layers= [new deck.H3HexagonLayer({id: 'h3-hexagon-layer',data,extruded: true,getHexagon: d => d.h3,getFillColor: [182, 0, 119, 150],getElevation: d => d.pop,elevationScale: 2.5,parameters: {blendFunc: [luma.GL.SRC_ALPHA, luma.GL.DST_ALPHA],blendEquation: luma.GL.FUNC_ADD}})];const overlay = new deck.GoogleMapsOverlay({layers});overlay.setMap(map);});
For complete code using both options, take a look at these examples.
Learn more
You can access demos and documentation on the deck.gl docs website and the CARTO Documentation Center. If you have questions, you can ping the CARTO team on the CARTO Users Slack workspace.
For more information on Google Maps Platform, visit the Google Maps Platform website.
More Relevant Stories for Your Company
Guide to Google’s Underwater Infrastructure
From data centers and cloud regions to subsea cables, Google is committed to connecting the world. Our investments in infrastructure aim to further improve our network—one of the world’s largest—which helps improve global connectivity, supporting users and Google Cloud customers. Our subsea cables play a starring role in this work,




Video: How Google App Maker Helps Businesses Build Mobile Apps in No Time
Analysts estimate that the right custom mobile app can save each employee 7.5 hours per week (that’s a week’s worth of lunch breaks!). Yet, too few businesses have the means, let alone the resources, to invest time and effort in building customized mobile apps. Why? That's because their budgets center on
Taking Maps Further: New Website Experience for Product Discovery, Budgeting and Access to Dev Documentation
For more than 15 years, developers have used Google Maps Platform to deliver location-based experiences to their end users and used location intelligence to optimize their businesses. Along this journey, we’ve made a variety of changes to better support our community as needs have changed and new industries and technologies

Iroquois Healthcare Association Leverages Chrome OS to Keep Staff, Patients and Families Remotely Connected
Editor’s note: Today’s post is by Eileen Murphy, Senior Director of Special Projects, and Andrew Nault, Director of Business Development, both from Iroquois Healthcare Association Workforce Investment Organization (IHA WIO). The health association represents 44 hospitals in 32 counties in New York State, providing advocacy, cost-saving initiatives, and business solutions. IHA
