





CARTO’s Data Visualization Powered by Google Cloud and deck.g

4090
Of your peers have already read this article.
7:00 Minutes
The most insightful time you'll spend today!
Editor’s note: Today’s blog post is from Alberto Asuero, CTO of CARTO, the location intelligence platform. Today he shares more details about the source of the data for advanced data visualizations created with Google Maps Platform and deck.gl and how the CARTO platform enables this workflow.
During Google Cloud Next in October, the Google team announced the newest release of the deck.gl visualization library, thanks to a collaboration with our geospatial company CARTO and the vis.gl Technical Steering Committee (TSC). The deck.gl release includes a deep integration with the new WebGL-powered features in the Maps JavaScript API that allows deck.gl to render 2D and 3D visualizations directly on the Google basemap.
Our team built an example app that visualizes a variety of data sources that show the potential for electrification of truck fleets in Texas. This app showcases the different types of advanced data visualizations that can be created with Google Maps Platform and deck.gl. Today, I want to share more details about the source of the data for these visualizations and how the CARTO platform enables this workflow.
Google Cloud provides a strong serverless data warehousing solution, BigQuery, with support for geospatial queries. When you are dealing with spatial data, creating maps to explore and visualize these datasets is an important and common need. The CARTO Spatial Extension for BigQuery provides an easy way to create connections to the data warehouse, design a map with data coming from BigQuery tables, and then add these visualizations to a web app using deck.gl.
Making a simple map
To create a simple map using the CARTO platform, you can sign up for a trial account. Once you have signed in, you can set up a connection to your BigQuery instance using a service account. Then, you can go to the Data Explorer and browse the available datasets to find the table you want to use as the datasource in your map. For more information, check out the CARTO documentation.
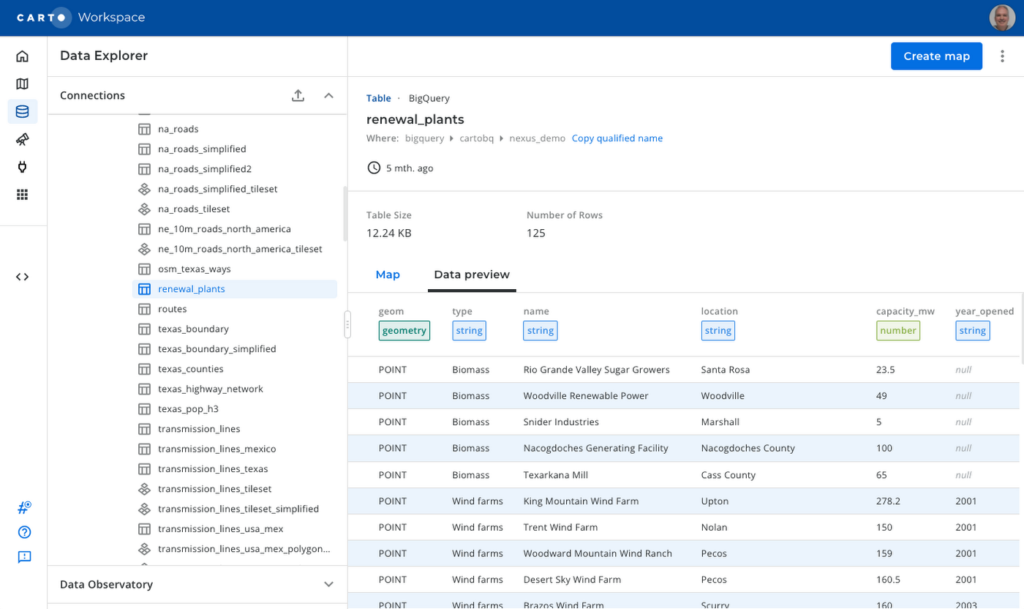
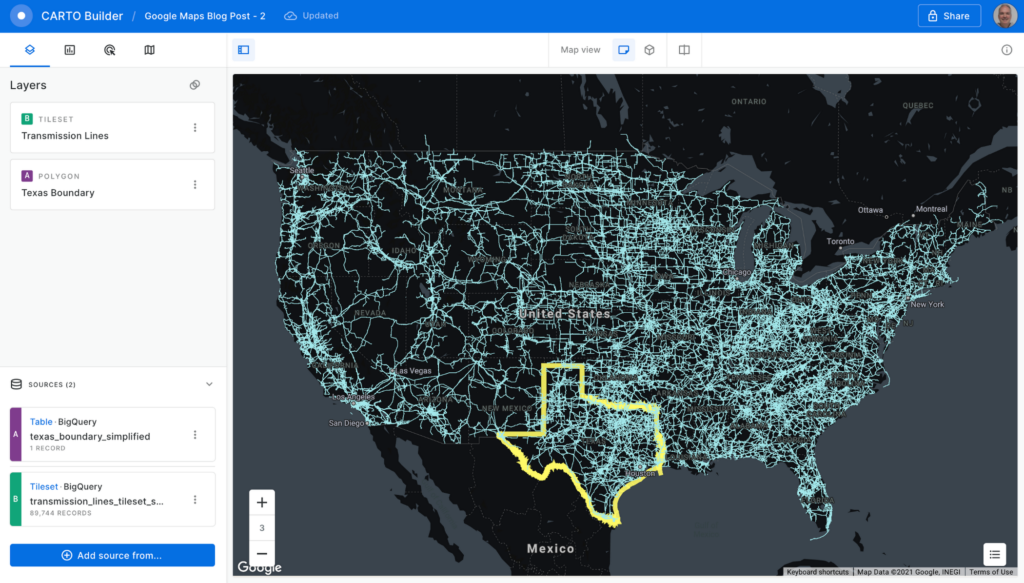
To create a visualization of power transmission lines in Texas, you can start with the Texas state boundary to provide some context. In the Data Explorer, you can preview the table and click the “Create map” button in the top-right corner to start designing your visualization.
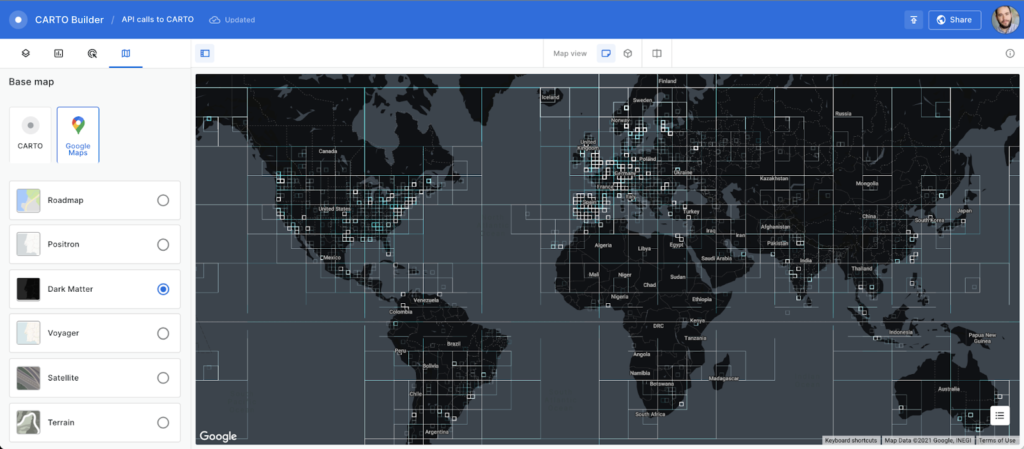
Using the CARTO Builder map making tool, select one of the available Google vector basemap styles and customize the layer style.
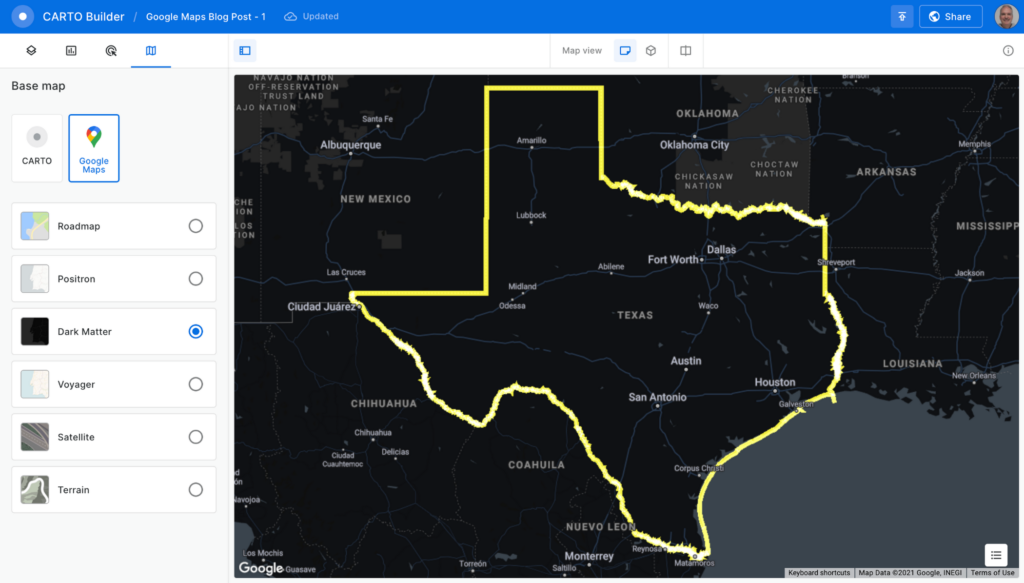
You can visualize tables and the results from queries executed in the data warehouse, which is a powerful feature because you can also execute spatial analysis functions using SQL, including those from the CARTO Analytics Toolbox. In this case, you can intersect the lines in the table containing all the U.S. transmission lines within the Texas boundary. Click on the “Add source from…” button and select the “Custom Query (SQL)” option to add the following query:
SELECT *FROM cartobq.nexus_demo.transmission_linesWHERE ST_INTERSECTS(geometry,(SELECT geom FROM cartobq.nexus_demo.texas_boundary_simplified));
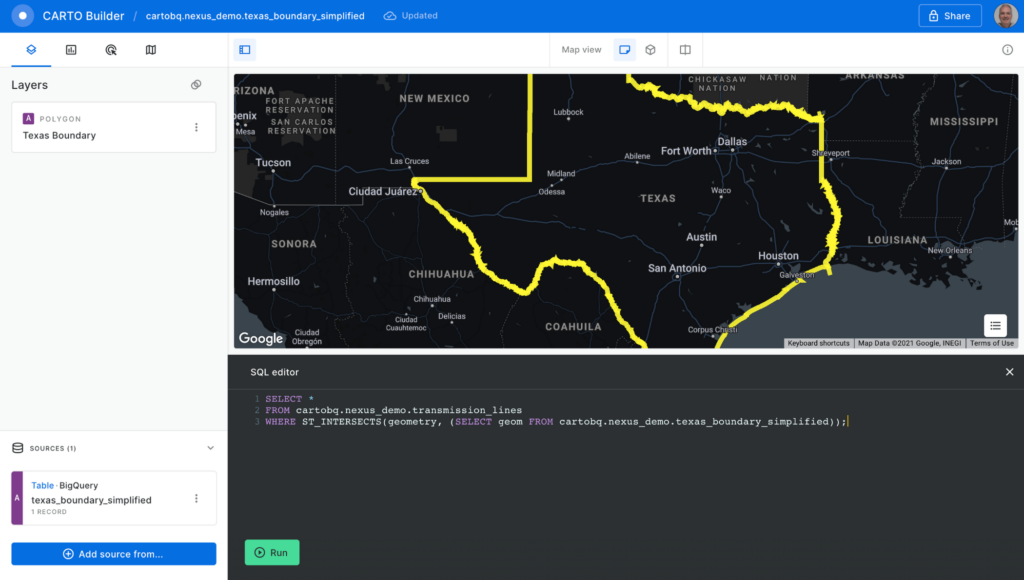
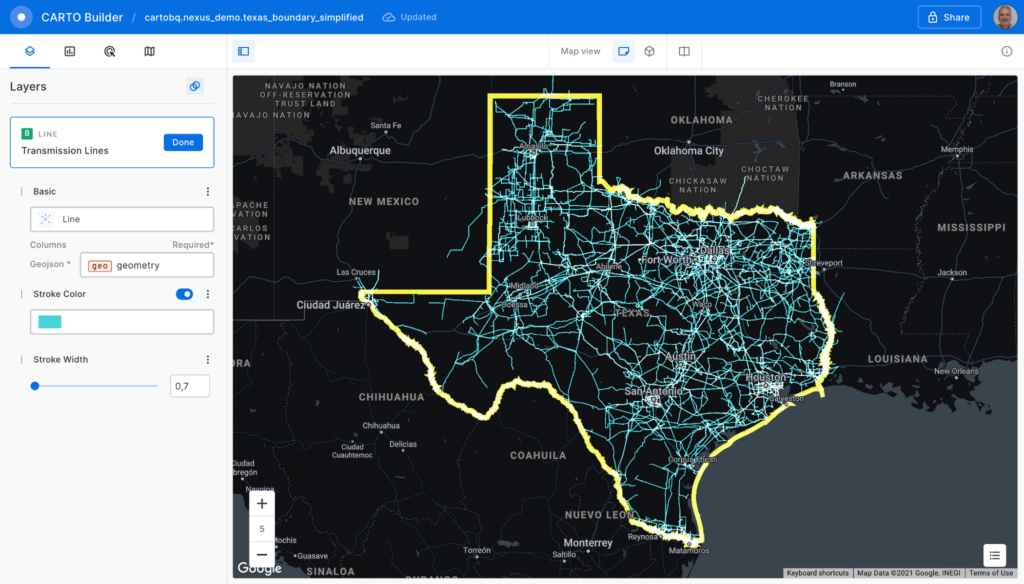
Click the “Run” button, and the query is executed in BigQuery. The results are sent back to the Builder tool. Perform some style customizations in the new layer, and your map is ready.
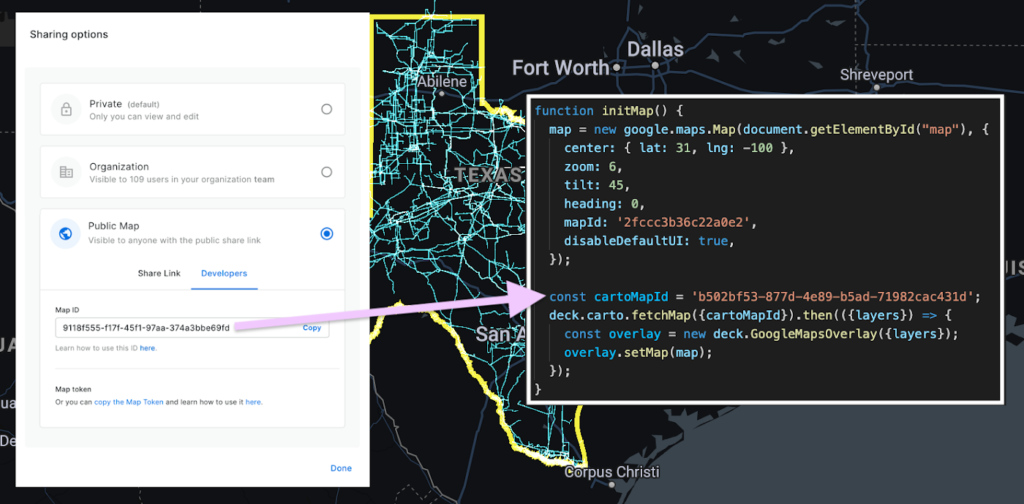
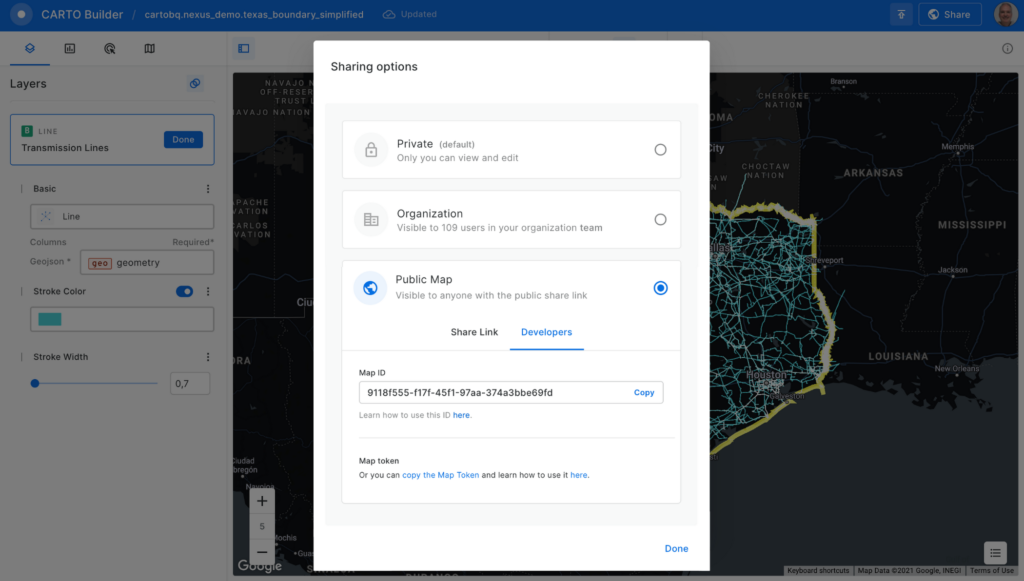
Before adding the map to the Google Maps Platform application, you’ll need to make it public. Click on the “Share” button and select the “Developers” tab to copy the map ID.
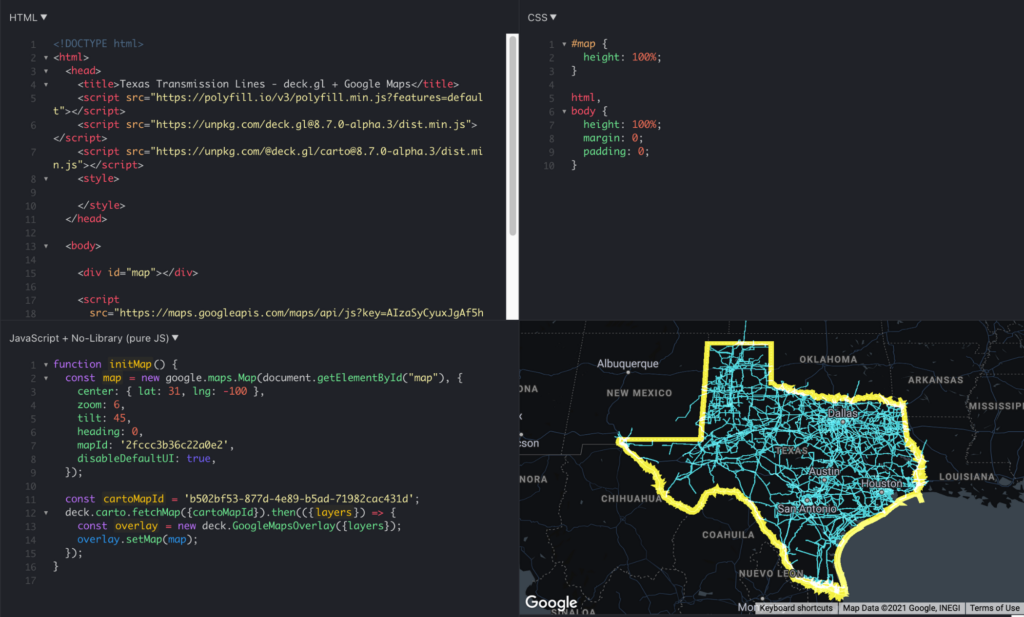
Now, you can add the visualization into your Google Maps Platform application, which is as easy as adding these four lines of code:
const cartoMapId = 'b502bf53-877d-4e89-b5ad-71982cac431d'; deck.carto.fetchMap({cartoMapId}).then(({layers}) => { const overlay = new deck.GoogleMapsOverlay({layers}); overlay.setMap(map); });
You can use the map ID copied from CARTO Builder to call the fetchMap function. This function connects to the platform and retrieves all the information needed for the visualization, including a collection of deck.gl layers with all the styling properties you’ve specified. Create an instance of the deck.gl GoogleMapsOverlay with this collection of layers and add it to the map.
You can see the full example in this fiddle.
Visualizing very large datasets
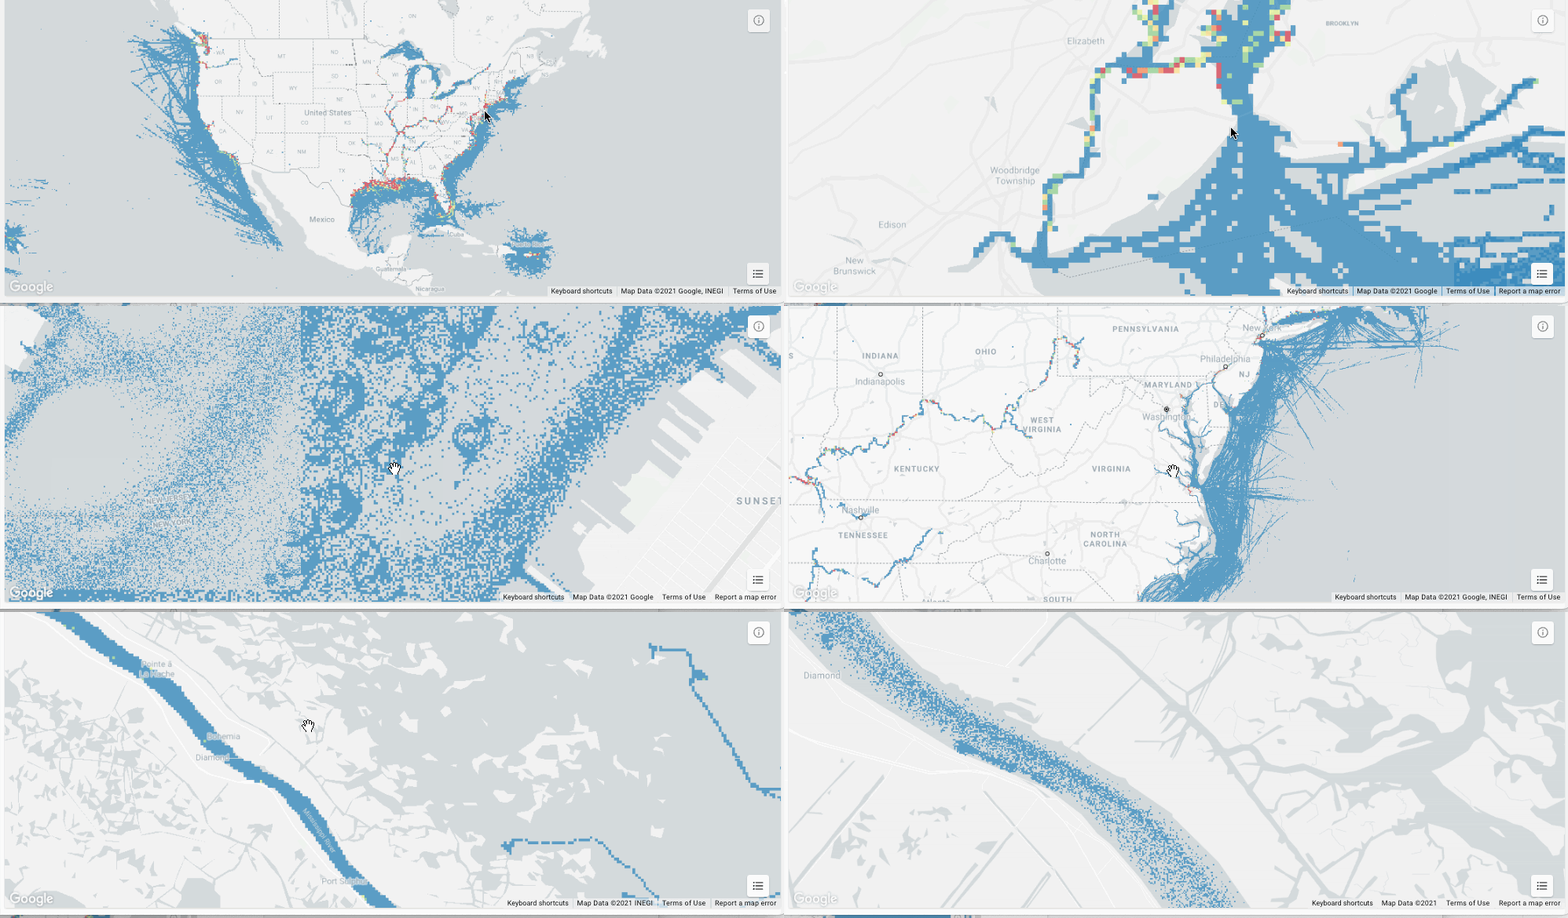
One of the main features of BigQuery is the ability to scale processing to massive datasets. With the CARTO platform, you can also visualize very large datasets using tilesets, an optimized data structure containing pre-generated vector tiles for fast visualization. Tilesets are generated within BigQuery using the Analytics Toolbox functions in a parallelized process that can handle billions of points.
For example, you can create a visualization using tilesets with the whole dataset of transmission lines for the U.S., more than 100MB of geometries.
The issue with these large datasets is that they do not fit in memory all at once, so you need to split them into tiles for them to be rendered progressively. CARTO takes care of this, allowing you to create tilesets directly in BigQuery or dynamically generate them on the fly.
This method for data loading in maps can scale as much as needed; for example, take a look at this 17 billion point visualization of vessel data.
What about live data?
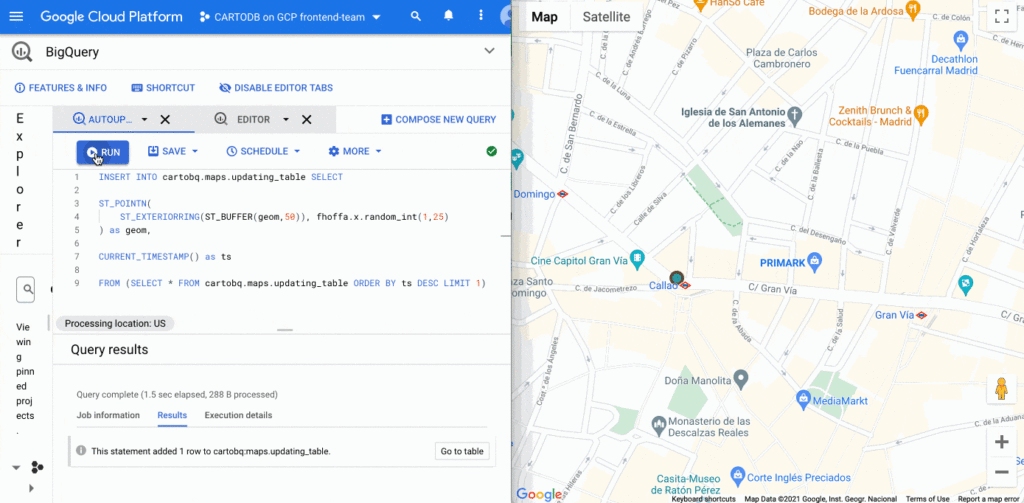
BigQuery supports streaming data that is continuously updated. In these scenarios, you want to be able to update your visualization at regular intervals, as the data changes. It’s easy to update this visualization using deck.gl. You just need to set the autoRefresh parameter to true when fetching the map and specify the function you want to execute when new data is downloaded:
const {layers} = await deck.carto.fetchMap({ cartoMapId, autoRefresh: true, onNewData: (parsedMap) => { … } });
You can add points to a table with an INSERT function on the BigQuery console and see the data updated on the map in real time.
Going further
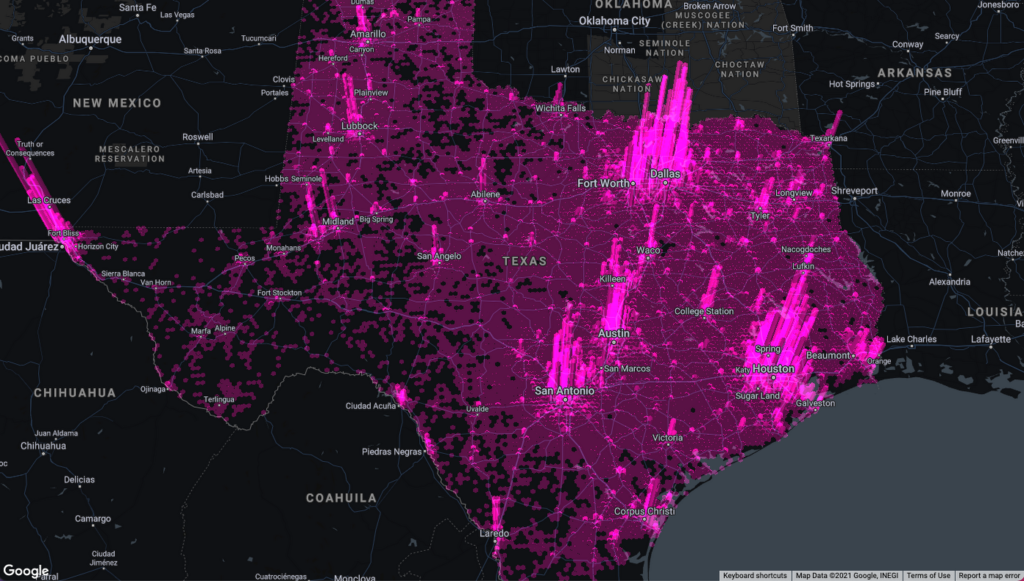
In addition to the simple ways to create visualizations shown above, deck.gl has the flexibility to create a wide variety of visualizations. The CARTO platform provides you with the functionality to access data from your data warehouse and create these data visualizations with advanced cartographic capabilities, but you can extend it and go beyond that using any of the advanced visualizations available in the deck.gl layer catalog.
There are two additional options that give you more control over the deck.gl code. The first one is to use the CartoLayer directly without fetchMap. You’ll need to indicate the connection to use from the CARTO platform and the data source type and name or query. Then we can specify the styling properties.
const overlay = new deck.GoogleMapsOverlay({layers: [new deck.carto.CartoLayer({connection: 'bqconn',type: deck.carto.MAP_TYPES.TABLE,data: `cartobq.public_account.retail_stores`,getFillColor: [238, 77, 90],pointRadiusMinPixels: 6,}),],});
The second option is to use the fetchLayerData function that allows you to have more control over the format used for data transfer between BigQuery and your application and can be used with advanced visualizations that require an specific data format like ArcLayer, H3HexagonLayer or TripsLayer.
deck.carto.fetchLayerData({type: deck.carto.MAP_TYPES.TABLE,source: `cartobq.geo_for_good_meetup.texas_pop_h3`,connection: 'bqconn',format: deck.carto.FORMATS.JSON,credentials: {accessToken: 'eyJhbGciOiJIUzI1NiJ9.eyJhIjoiYWNfbHFlM3p3Z3UiLCJqdGkiOiI1YjI0OWE2ZCJ9.Y7zB30NJFzq5fPv8W5nkoH5lPXFWQP0uywDtqUg8y8c'}}).then(({data}) => {const layers= [new deck.H3HexagonLayer({id: 'h3-hexagon-layer',data,extruded: true,getHexagon: d => d.h3,getFillColor: [182, 0, 119, 150],getElevation: d => d.pop,elevationScale: 2.5,parameters: {blendFunc: [luma.GL.SRC_ALPHA, luma.GL.DST_ALPHA],blendEquation: luma.GL.FUNC_ADD}})];const overlay = new deck.GoogleMapsOverlay({layers});overlay.setMap(map);});
For complete code using both options, take a look at these examples.
Learn more
You can access demos and documentation on the deck.gl docs website and the CARTO Documentation Center. If you have questions, you can ping the CARTO team on the CARTO Users Slack workspace.
For more information on Google Maps Platform, visit the Google Maps Platform website.
A Breakdown of Cloud-based Data Ingestion Practices

8835
Of your peers have already read this article.
3:00 Minutes
The most insightful time you'll spend today!
Businesses around the globe are realizing the benefits of replacing legacy data silos with cloud-based enterprise data warehouses, including easier collaboration across business units and access to insights within their data that were previously unseen. However, bringing data from numerous disparate data sources into a single data warehouse requires you to develop pipelines that ingest data from these various sources into your enterprise data warehouse. Historically, this has meant that data engineering teams across the organization procure and implement various tools to do so. But this adds significant complexity to managing and maintaining all these pipelines and makes it much harder to effectively scale these efforts across the organization. Developing enterprise-grade, cloud-native pipelines to bring data into your data warehouse can alleviate many of these challenges. But, if done incorrectly, these pipelines can present new challenges that your teams will have to spend their time and energy addressing.
Developing cloud-based data ingestion pipelines that replicate data from various sources into your cloud data warehouse can be a massive undertaking that requires significant investment of staffing resources. Such a large project can seem overwhelming and it can be difficult to identify where to begin planning such a project. We have defined the following principles for data pipeline planning to begin the process. These principles are intended to help you answer key business questions about your effort and begin to build data pipelines that address your business and technical needs. Each section below details a principle of data pipelines and certain factors your teams should consider as they begin developing their pipelines.
Principle 1: Clarify your objectives
The first principle to consider for pipeline development is clarify your objectives. This can be broadly defined as taking a holistic approach to pipeline development that encompasses requirements from several perspectives: technical teams, regulatory or policy requirements, desired outcomes, business goals, key timelines, available teams and their skill sets, and downstream data users. Clarifying your objectives clearly identifies and defines requirements from each key stakeholder at the beginning of the process and continually checks development against these requirements to ensure the pipelines built will meet these requirements.This is done by first clearly defining the desired end state for each project in a way that addresses a demonstrated business need of downstream data users. Remember that data pipelines are almost always the means to accomplish your end state, rather than the end state itself. An example of an effectively defined end-state is “enabling teams to gain a better understanding of our customers by providing access to our CRM data within our cloud data warehouse” rather than “move data from our CRM to our cloud data warehouse”. This may seem like a merely semantic difference, but framing the problem in terms of business needs helps your teams make technical decisions that will best meet these needs.
After clearly defining the business problem you are trying to solve, you should facilitate requirement gathering from each stakeholder and use these requirements to guide the technical development and implementation of your ingestion pipelines. We recommend gathering stakeholders from each team, including downstream data users, prior to development to gather requirements for the technical implementation of the data pipeline. These will include critical timelines, uptime requirements, data update frequency, data transformation, DevOps needs, and security, policy, or regulatory requirements by which a data pipeline must meet.
Principle 2: Build your team
The second principle to consider for pipeline development is build your team. This means ensuring you have the right people with the right skills available in the right places to develop, deploy, and maintain your data pipelines. After you have gathered your pipeline requirements, you can begin to develop a summary architecture that will be used to build and deploy your data pipelines. This will help you identify the human talent you will need to successfully build, deploy, and manage these data pipelines and identify any potential shortfalls that would require additional support from either third-party partners or new team members.
Not only do you need to ensure you have the right people and skill sets available in aggregate, but these individuals need to be effectively structured to empower them to maximize their abilities. This means developing team structures that are optimized for each team’s responsibilities and their ability to support adjacent teams as needed.
This also means developing processes that prevent blockers to technical development whenever possible, such as ensuring that teams have all of the appropriate permissions they need to move data from the original source to your cloud data warehouse without violating the concept of least privilege. Developers need access to the original data source (depending on your requirements and architecture) in addition to the destination data warehouse. Examples of this are ensuring that developers have access to develop and/or connect to a Salesforce Connected App or read access to specific Search Ads 360 data fields.
Principle 3: Minimize time to value
The third principle to consider for pipeline development is minimize time to value. This means considering the long-term maintenance burden of a data pipeline prior to developing and deploying it in addition to being able to deploy a minimum viable pipeline as quickly as possible. Generally speaking, we recommend the following approach to building data pipelines to minimize their maintenance burden: Write as little code as possible. Functionally, this can be implemented by:
1. Leveraging interface-based data ingestion products whenever possible. These products minimize the amount of code that requires ongoing maintenance and empower users who aren’t software developers to build data pipelines. They can also reduce development time for data pipelines, allowing them to be deployed and updated more quickly.
- Products like Google Data Transfer Service and Fivetran allow for managed data ingestion pipelines by any user to centralize data from SaaS applications, databases, file systems, and other tooling. With little to no code required, these managed services enable you to connect your data warehouse to your sources quickly and easily.
- For workloads managed by ETL developers and data engineers, tools like Google Cloud’s Data Fusion provide an easy-to-use visual interface for designing, managing and monitoring advanced pipelines with complex transformations.
2. Whenever interface-based products or data connectors are insufficient, use pre-existing code templates. Examples of this include templates available for Dataflow that allow users to define variables and run pipelines for common data ingestion use cases, and the Public Datasets pipeline architecture that our Datasets team uses for onboarding.
3. If neither of these options are sufficient, utilize managed services to deploy code for your pipelines. Managed services, such as Dataflow or Dataproc, eliminate the operational overhead of managing pipeline configuration by automatically scaling pipeline instances within predefined parameters.
Principle 4: Increase data trust and transparency
The fourth principle to consider for pipeline development is increase data trust and transparency. For the purposes of this document, we define this as the process of overseeing and managing data pipelines across all tools. Numerous data ingestion pipelines that each leverage different tools or are not developed under a coordinated management plan can result in “tech sprawl”, which significantly increases the management overhead of data ingestion pipelines as the quantity of data pipelines increases. This becomes especially cumbersome if you are subject to service-level agreements, or legal, regulatory, or policy requirements for overseeing data pipelines. Preventing tech sprawl is, by far, the best strategy for dealing with it by developing streamlined pipeline management processes that automate reporting. Although this can theoretically be achieved by building all of your data pipelines using a single cloud-based product, we do not recommend doing so because it prevents you from taking advantage of features and cost optimizations that come with choosing the best product for your use case.
A monitoring service such as Google Cloud Monitoring Service or Splunk that automates metrics, events, and metadata collection from various products, including those hosted in on-premise and hybrid computing environments, can help you centralize reporting and monitoring of your data pipelines. A metadata management tool such as Google Cloud’s Data Catalog or Informatica’s Enterprise Data Catalog can help you better communicate the nuances of your data so users better understand which data resources are best fit for a given use case. This significantly reduces your pipeline’s governance burden by eliminating manual reporting processes that often result in inaccuracies or lagging updates.
Principle 5: Manage costs
The fifth principle to consider for pipeline development is manage costs. This encompasses both the cost of cloud resources and the staffing costs necessary to design, develop, deploy, and maintain your cloud resources. We believe that your goal should not necessarily be to minimize cost, but rather maximizing the value of your investment. This means maximizing the impact of every dollar spent by minimizing waste in cloud resource utilization and human time. There are several factors to consider when it comes to managing costs:
- Use the right tool for the job – Different data ingestion pipelines will have different requirements for latency, uptime, transformations, etc. Similarly, different data pipeline tools have different strengths and weaknesses. Choosing the right tool for each data pipeline can help your pipelines operate significantly more efficiently. This can reduce your overall cost, free up staffing time to focus on the most impactful projects, and make your pipelines much more efficient.
- Standardize resource labeling – Implement and utilize a consistent labeling schema across all tools and platforms to have the most comprehensive view of your organization’s spending. One example is requiring all resources to be labeled by the cost center or team at time of creation. Consistent labeling allows you to monitor your spend across different teams and calculate the overall value of your cloud spending.
- Implement cost controls – If available, leverage cost controls to prevent errors that result in unexpectedly large bills.
- Capture cloud spend – Capture your spend on all cloud resource utilization for internal analysis using a cloud data warehouse and a data visualization tool. Without it, you won’t understand the context of changes in cloud spend and how they correlate with changes in business.
- Make cost management everyone’s job – Managing costs should be part of the responsibilities of everyone who can create or utilize cloud resources. To do this well, we recommend making cloud spend reporting more transparent internally and/or implementing chargebacks to internal cost centers based on utilization.
Long-term, the increased granularity in cost reporting available within Google Cloud can help you better measure your key performance indicators. You can shift from cost-based reporting (i.e. – “We spent $X on BigQuery storage last month”) to value-based reporting (i.e. – “It costs $X to serve customers who bring in $Y revenue”).
To learn more about managing costs, check out Google Cloud’s “Understanding the principles of cost optimization” white paper.
Principle 6: Leverage continually improving services
The sixth principle is leverage continually improving services. Cloud services are consistently improving their performance and stability, even if some of these improvements are not obvious to users. These improvements can help your pipelines run faster, cheaper, and more consistently over time. You can take advantage of the benefits of these improvements by:
- Automating both your pipelines and pipeline management: Not only should data pipelines be automated, but almost all aspects of managing your pipelines can also be automated. This includes pipeline/data lineage tracking, monitoring, cost management, scheduling, access management and more. This helps reduce long-term operational costs of each data pipeline that can significantly alter your value proposition and prevent any manual configurations from negating the benefits of later product improvements.
- Minimizing pipeline complexity whenever possible: While ingestion pipelines are relatively easy to develop using UI-based or managed services, they also require continued maintenance as long as they are in use. The most easily maintained data ingestion pipelines are typically the ones that minimize complexity and leverage automatic optimization capabilities. Any transformation in a data ingestion pipeline is a manual optimization of the pipeline that may struggle to adapt or scale as the underlying services improve. You can minimize the need for such transformations by building ELT (extract, load, transform) pipelines rather than ETL (extract, transform, load) pipelines. This pushes transformations down to the data warehouse that is use a specifically optimized query engine to transform your data rather than manually configured pipelines.
Next steps
If you’re looking for more information about developing your cloud-based data platform, check out our Build a modern, unified analytics data platform whitepaper. You can also visit our data integration site to learn more and find ways to get started with your data integration journey.
Once you’re ready to begin building your data ingestion pipelines, learn more about how Cloud Data Fusion and Fivetran can help you make sure your pipelines address these principles.
How Google Maps Platform Boosts Domino’s Operations and Fast Growing Franchise across Indonesia

3869
Of your peers have already read this article.
5:00 Minutes
The most insightful time you'll spend today!
Editor’s note: Today’s blog post is from Mayank Singh, Chief Digital Officer and VP Marketing and IT at pizza delivery group Domino’s Indonesia. He explains how Google Maps Platform is enabling their business to optimize their operations and supporting the franchise’s ambitious expansion strategy in one of the world’s most exciting emerging markets.
When I was developing India’s first hyper local on-demand food delivery digital commerce platform for Domino’s Pizza India, I never imagined life would take me to a country with such a different culture to my own.
But in 2018, when Domino’s Indonesia invited me to drive its expansion strategy as Senior General Manager to lead Digital, IT and Marketing functions, I jumped at the chance to try my hand in another gigantic emerging nation that brims with entrepreneurial hunger and innovative energy.
Indonesia is a massive archipelago of more than 17,500 islands and 270 million people, one of the world’s most promising developing markets. Here, the opportunities for a global brand, such as Domino’s, are almost boundless. At the same time, we’re extremely cautious. We want to make sure that any new store we open has the correct demographic profile to be profitable.
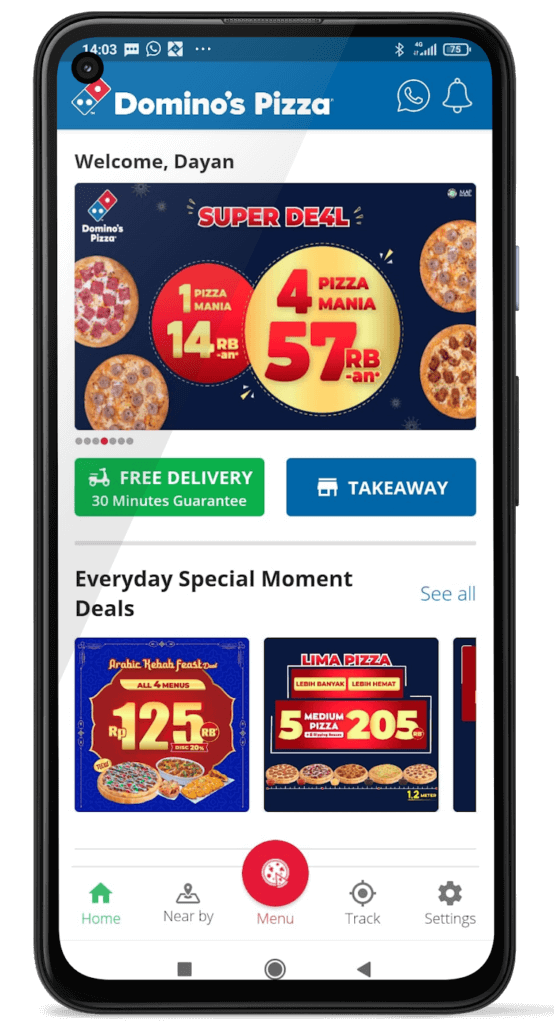
This is one of the key areas in which Google Maps Platform enables us to satisfy the hunger of a vibrant, fast-moving society. The Google Maps Platform APIs empower us with much more than the ability to maintain Domino’s 30-minute delivery pledge. They play an instrumental role in our value chain before a store even begins selling pizzas, providing vital insights in our hunt for new shop locations.
Mapping the dizzying pace of change in one of Asia’s fastest growing economies
Under the Domino’s Indonesia model, every outlet has a defined territory and can only take orders from that zone. Instead of customers picking a store, we assign them one based on their location. That’s why selecting zones that have the highest profit potential (due to factors such as population, income, education, and business activity) is essential to our success.
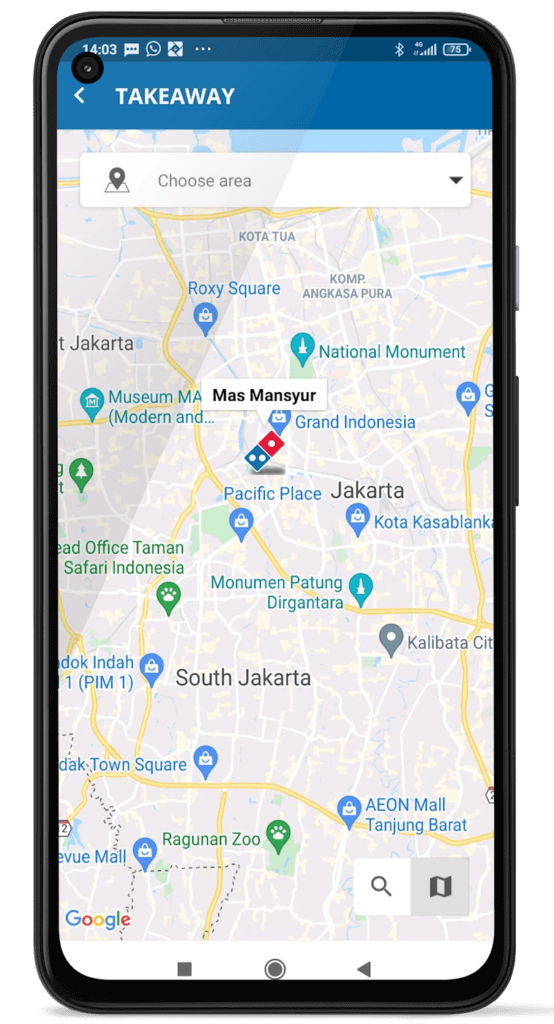
The first step is casting a net around the test location that covers anywhere within a nine-minute drive to any point in the proposed zone. This is enabled by the Google Maps Platform APIs, including Distance Matrix API.
Things become really interesting and complicated when considering Indonesia’s dizzying pace of change. Social, economic, and infrastructure transformation in Indonesia literally unfolds before your eyes, meaning the map in any area can change overnight.
A place that had little to no development yesterday might be tomorrow’s next desirable suburb—populated by families drawn to new schools, but also increased traffic congestion caused by community growth. By overlaying our data, such as population, average income, and age range onto Google Maps, our team can better visualize the revenue potential in that zone compared to neighboring stores. Since the definition of a profitable zone is in constant flux, we need our local insights to be ahead of the game.
Charting Indonesia’s transformation with speed and accuracy is crucial in our mission to carve out delivery zones that serve communities that need our service most while maximizing our revenues.
Retrofitting Indonesian delivery zones to optimize Domino’s success
Expansion is just one side of the story. Just as important, we must keep an eye on existing outlets to make sure that traffic conditions, road configurations, prominent sites, public infrastructure, and more, hit the sweet spot for timely delivery and revenue optimization.
A successful delivery area, for example, might fall victim to its own popularity, causing congestion that prevents timely delivery to once viable addresses. In such cases, the specified drive time in the delivery matrix shrinks. We accordingly must downsize the service zone, while adding micro-zones to satisfy demand. Google Maps Platform features such as Traffic Layer in Maps JavaScript API enable the real-time traffic intelligence that helps us make precision calls in the evolving mission of zone optimization.
Conversely, we might want to expand a store territory thanks to a new highway or roadworks that improve traffic circulation. Here, too, Google Maps Platform is the fastest in mapping such shifts in the urban landscape. We’re even planning to experiment with a new feature whereby delivery zones change in size over the course of a day, based on factors such as peak traffic and roadworks. This new project will be enabled by Google Maps Platform real-time road intelligence.
Enabling Indonesia’s pandemic support with contactless delivery and support for frontline healthcare
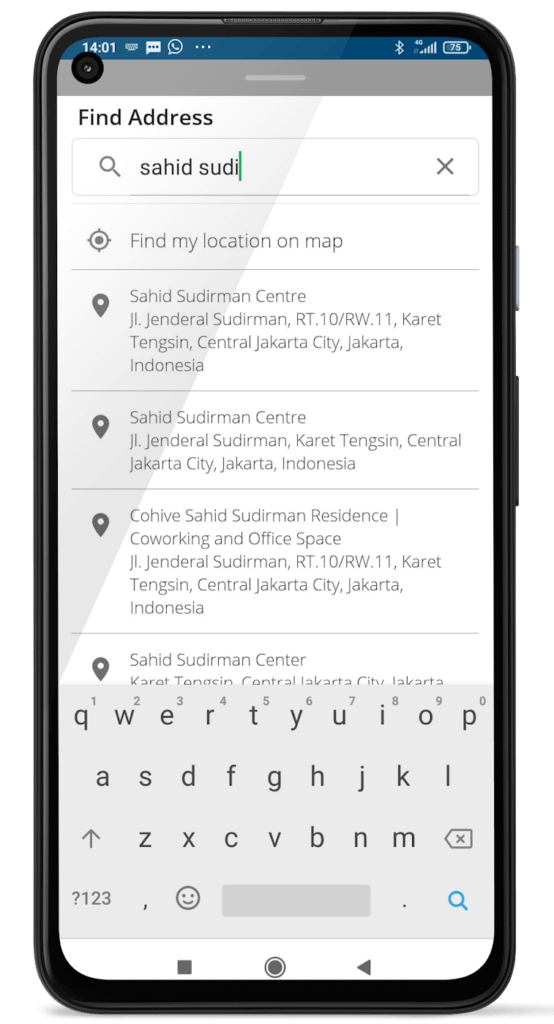
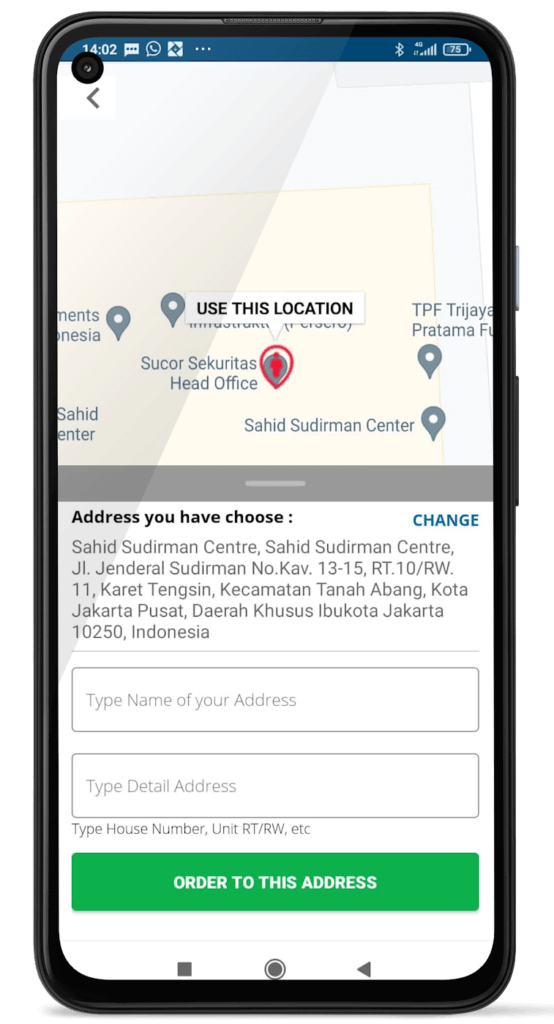
Google Maps Platform also helps us respond quickly to societal changes. When the pandemic hit Indonesia, for example, our team was all hands on deck developing ways to deliver pizzas in the safest possible way. We overhauled our order system to make contactless delivery and contactless takeaway the default method of connecting customers to their pizzas. This was done to reassure customers how safe it is to order with Domino’s. Customers can locate us using the map UI, view the ordering options and have a contactless takeaway experience.
Google Maps Platform products such as Places API, which provides rich places details and location information as well as the Static Street View API which provides a more accurate visual of the location, now enable our drivers to pinpoint a drop spot, such as ‘the porch with the red roof’ with precision accuracy.
Our team is also proud of how we supported healthcare workers at the frontline of the pandemic. Google Maps Platform was an invaluable solution in enabling us to deliver pizzas to these vital frontline workers. It gave all of us at Domino’s Pizza Indonesia great satisfaction to see smiles on the faces of heroes working hard to keep people safe and well in this immense nation.
For more information on Google Maps Platform, visit our website.
How EDI empowers its workforce in the field, in the office, and at home

3889
Of your peers have already read this article.
5:12 Minutes
The most insightful time you'll spend today!
For consulting companies such as EDI Environmental Dynamics Inc. (EDI), interactions among employees and customers are the direct drivers of value, and helping them collaborate has a tangible impact on the bottom line. However, connecting people from the field to work-from-home spaces to the office is no easy task.
EDI, an environmental consulting company that helps organizations assess environmental impacts and meet government regulations, has eight offices across Western and Northern Canada. Frontline workers account for 80% of its total employees, ranging from biologists and scientists to safety inspectors and project managers. EDI’s success is directly linked to its remote workforce’s ability to work effectively in the field and to collaborate with coworkers and clients across Western Canada. With the help of Google Workspace and AppSheet, EDI is enabling its mobile workforce to function more efficiently and collaboratively than ever before.
Bringing efficiency to its frontline workers
Just four years ago, much of EDI’s fieldwork was still being tracked with pen and paper, resulting in frequent challenges, from error-prone data retention to inefficient collaboration. Luckily, EDI was able to address this using AppSheet, Google Cloud’s no-code application development platform.
With AppSheet, EDI has replaced the majority of its pen-and-paper processes with tailored apps. As EDI’s Director of IT, Dennis Thideman explains, “AppSheet allows us to be much more responsive to our field needs. Using it, we can spin up a basic industrial application, share it with our field workers, and have them adjust their workflows—all in just a few hours. Doing that from scratch might take weeks or months.”
For EDI, there are a couple of features that make AppSheet shine. First, AppSheet is platform-agnostic, meaning it works on most devices and most operating systems, so any employee can access their AppSheet apps. Secondly, because 90% of EDI’s projects involve working in remote areas, they can leverage AppSheet’s Offline Mode, allowing workers to collect data on their mobile devices in the field and have it automatically download when they reconnect to the internet.
Eliminating the challenges associated with pen and paper has resulted in even more benefits than EDI leaders originally anticipated: namely, employees work faster across an unexpectedly wide range of use cases. For example, governmental regulations require EDI to complete a pre-trip safety evaluation before heading into the field. Before using AppSheet, this evaluation would take upwards of four hours to complete. By streamlining the process with an AppSheet app, EDI employees have reduced that time down to one hour. EDI averages over 850 evaluations every year, and they’ve realized over 2,550 hours in annual savings—savings that can be passed on to clients and allow staff to focus more time on other tasks. This is just one of more than 35 mission-critical applications that EDI has built with AppSheet.
Time savings is a huge benefit, but as Logan Thideman, an IT manager at EDI, explains “At the end of the day, we realized that the biggest benefits of AppSheet aren’t about time savings as much as they are about high-quality data.” Collecting and analyzing good data is critical to EDI’s operations, as most data collected in the field can never be replicated. For example, if a water quality sample for a certain day is lost (which can happen easily when using pen and paper), that information can never be retrieved again. AppSheet makes data collection easy. Employees are much less likely to lose a smart device than they are a paper form, and any data entered would be immediately uploaded to a Google Sheet or SQL database when they return from the field, meaning data is always backed up in the cloud. From there, information can quickly be analyzed by coworkers, passed on to the client, or shared with government agencies to ensure proper compliance.
Overall, EDI found that the more they could enable their field workers with AppSheet apps, the more those employees could focus on providing quality research and recommendations to their clients and gain a stronger competitive advantage in the market.
Enhancing collaboration everywhere
Enabling collaboration in remote environments can be difficult, but Google Workspace has made this easy for EDI. Google Workspace lets employees effortlessly share documents and work together in real time. Given its ease of use for mobile workers, Google Meet has become all-important and is used as EDI’s tool of choice for face-to-face collaboration. It became even more essential when COVID-19 arrived. As Dennis Thideman explains, “Google Meet allowed us to adapt to the COVID-19 environment quickly as we were already conversant with it. In just two days, we were able to transition our employees from office to home because of it.” By leveraging Google Meet and the rest of the Google Workspace platform, EDI employees are able to remain productive, regardless of where they’re working.
Google Workspace also makes it easy to collaborate with customers. Because many of EDI’s customers leverage Microsoft Office tools such as Word, Excel, and PowerPoint, EDI still needs to use them. Google Workspace makes it easy to continue using Microsoft products in its environment, allowing employees to store Microsoft Office files on Google Drive and open, edit and save them using Google Docs, Sheets, and Slides.
AppSheet and Google Workspace’s deep integrations also make collaboration easy. Employees can update data in Google Sheets, save images and reports to Drive, and update Calendar events all from AppSheet apps. Together, the two platforms simplify many of the activities that consumed so much time in the past.
An empowered workforce
Empowering employees has been at the core of EDI’s success, and Google Workspace and AppSheet have given EDI a clear advantage. Collaboration has become easier and more agile using Google Workspace. Robust AppSheet apps have been built to streamline mission-critical processes. For unique project requirements, simple AppSheet apps are built in a matter of hours. As Dennis Thideman summarizes, Google Workspace and AppSheet “make managing a distributed, deskless workforce much simpler, giving EDI better growth opportunities and a competitive edge in the marketplace.”
Accelerate Developer Productivity with Google Workspace

5777
Of your peers have already read this article.
3:30 Minutes
The most insightful time you'll spend today!
The software development process requires complex, cross-functional collaboration while continuously improving products and services. Our customers who build software say that they value Google Workspace for its ability to drive innovation and collaboration throughout the entire software development life cycle. Developers can hold standups and scrums in Google Chat, Meet, and Spaces, create and collaborate on requirements documentation in Google Docs and Sheets, build team presentations in Google Slides, and manage their focus time and availability with Google Calendar.
Development teams also use many other tools to get work done, like tracking issues and tasks in Atlassian’s Jira, managing workloads with Asana, and incident management in PagerDuty. One of the benefits of Google Workspace is that it’s an open platform tailored to improve the performance of your tools by seamlessly integrating them together. We’re constantly expanding our ecosystem and improving Google Workspace, giving you the power to push your software development even further.
Make software development more agile
Google Workspace gives you real-time visibility into project progress and decisions to help you ship quality code fast and stay connected with your stakeholders, all without switching tools and tabs. By leveraging applications from our partners, you can pull valuable information out of silos, making collaborating on requirements, code reviews, bug triage, deployment updates, and monitoring operations easy for the whole team. This allows your teams to stay focused on their priorities while keeping everyone aligned, ensuring collaborators are always in the loop.
Plan and execute together
When combined with integrations, Google Workspace makes the software development planning process more collaborative and efficient. For example, many organizations use Asana—a leading work management platform—to coordinate and manage everything from daily tasks to cross-functional strategic initiatives. To make the experience more seamless, Asana built integrations so users can always have access to their tasks and projects with Google Drive, Gmail, and Chat. With these integrations for Google Workspace, you can turn your conversations into action and create new tasks in Asana—all without leaving Google Workspace.
“We’ve seen exceptional, heavy adoption of tasks being created from within the Gmail add-on. Our customers and community have also shown very strong interest in future development work, which is something we’ll continue to prioritize.” Strand Sylvester, Product Manager, Asana
To date, users have installed the Asana for Gmail add-on over 2.5 million times, as well as over 3.8 million installs of the Asana for Google Workspace add-on for Google Drive.
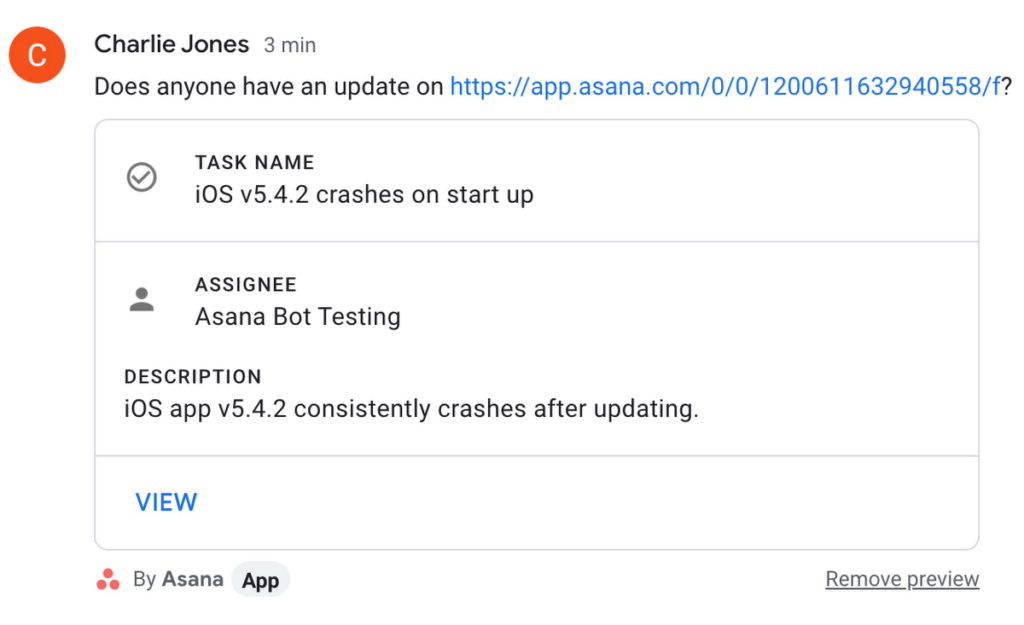
Start coding quickly
Google Workspace makes it easy for product managers, UX designers, and engineers to agree on what they’re building and why. By bringing all stakeholders, decisions, and requirements into one place—whether it’s a Gmail or Google Chat conversation, or a document in Google Docs, Sheets, or Slides—Google Workspace removes friction, helping your teams finalize product specifications and get started right away.
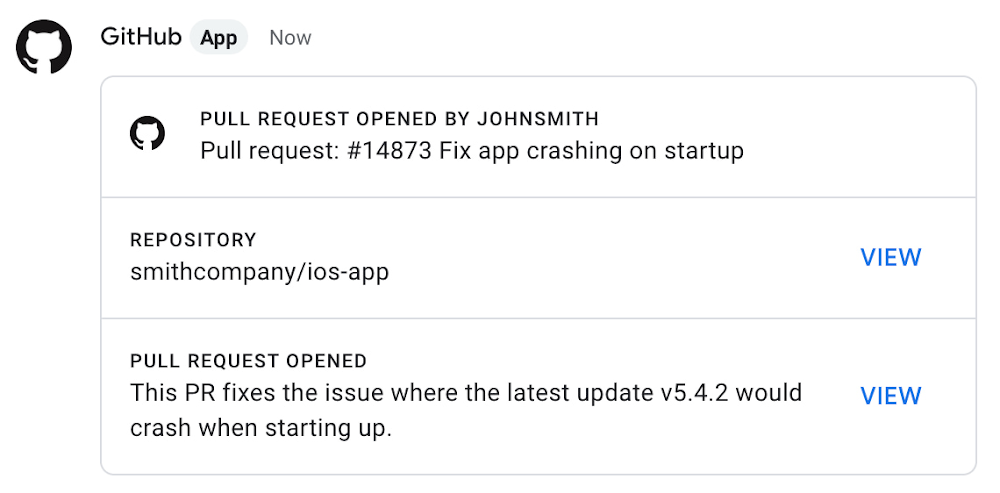
Integrations like GitHub for Google Chat make the entire development process fit easily into a developer’s workflow. With this integration, teams can quickly push new commits, make pull requests, do code reviews, and provide real-time feedback that improves the quality of their code—all from Google Chat.
Speed up testing
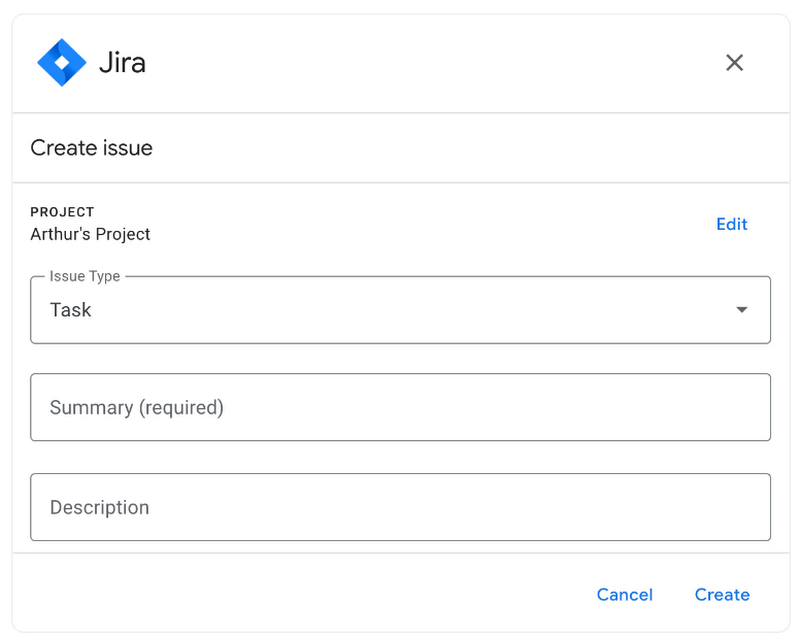
Integrations like Jira for Google Chat accelerate the entire QA process in the development workflow. The app acts as a team member in the conversation, sending new issues and contextual updates as they are reported to improve the quality of your code and keep everyone informed on your Jira projects.
Ship code faster
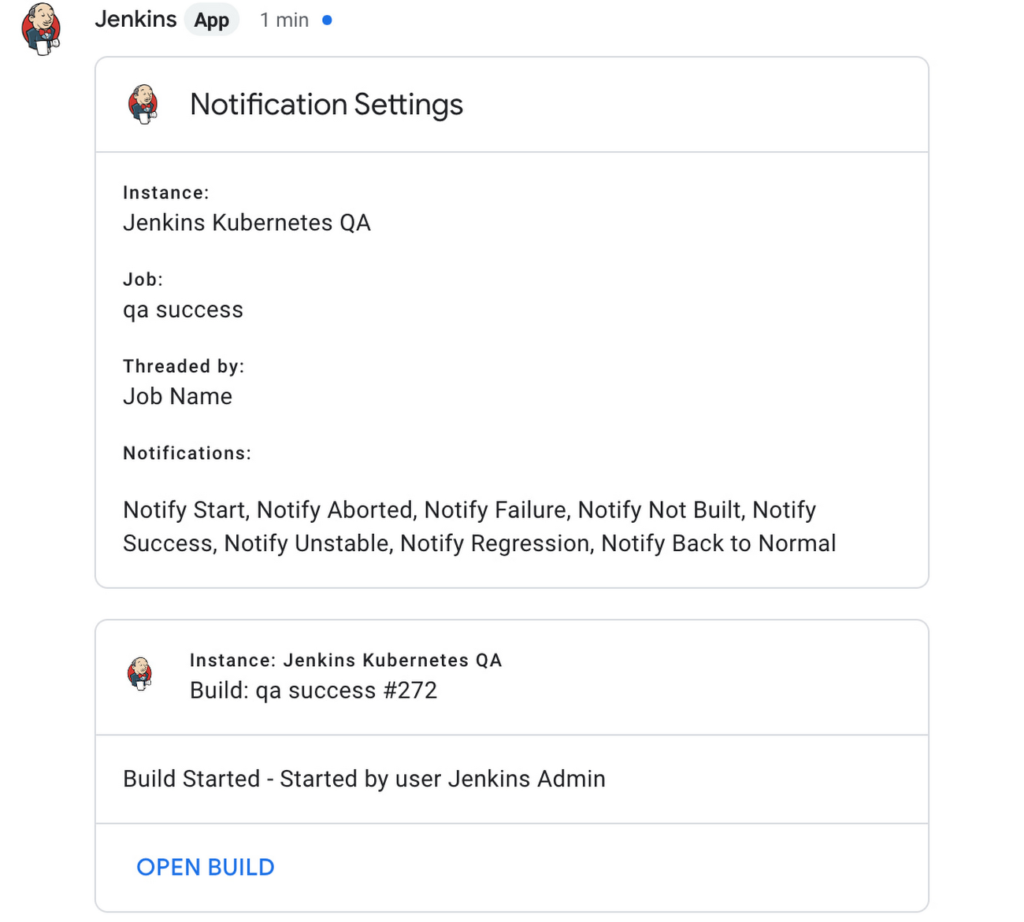
Developers use Jenkins—a popular open-source continuous integration and continuous delivery tool—to build and test products continuously. Along with other cloud-native tools, Jenkins supports strong DevOps practices by letting you continuously integrate changes into the software build.
With Jenkins for Google Chat, development and operations teams can connect into their Jenkins pipeline and stay up to date by receiving software build notifications directly in Google Chat.
Proactively monitor your services
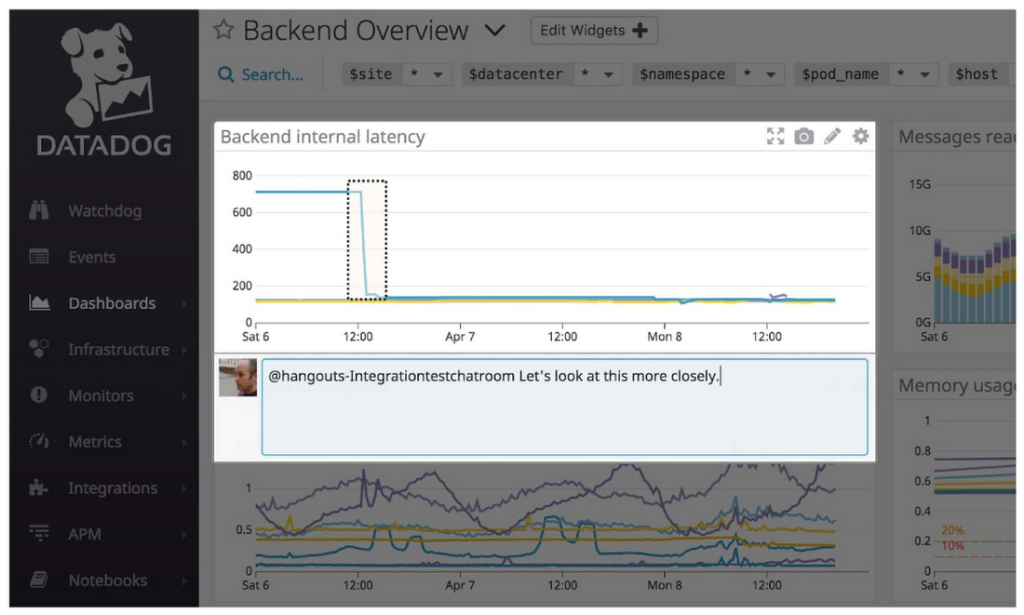
Improving the customer experience requires capturing and monitoring data sources to improve application and infrastructure observability. Google Workspace supports DevOps teams and organizations by helping stakeholders collaborate and troubleshoot more effectively. When you integrate Datadog with Google Chat, monitoring data becomes part of your team’s discussion, and you can efficiently collaborate to resolve issues as soon as they arise.
The integration makes it easy to start a discussion with all the relevant teams by sharing a snapshot of a graph in any of your Chat spaces. When an alert notification is triggered, it allows you to notify each Chat space independently, precisely targeting your communication to the right teams.
Improve service reliability
Orchestrating business-wide responses to interruptions is a cross-functional effort. When revenue and brand reputation depends on customer satisfaction, it’s important to proactively manage service-impacting events. Google Workspace supports response teams by ensuring that urgent alerts reach the right people by providing teams with a central space to discover incidents, find the root cause, and resolve them quickly.
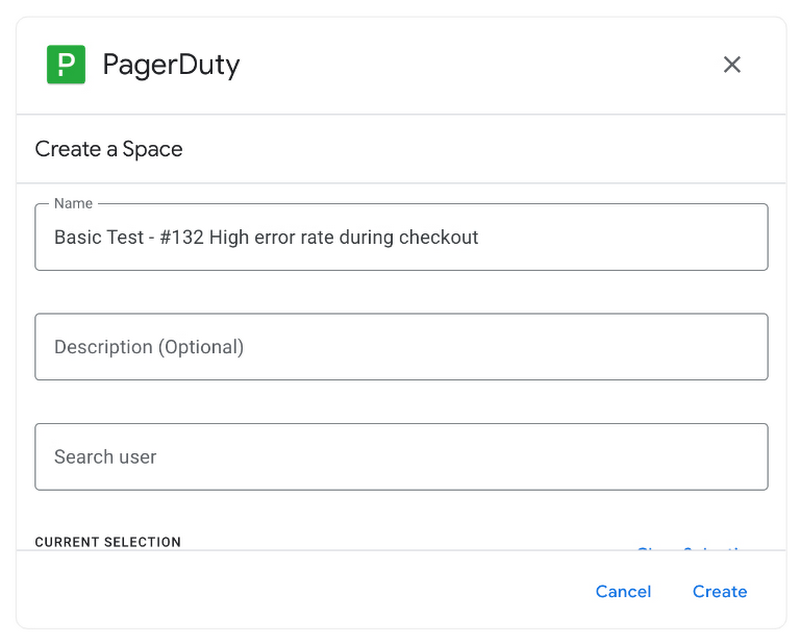
PagerDuty for Google Chat empowers developers, DevOps, IT operations, and business leaders to prevent and resolve business-impacting incidents for an exceptional customer experience—all from Google Chat. See and share details with link previews, and perform actions by creating or updating incidents. By keeping all conversations in a central space, new responders can get up to speed and solve issues faster without interrupting others.
Accelerate developer productivity
Integrating your DevOps tools with Google Workspace allows your development teams to centralize their work, stay focused on what’s important—like managing their work—build code quickly, ship quality products, and communicate better during service impacting incidents. For more apps and solutions that help centralize your work so you and your teams can connect, create, and get things done, check out Google Workspace Marketplace, where you’ll find more than 5,300 public applications that integrate directly into Google Workspace.
3985
Of your peers have already watched this video.
33:29 Minutes
The most insightful time you'll spend today!
Introducing G Suite Essentials: The simplest way for teams to securely work together from anywhere
With millions of employees forced to work from home, it has become clear that the existing tools many have in place were not cutting it. The Google Cloud team stepped in and accelerated production timelines to launch a new offering. G Suite Essentials is Google’s integrated set of tools designed to support a modern workspace.
With that in mind, Google wants to give an introduction to Essentials and insights into how Google addresses this specific situation we find ourselves in due to the pandemic.
And so the question becomes, now that remote work is the new normal, are the tech tools that we have in place the right ones? And here’s the harsh reality–for many, anything other than collaboration whilst sharing the same conference room in-person is broken.
We all have our examples–incorrect versions of documents, not being able to find the right information, unproductive conference calls, you name it. You have your own story. The unfortunate thing is that it feels normal at this point, and that’s just not fair.
How—and where—people work has changed. Being a part of a distributed team is the new normal, and teams need easy-to-adopt tools that empower them to collaborate from anywhere. Learn how your team can get started in minutes, swiftly and securely.
More Relevant Stories for Your Company

Securing Remote Workers with Google and Chrome Enterprise
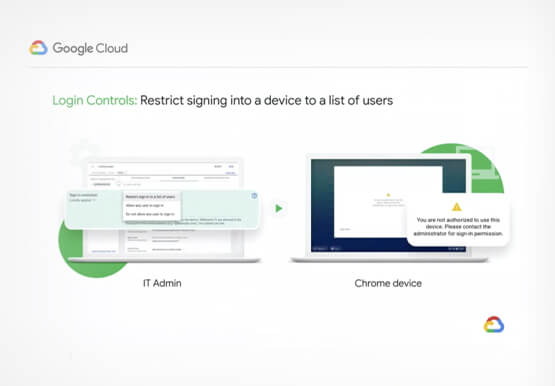
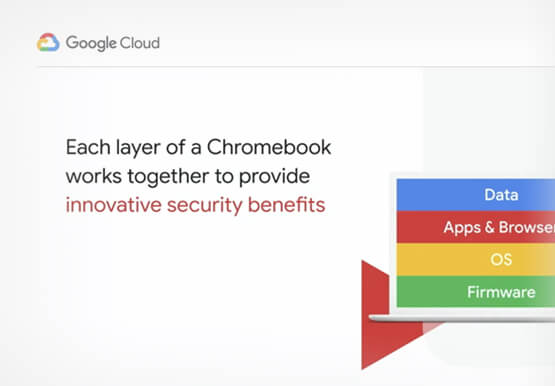
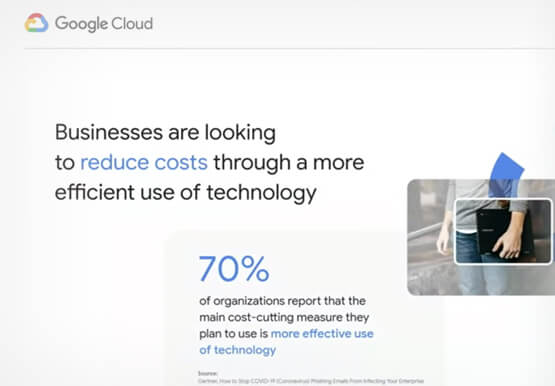
With the proliferation of COVID-19 across the globe, the need for a remote working strategy has become paramount to keep businesses running. A Gartner survey found that 88% of organizations have asked their employees to work remotely. And 97% of the organizations canceled work-related travel. However, only 10% of the

Hybrid Work with Google Workspace: What Customers can Expect
In June, we shared our vision for navigating the future of hybrid work with a single connected experience in Google Workspace. Now, as many of our customers begin to embark on their own hybrid journeys, I wanted to share how we’re helping them bridge the gaps in this new way of
Google Workspace Now has Adobe Add-on!
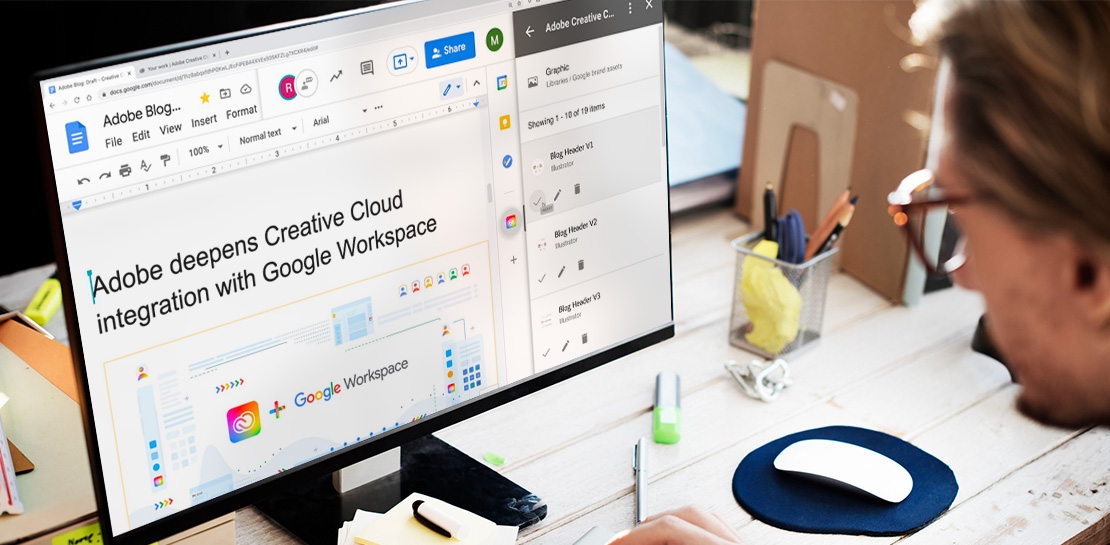
Every day, individual people and creative teams combine Google Workspace with Adobe Creative Cloud to bring their best ideas to life and delight their customers or friends, across photography, design, video, 3D design, and more. In fact, Adobe’s add-on for Google Workspace has had over a million installs and counting. By partnering

Google Workspace Now Available to Over 3 Billion Users!
Over the past year, Google Workspace rapidly evolved to meet the needs of users as we collectively grappled with remote and hybrid work. First, we launched Google Workspace to commercial customers, which brought together the powerful individual apps people know and love into a single, integrated solution. Then we made Google Workspace
