





Data to Business Outcomes with Google’s Data Analytics Design Pattern

6736
Of your peers have already read this article.
1:30 Minutes
The most insightful time you'll spend today!
Companies today are inundated with vast amounts of data from various sources. This overwhelming amount of data is meant to benefit the company, but often leaves data teams feeling overwhelmed, which can create data bottlenecks and result in a slow time to value. In fact, only twenty seven percent of companies agree that data and analytics projects produce insights and recommendations that are highly actionable (Accenture). This means that nearly 3 in 4 companies are not unlocking value in their data, which poses a huge challenge for organizations trying to move the needle and drive real business results. We at Google Cloud, however, saw opportunity in this challenge, which is why we created Data Analytics Design Patterns: cross-product technical solutions designed to accelerate a customer’s path to value realization with their data. These industry solutions bring together product capabilities alongside design methodology, open source deployable code, data models, and reference architectures to accelerate your business outcomes.

With Data Analytics Design Patterns, you get access to more than 30 ready-to-deploy data analytics solutions. Design patterns leverage the best of Google and our rich partner ecosystem, including Technology Partners & System Integrators. In this blog, we will cover 3 examples on how a design pattern can be applied to unlock the value of data:
- Improve mobile app experience with Unified App Analytics
- Maximize digital shop’s revenue with Price Optimization
- Protect internal systems from security and malware threat with Anomaly Detection
Unified App Analytics
If mobile apps are part of your go-to-market strategy, you have several data sources that can provide invaluable customer insights. In addition to tools such as CRM (e.g. Salesforce) and customer care (e.g. Zendesk), you likely use Google Analytics to log app events and Firebase Crashlytics to gather data about app errors. But can you easily combine back-end server data with app front-end data to unlock customer insights?
The Unified App Analytics design pattern makes it easy to plug all the disparate data sources into a single warehouse (BigQuery) and start analyzing it with a Business Intelligence tool (Looker). Once you have a complete and real time view of your customer experience with your app, you can take action. For example, if you notice an increase in app errors, you can quickly combine your Crashlytics data with your CRM data to narrow down the crashes with the highest revenue impact and prioritize their resolution. Further, you can automate your issue resolution workflow by creating a rule for any future crash that impacts a subset of VIP customers.

With the Unified App Analytics design pattern, you’ll gain access to valuable insights about your user experience with your app so you can inform your future app strategy. For example, NPR, an American media company, increased user engagement by showing content that better mapped to listener interests and behaviors.
Price Optimization
In a competitive and hectic global marketplace, strategic pricing matters more than ever, but often projects are consumed by the tedium of standardizing, cleaning, and preparing data—from transactions, inventory, demand, among other sources.
Price Optimization solution allows retailers to build a data driven pricing model. The solution consists of three main components:
- Dataprep by Trifacta: integrates different data sources into a single Common Data Model (CDM). Dataprep is an intelligent data service for visually exploring, cleaning, and preparing structured and unstructured data for analysis, reporting, and machine learning.
- BigQuery: allows you to create and store pricing models in a consistent and scalable way as a serverless Cloud Data Warehouse service
- Looker dashboards: surface insights and enable business teams to take action with enterprise ready BI platform
With the Price Optimization design pattern from Google Cloud and our partner Trifacta, you’ll be able to rapidly unify multiple data sources and create a real-time and ML-powered analysis, leveraging predictive models to estimate future sales. For example, PDPAOLA, an online jewelry company, doubled sales with dynamic pricing adjustments enabled by a single data view.

Anomaly Detection
Organizations need to anticipate and act on risks and opportunities to stay competitive in a digitally transforming society. Anomaly detection helps organizations identify and respond to data points and data trends in high velocity, high volume data sets that deviate from historical standards and expected behaviors, allowing them to take action on changing user needs, mitigate malicious actors and behaviors, and prevent unnecessary costs and monetary losses.
The Anomaly Detection design pattern uses Google Pub/Sub, BigQuery, Dataflow, and Looker to:
- Stream events in real time
- Process the events, extract useful data points, train the detection algorithm of choice
- Apply the detection algorithm in near-real time to the events to detect anomalies
- Update dashboards and/or send alerts
The challenge of finding the important insights and anomalies in vast amounts of data applies to organizations across all industries and lines of business, but is especially important to protecting the security of an organization. For example, TELUS, a national communications company, modernized their security analytics platform leveraging this pattern, allowing them to detect anomalies in near real time to detect and mitigate suspicious activity.
Get started
Turn your data into business outcomes with Google Cloud and our broad partner ecosystem by deploying Data Analytics Design Patterns at your organization. There are more than 30 Data Analytics Design Patterns ready for you to use. We have more than 200+ more ideas in the pipeline, so be sure to check in regularly as new patterns will be added soon.
To dive deeper and find out more about how Data Analytics Design Patterns can help your organization accelerate use cases and create faster time to value, check out this video.
10518
Of your peers have already watched this video.
2:15 Minutes
The most insightful time you'll spend today!
The True Story of How HotStar Broke a World-Record–Thanks to Firebase and Google BigQuery
Hotstar, India’s largest video streaming platform with 150 million monthly active users around the world, provides live-streaming of TV shows, movies, sports, and news on the go.
By using a combination of Firebase products together, Hotstar safely rolled out new features to its watch screen during a major live-streaming event without disrupting users, sacrificing stability, or releasing a new build. They also used Firebase with BigQuery to analyze their event data and reduce app startup time.
“We have an ambitious mission, but our engineering team is only a fraction of the size of most of our competitors. But we are still keeping up, and we are doing it with the help of Firebase,” says Ayushi Gupta, Android Engineer, Hotstar.

5364
Of your peers have already downloaded this article
8:15 Minutes
The most insightful time you'll spend today!
To design and implement a successful machine learning (ML) project, you often need to collaborate with multiple teams, including those in business, sales, research, and engineering. Understanding the essentials of gathering and preparing your data is crucial to align teams, and getting a project off the ground.
Building an ML model that achieves your business’ goal, requires the kind of data that a model can learn from. If the goal is to predict a target output based on some input, you’ll need some data consisting of past input-output examples. For example, to detect (that is, to predict) a fraudulent credit card transaction (the target of the prediction), each example must contain information on a past credit card transaction and whether that transaction was fraudulent or not.
So what are the best practices in preparing and curating data for a machine learning initiative? The answer to this question lies within the guide. You’ll learn:
- To evaluate whether your data is suitable for ML
- What types of data you need–and which ones to eliminate
- How to prevent data leakage
- Tricks to speed up an ML project such as Google’s human labeling service, and Cloud Dataprep
- The importance of the granularity of data
How Constellation Brands’ Direct-to-Customer Tech Delivers Economic Impact across Business Portfolio

6283
Of your peers have already read this article.
3:00 Minutes
The most insightful time you'll spend today!
Editor’s note: Today we’re hearing from Ryan Mason, Director, Head of DTC Growth & Strategy, at alcoholic beverage firm, Constellation Brands on the company’s shift to Direct-to-Consumer (DTC) sales and how Google Cloud’s powerful technology stack helped with this transformation.
It’s no secret that consumer businesses have been up-ended in a lasting manner after 18 months of the pandemic. Consumers have been forced to shop differently over the past year – and as a result, they’ve evolved to be more comfortable with online spending and have grown to expect a certain level of convenience. While the e-commerce share of consumer sales has grown steadily over the past decade, the pandemic was the catalyst for the famous “10 years of growth in 3 months” which many argue is here to stay.
Facing this reality head-on, we placed a new emphasis on Direct-to-Consumer (DTC) with our acquisition of Empathy Wines, a DTC-native wine brand that sells directly to consumers via e-commerce. To accelerate our innovation in the DTC space, we added headcount and new functions to the existing Empathy team and empowered the newly-minted DTC group to apply their digital commerce operating model across the rest of the wine and spirits portfolio, which includes Robert Mondavi Winery, Meiomi Wines, The Prisoner Wine Company, High West Whiskey, and more.
One pandemic and one year later, DTC sales have surged in the wine and spirits category with Constellation positioned as a leader armed with a unique and powerful cloud technology stack, best-in-class e-commerce user experiences, modernized fulfillment solutions, and data-driven growth marketing.
Benefits of Going DTC
A report from McKinsey estimates that the strategic business shift to DTC has been accelerated by two years because of the pandemic and argues that consumer brands that want to thrive will need to aim for a 20% DTC business or higher, which is already taking shape in the market: Nike’s direct digital channels are on track to make up 21.5% of the total business by the end of 2021, up from 15.5% in the last fiscal year, and Adidas is aiming for 50% DTC by 2025. But outside of the clear revenue upside, the auxiliary benefits of going DTC are robust.
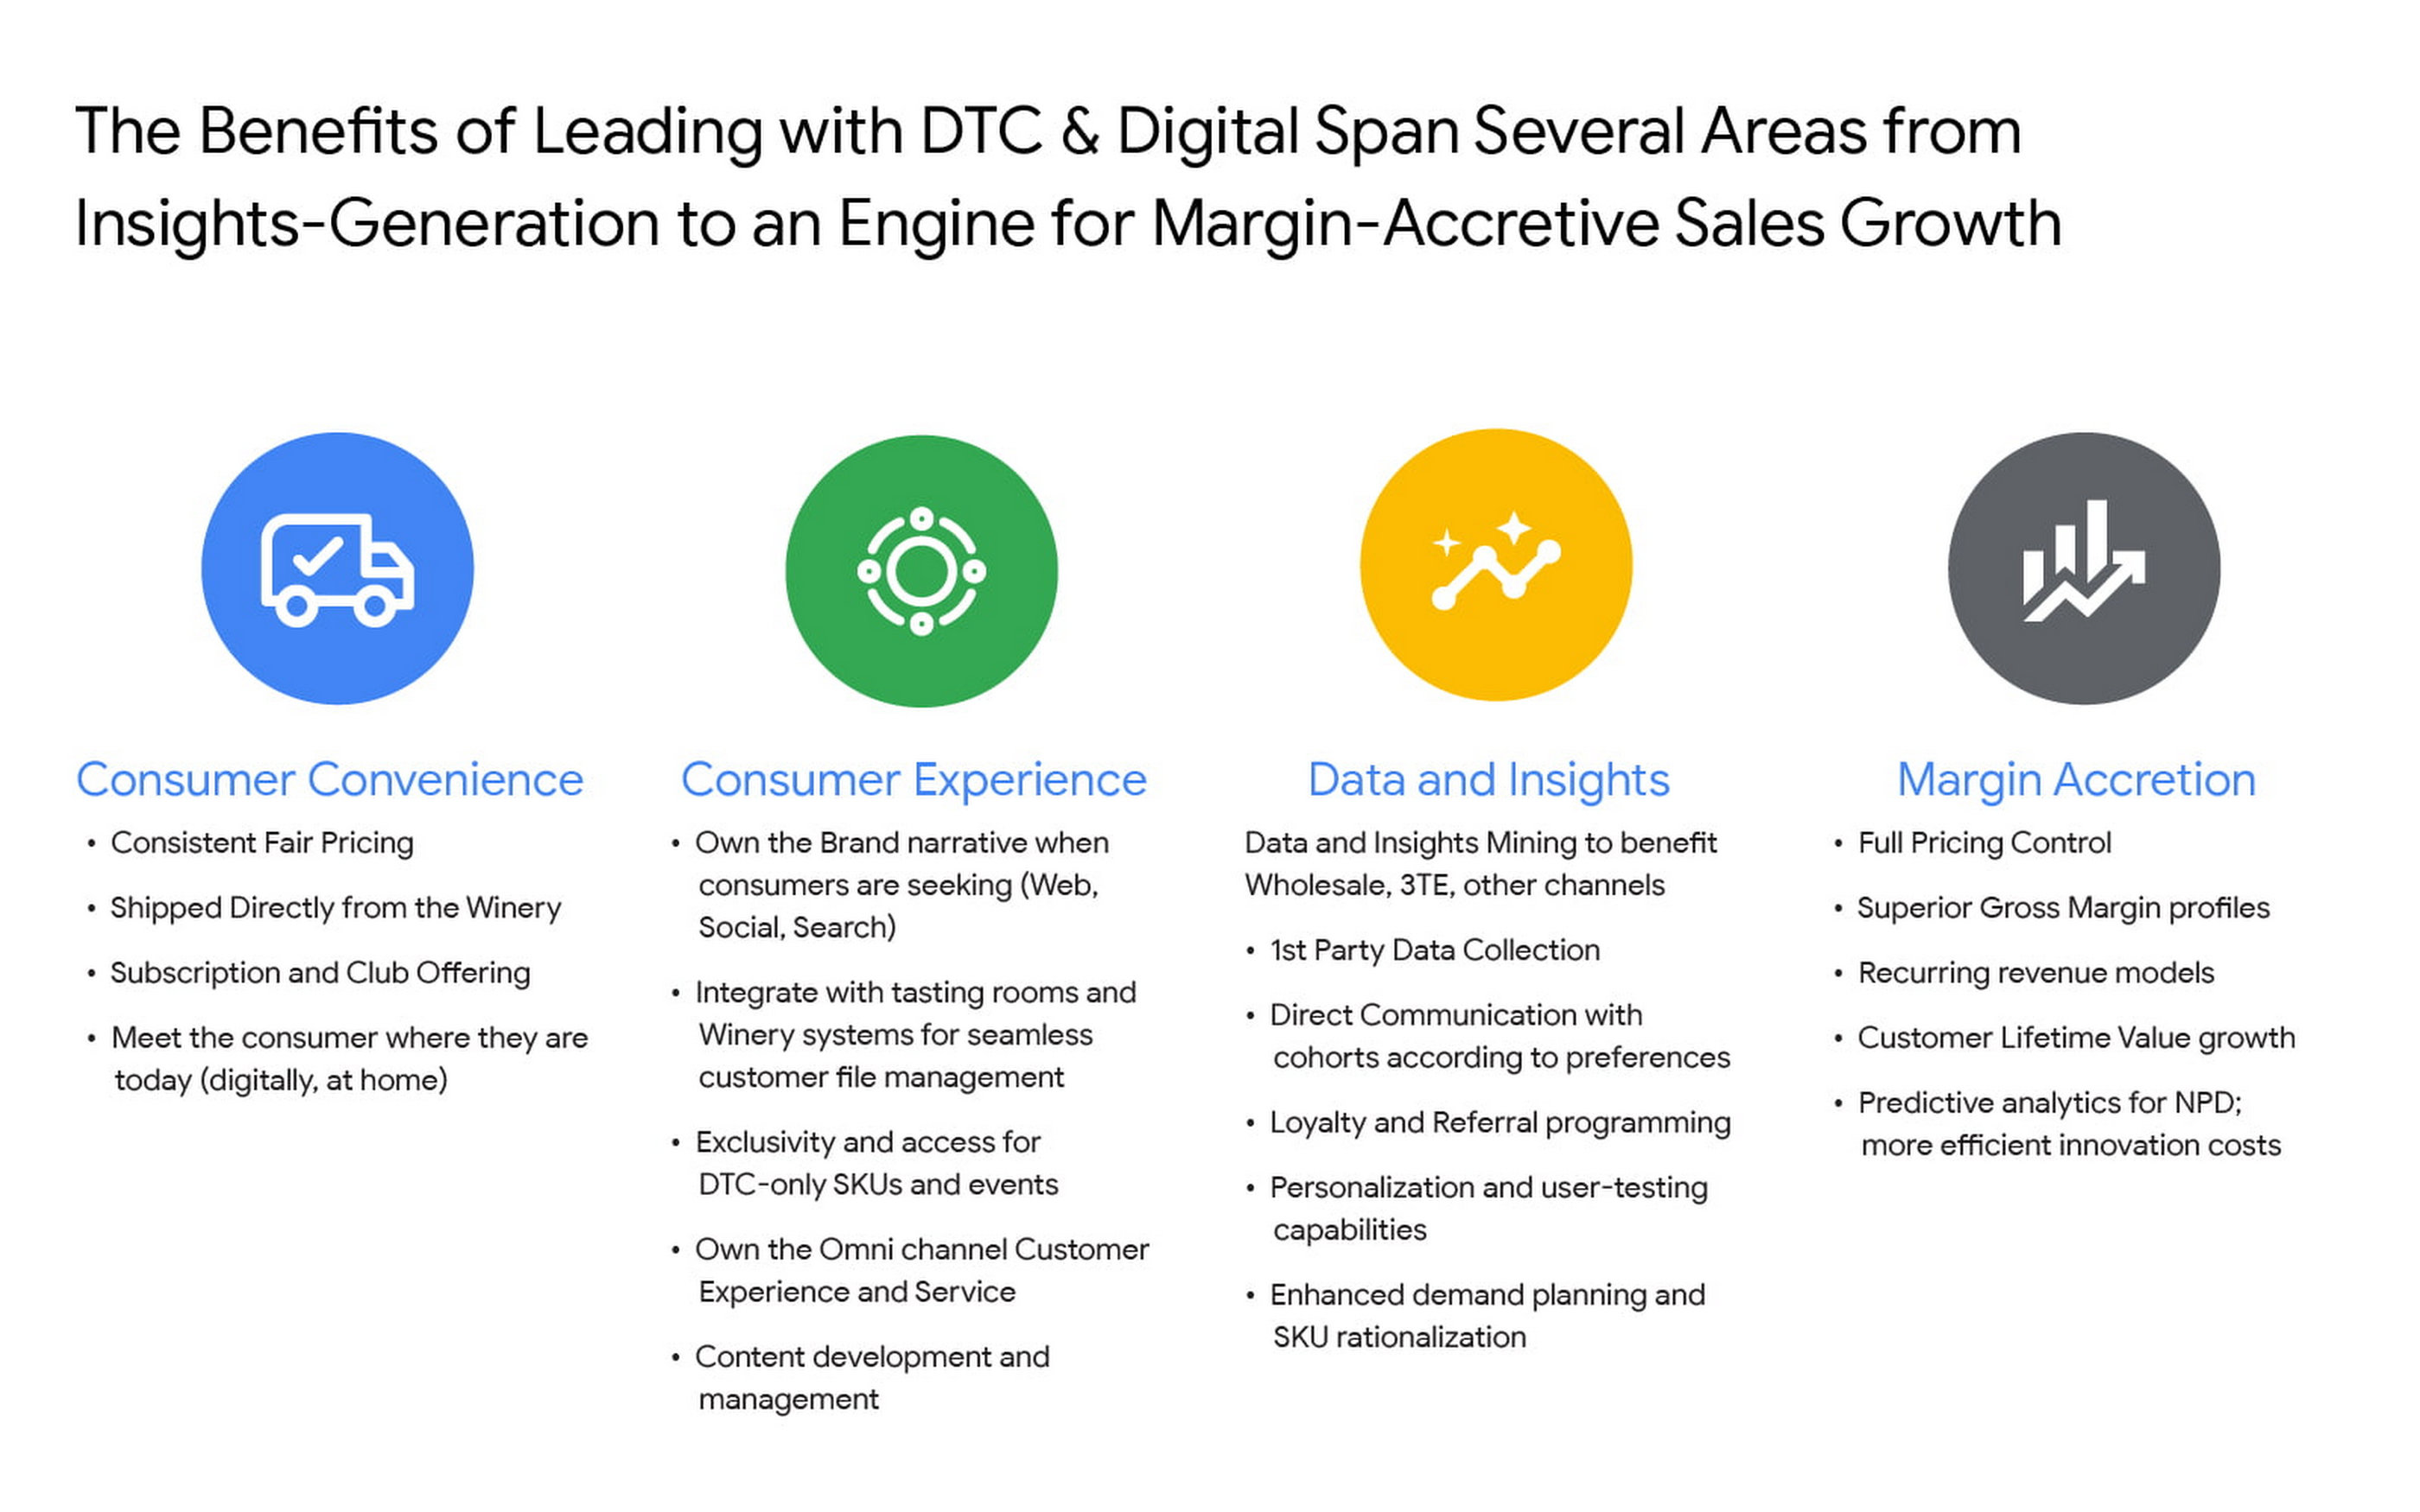
For Constellation Brands, each of these four pillars ring true, and our shift toward DTC is as much about margin accretion and revenue mix management as it is about consumer insights and data. The added complexities of the alcohol space add wrinkles to our DTC approach and manifest in many areas like consumer shopping preference, shipping and logistics hurdles, and more. In order to win share early and continue to lead the category, we recognized the need to harness the immense amount of first-party data to power impactful and actionable insights.
Our DTC technology architecture has fostered a value chain that is completely digitized: website traffic, marketing expenditures, tasting room transactions, e-commerce transactions, logistics and fulfillment events, cost of goods sold (COGS) and margin profiles, etc. are recorded and stored in a data warehouse in real time. For the first time, at any given moment, we can easily and deterministically answer complex business questions like “what is the age and gender distribution of my customers from Los Angeles who have purchased SKU X from Brand.com Y in the last 6 months? What is the cohort net promoter score? Did that increase after we introduced same-day shipping in this zip code? By how much?”
The ability to answer these questions and understand the root causes allows us to stay nimble with product offerings and iterate marketing strategies at the speed of consumer preference. Further, it enables us to optimize our omnichannel presence in the same manner by leaning on DTC consumer insights to develop valuable strategies with key wholesale distribution partners and 3-Tier eCommerce partners like Drizly and Instacart. At its core, Constellation’s DTC practice is designed to be the consumer-centric “tip-of-the-spear” responsible for generating insights from which all sales channels, including wholesale, can benefit.
Constellation’s DTC technology approach prioritizes consumer-centricity and insights generation
We have taken a modern approach to building a digital commerce technology stack, leveraging a hub-and-spoke model built around Shopify Plus and other key emergent technology providers like email provider Klaviyo, loyalty platform Yotpo, Net Promoter Score measurer Delighted, Customer Service module Gorgias, payments processor Stripe, event reservations platform Tock, and many more. For digital marketing and analytics, we use Google Cloud and Google Marketing Platform, which includes products like Analytics 360, Tag Manager 360, and Search Ads 360.
To help gather, organize, and store all of the inbound data from the ecosystem, we partnered with SoundCommerce, a data processing platform for eCommerce businesses. Together with SoundCommerce, we are able to automate data ingestion from all endpoints into a central data warehouse in Google BigQuery. With BigQuery, our data team is able to break data silos and quickly analyze large volumes of data that help unlock actionable insights about our business. BigQuery itself allows for out-of-the-box predictive analytics using SQL via BigQuery ML, and a key differentiator for us is that all Google Marketing Platform data is natively accessible for analysis within BigQuery.
But data possession only addresses half of the opportunity: we needed a powerful and modern business intelligence platform to help make sense of the vast amounts of data flowing into the system. Core to the search was to find a partner that approached BI in a way that fit with our future-looking strategy.
Our DTC team relies on the accurate measurement of variable metrics like Customer Acquisition Cost (CAC), Customer Lifetime Value (CLV), Churn, and Net Promoter Score (NPS) as a bellwether of the health of the business and monitoring these figures on a daily basis is paramount to success. To enable us to keep an accurate pulse on strategic KPIs, we considered several incumbent BI platforms. Ultimately we selected Google Cloud’s Looker for a range of benefits that separated it from the rest of the pack.

From a vision perspective, in this particular case we felt Looker was most aligned with our belief that better decisions are made when everyone has access to accurate, up-to-date information. Looker allows us to realize that vision by surfacing data in a simple web-based interface that empowers everyone to take action with real-time data on critical commercial activities. Furthermore, Looker’s ability to automate and distribute formatted modules to a myriad of stakeholders on a regular cadence increases data literacy and business performance transparency.
From a product perspective, we chose Looker for it’s cloud offering, web-based interface, and centralized, agile modeling layer that creates a trusted environment for all users to confidently interact with data — without any actual data extraction. While other BI tools have centralized semantic layers that require skilled IT resources, we’ve experienced that those can lead to bottlenecks and limited agility. With Looker’s semantic layer, LookML, our BI Team, led by Peter Donald, can easily build upon their SQL knowledge to add both a high degree of control as well as flexibility to our data model. The fully browser-based development environment allows the data team to rapidly develop, test, and deploy code and is backed by robust and seamless Git source code management.
In parallel, LookML empowers business users to collaborate without the need for advanced SQL knowledge. Our data team curates interactive data experiences with Looker to help scale access and adoption. Business users can explore ad hoc analysis, create dashboards, and develop custom data experiences in the web-based environment to get the answers they need without relying on IT resources each time they have a new question, while also maintaining the confidence that the underlying data will always be accurate. This helps us meet our primary goal of providing all businesses users with the data access they need to monitor the pulse of key metrics in near real-time.
Impact and future of DTC BI at Constellation
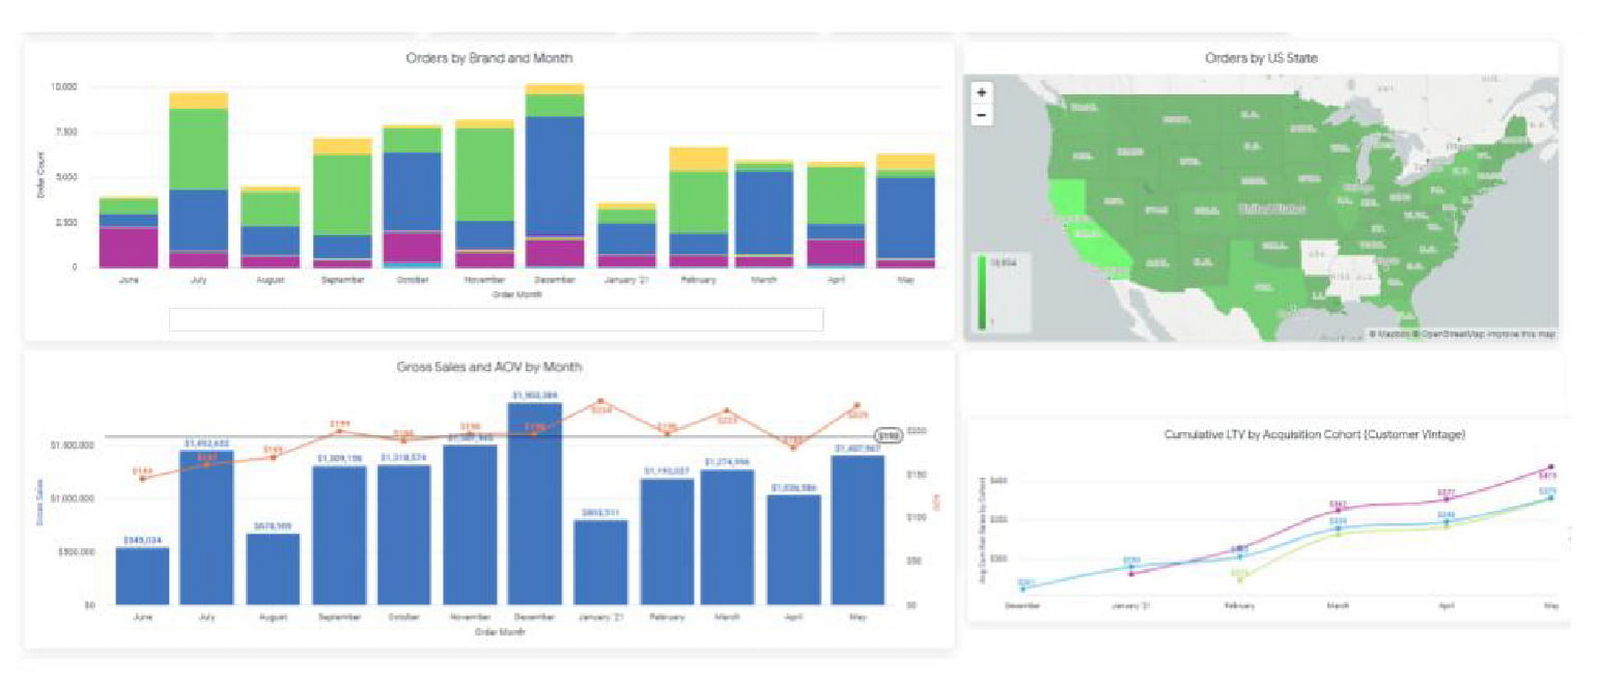
In short order, taking a modern and integrated approach to the DTC technology stack has delivered economic impact across the portfolio, helping our team understand and combat customer churn, increase conversion rates, and optimize the customer acquisition cost (CAC) and customer lifetime value (CLV) ratios. Perhaps most important is the benefit it can provide to the customer base. Mining customer data and consumer behavior generates data into what our customers are seeking, giving us insights to supply more, or less of it. For example, observing sales velocity and conversion rates by SKU or by region can help us better understand changes in customer taste profiles and fluctuations in demand, providing the foundation for a more powerful innovation pipeline and more effective sales and distribution tactics in wholesale. Our team has also been an early pilot tester for Looker’s new integration with Customer Match, which contributes to the virtuous cycle between data insight and data activation. In the future, our plan is to leverage this cycle to amplify the impact of Google Ads across Search, Shopping, and YouTube placements for the wine and spirits portfolio.
The operational impact of Looker is also substantial: our team estimates that the number of hours needed to reach critical business decisions has been reduced by nearly 60%, boosting productivity and accelerating the daily operating rhythm. A thoughtfully curated technology stack together with a modern BI solution allows us to stay at the vanguard of the industry. While the DTC sales channel is not designed to surpass the core business of wholesale for Constellation in terms of size, the approach enables unparalleled insights and measurement abilities that will pay dividends for the entire business for years to come.
A Comprehensive Guide for Understanding and Optimizing Your Dataflow Costs

1185
Of your peers have already read this article.
3:30 Minutes
The most insightful time you'll spend today!
Dataflow is the industry-leading platform that provides unified batch and streaming data processing capabilities, and supports a wide variety of analytics and machine learning use cases. It’s a fully managed service that comes with flexible development options (from Flex Templates and Notebooks to Apache Beam SDKs for Java, Python and Go), and a rich set of built-in management tools. It seamlessly integrates with not just Google Cloud products like Pub/Sub, BigQuery, Vertex AI, GCS, Spanner, and BigTable, but also third-party services like Kafka and AWS S3, to best meet your analytics and machine learning needs.
Dataflow’s adoption has ramped up in the past couple of years, and numerous customers now rely on Dataflow for everything from designing small proof of concepts, to large-scale production deployments. As customers are always trying to optimize their spend and do more with less, we naturally get questions related to cost optimization for Dataflow.
In this post, we’ve put together a comprehensive list of actions you can take to help you understand and optimize your Dataflow costs and business outcomes, based on our real-world experiences and product knowledge. We’ll start by helping you understand your current and near-term costs. We’ll then share how you can continuously evaluate and optimize your Dataflow pipelines over time. Let’s dive in!
Understand your current and near-term costs
The first step in most cost optimization projects is to understand your current state. For Dataflow, this involves the ability to effectively:
- Understand Dataflow’s cost components
- Predict the cost of potential jobs
- Monitor the cost of submitted jobs
Understanding Dataflow’s cost components
Your Dataflow job will have direct and indirect costs. Direct costs reflect resources consumed by your job, while indirect costs are incurred by the broader analytics/machine learning solution that your Dataflow pipeline enables. Examples of indirect costs include usage of different APIs invoked from your pipeline, such as:
- BigQuery Storage Read and Write APIs
- Cloud Storage APIs
- BigQuery queries
- Pub/Sub subscriptions and publishing, and
- Network egress, if any
Direct and indirect costs influence the total cost of your Dataflow pipeline. Therefore, it’s important to develop an intuitive understanding of both components, and use that knowledge to adopt strategies and techniques that help you arrive at a truly optimized architecture and cost for your entire analytics or machine learning solution. For more information about Dataflow pricing, see the Dataflow pricing page.
Predict the cost of potential jobs
You can predict the cost of a potential Dataflow job by initially running the job on a small scale. Once the small job is successfully completed, you can use its results to extrapolate the resource consumption of your production pipeline. Plugging those estimates into the Google Cloud Pricing Calculator should give you the predicted cost of your production pipeline. For more details about predicting the cost of potential jobs, see this (old, but very applicable) blog post on predicting the cost of a Dataflow job.
Monitor the cost of submitted jobs
You can monitor the overall cost of your Dataflow jobs using a few simple tools that Dataflow provides out of the box. Also, as you optimize your existing pipelines, possibly using recommendations from this blog post, you can monitor the impact of your changes on performance, cost, or other aspects of your pipeline that you care about. Handy techniques for monitoring your Dataflow pipelines include:
- Use metrics within the Dataflow UI to monitor key aspects of your pipeline.
- For CPU intensive pipelines, profile the pipeline to gain insight into how CPU resources are being used throughout your pipeline.
- Experience real-time cost control by creating monitoring alerts on Dataflow job metrics which ship out of the box, and that can be good proxies for the cost of your job. These alerts send real-time notifications once the metrics associated with a running pipeline exceeds a predetermined threshold. We recommend that you only do this for your critical pipelines, so you can avoid notification fatigue.
- Enable Billing Export into BiqQuery, and perform deep, ad-hoc analyses of your Dataflow costs that help you understand not just the key drivers of your costs, but also how these drivers are trending over time.
- Create a labeling taxonomy, and add labels to your Dataflow jobs that help facilitate cost attribution during the ad-hoc analyses of your Dataflow cost data using BigQuery. Check out this blog post for some great examples of how to do this.
- Run your Dataflow jobs using a custom Service Account. While this is great from a security perspective, it also has the added benefit of enabling the easy identification of APIs used by your Dataflow job.
Optimize your Dataflow costs
Once you have a good understanding of your Dataflow costs, the next step is to explore opportunities for optimization. Topics to be considered during this phase of your cost optimization journey include:
- Your optimization goals
- Key factors driving the cost of your pipeline
- Considerations for developing optimized batch and streaming pipelines
Let’s look at each of these topics in detail.
Goals
The goal of a cost optimization effort may seem obvious: “reduce my pipeline’s cost.” However, your business may have other priorities that have to be carefully considered and balanced with the cost reduction goal. From our conversations with customers, we have found that most Dataflow cost optimization programs have two main goals:
1. Reduce the pipeline’s cost
2. Continue meeting the service level agreements (SLAs) required by the business
Cost factors
Opportunities for optimizing the cost of your Dataflow pipeline will be based on the key factors driving your costs. While most of these factors will be identified through the process of understanding your current and near term costs, we have identified a set of frequently recurring cost factors, which we have grouped into three buckets: Dataflow configuration, performance, and business requirements.
Dataflow configuration includes factors like:
- Should your pipeline be streaming or batch?
- Are you using Dataflow services like Streaming Engine, or FlexRS?
- Are you using a suitable machine type and disk size?
- Should your pipeline be using GPUs?
- Do you have the right number of initial and maximum workers?
Performance includes factors like:
- Are your SDK versions (Java, Python, Go) up to date?
- Are you using IO connectors efficiently? One of the strengths of Apache Beam is a large library of IO connectors to different storage and queueing systems. Apache Beam IO connectors are already optimized for maximum performance. However, there may be cases where there are trade-offs between cost and performance. For example, BigQueryIO supports several write methods, each of them with somewhat different performance and cost characteristics. For more details, see slides 19 – 22 of the Beam Summit session on cost optimization.
- Are you using efficient coders? Coders affect the size of the data that needs to be saved to disk or transferred to a dedicated shuffle service in the intermediate pipeline stages, and some coders are more efficient than others. Metrics like total shuffle data processed and total streaming data processed can help you identify opportunities for using more efficient coders. As a general rule, you should consider whether the data that appears in your pipeline contains redundant data that can be eliminated by both filtering out unused columns as early as possible, and using efficient coders such as AvroCoder or RowCoder. Also, remember that if stages of your pipeline are fused, the coders in the intermediate steps become irrelevant.
- Do you have sufficient parallelism in your pipeline? The execution details tab, and metrics like processing parallelism keys can help you determine whether your pipeline code is taking full advantage of Apache Beam’s ability to do massively parallel processing (for more details, see parallelism). For example, if you have a transform which outputs a number of records for each input record (“high fan-out transform”) and the pipeline is automatically optimized using Dataflow fusion optimization, the parallelism of the pipeline can be suboptimal, and may benefit from preventing fusion. Another area to watch for is “hot keys.” This blog discusses this topic in great detail.
- Are your custom transforms efficient? Job monitoring techniques like profiling your pipeline and viewing relevant metrics can help you catch and correct your inefficient use of custom transforms. For example, if your Java transform needs to check if the data matches a certain regular expression pattern, then compiling that pattern in the setup method and doing the matching using the precompiled pattern in the “process element” method is much more efficient. The simpler, but inefficient alternative is to use the String.matches() call in the “process element” method, which will have to compile the pattern every time. Another consideration regarding custom transforms is that grouping elements for external service calls can help you prepare optimal request batches for external API calls. Finally, transforms that perform multi-step operations (for example, calls to external APIs that require extensive processes for creating and closing the client for the API) can often benefit from splitting these operations, and invoking them in different methods of the ParDo (for more details, see ParDo life cycle).
- Are you doing excessive logging? Logs are great. They help with debugging, and can significantly improve developer productivity. On the other hand, excessive logging can negatively impact your pipeline’s performance.
Business requirements can also influence your pipeline’s design, and increase costs. Examples of such requirements include:
- Low end-to-end ingest latency
- Extremely high throughput
- Processing late arriving data
- Processing streaming data spikes
Considerations for developing optimized data pipelines
From our work with customers, we have compiled a set of guidelines that you can easily explore and implement to effectively optimize your Dataflow costs. Examples of these guidelines include:
Batch and streaming pipelines:
- Consider keeping your Dataflow job in the same region as your IO source and destination services.
- Consider using GPUs for specialized use cases like deep-learning inference.
- Consider specialized machine types for memory- or compute-intensive workloads.
- Consider setting the maximum number of workers for your Dataflow job.
- Consider using custom containers to pre-install pipeline dependencies, and speed up worker startup time.
- Where necessary, tune the memory of your worker VMs.
- Reduce your number of test and staging pipelines, and remember to stop pipelines that you no longer need.
Batch pipelines:
- Consider FlexRS for use cases that have start time and run time flexibility.
- Run fewer pipelines on larger datasets. Starting and stopping a pipeline incurs some cost, and processing a very small dataset in a batch pipeline can be inefficient.
- Consider defining the maximum duration for your jobs, so you can eliminate runaway jobs, which keep running without delivering value to your business.
Summary
In this post, we introduced you to a set of knowledge and techniques that can help you understand the current and near-term costs associated with your Dataflow pipelines. We also shared a series of considerations that can help you optimize your Dataflow pipelines, not just for today, but also as your business evolves over time. We shared lots of resources with you, and hope that you find them useful. We look forward to hearing about the savings and innovative solutions that you are able to deliver for your customers and your business.
6581
Of your peers have already watched this video.
8:00 Minutes
The most insightful time you'll spend today!
Hospitals Can Offer Interconnected Patient Experiences Using Google’s Natural Language Services
Machine Learning (ML) in healthcare helps extract data from conversations, medical records, forms, research reports, insurance claims and other documents across the care value-chain to help care providers have a holistic view of their patients to draw insights for diagnoses and treatments. With Natural Language Processing(NLP), healthcare organizations can program computers and systems to process and analyse large volumes of human communication in form of spoken texts, written documentation and utterances. Watch the video to learn how the healthcare community can leverage Google’s NLP services to process structured and unstructured data to offer interconnected experiences for patients.
More Relevant Stories for Your Company

S4 Agtech Transforms Agriculture with Google Cloud
Like countless other industries, farming is going digital and undergoing big changes—driven by access to more actionable information. The agriculture business can now gather and analyze georeferenced data from satellites, combined with data from IoT sensors in fields, crop rotation and yield histories, weather patterns, seed genotypes and soil composition to help

Your DW Need Scaling Up? Try What This Company Did: It Can Run 25,000 Events a Second
With access to more data than ever before, companies have never been better positioned to adopt precision marketing methods and target the right customers at the right time. Emarsys, a digital marketing platform, enables its clients to collect, analyze, and act on a wide variety of data. From websites to mobile

The Fantastic Story of How BMG Enables a Micropayments Strategy So Music Artists Get Paid
The music industry is rapidly changing. Only 20 years ago, the availability of music and the infrastructure that was required to make an album a sales success were incredibly complex and expensive. With the decline of physical sales and a fundamental shift to digital, music streaming now accounts for more

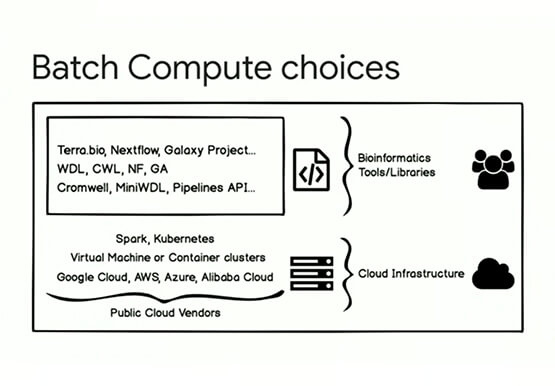
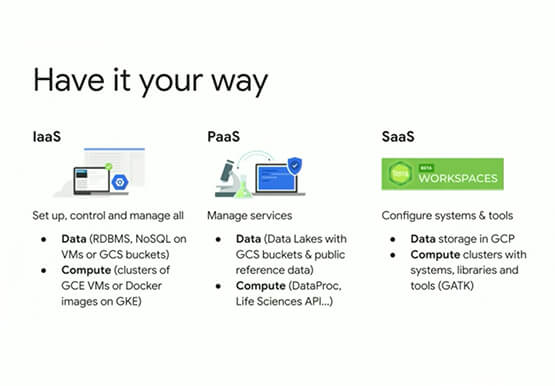

GCP for Bioinformatics
Join Cloud GDE and developer Lynn Langit in this fast-paced session to get resources you can use to learn how to use the Google Cloud Platform for bioinformatics. Lynn has created an open source course (on GitHub) to introduce researchers to using GCP to scale their analysis jobs. In this
