





Vodafone Leverages Google Cloud to Aid COVID-19 Frontline with Anonymized Insights on Population Mobility

11187
Of your peers have already read this article.
1:30 Minutes
The most insightful time you'll spend today!
Editor’s note: When Europe’s largest mobile communications company, Vodafone, was asked by the European Commission to help understand population movement across the European Union and the UK to help fight COVID-19, it was able to provide anonymized mobile network-based insights to answer the call. Here’s how Vodafone, with the support of Google Cloud, rapidly mobilized the COVID-19 frontline, while respecting its customers’ privacy.
With the emergence of COVID-19 in early 2020, the European Commission—the executive branch of the European Union (EU)—knew that technology would be instrumental in its fight to control the pandemic. With various lockdowns imposed across its member states, the Commission was keen to predict and prevent the spread of COVID-19 and to manage the related social, political and financial impacts.
Mobile network data helps track COVID-19 across the EU
Mobile networks produce location data, which can be turned into useful anonymous insights to understand population movement within a geographic area. The European Commission, working with mobile industry association GSMA (Groupe Speciale Mobile Association), asked Europe’s major mobile phone operators for help in producing insights to support the fight against COVID-19. As the largest mobile network operator within the EU, Vodafone saw this as a critical opportunity to participate.
Vodafone had previous experience of using mobile network data to support pandemic research. For example, in 2019, Vodafone provided mobility pattern analysis to help track the spread of Malaria in Mozambique. And, during the early stages of the COVID-19 pandemic (prior to working with the European Commission), Vodafone assisted the Italian and Spanish governments in understanding their citizens’ mobility patterns. Vodafone had also previously offered anonymized and aggregated population mobility insights to support public transport and tourism authorities and retail organizations in a number of countries. Consequently, Vodafone was perfectly placed to play a greater role in supporting the European Commission’s response to the pandemic.
When asked to assist the European Commission, Vodafone first considered how it could safely share its data with the governing body without providing details on the individual movements of its customers. It realized it could achieve this through an elaborate set of anonymization and aggregation techniques. Insights are aggregated from a minimum of 50 users and Vodafone only shared these anonymous insights and never the actual raw data with the Commission. As specified by the EU, these insights are then presented onto a large geographical region, typically a city or a county with thousands of people living in that area.
These insights illustrate how people move, helping to determine how lockdowns and self-isolation measures were impacting behaviors.
Using Google Cloud to collate and store population mobility data
In April 2020, Vodafone began migrating its operations, including its mobile data, to Google Cloud on servers in Europe and the UK with elaborate security safeguards, including encryption, building on a previous partnership.
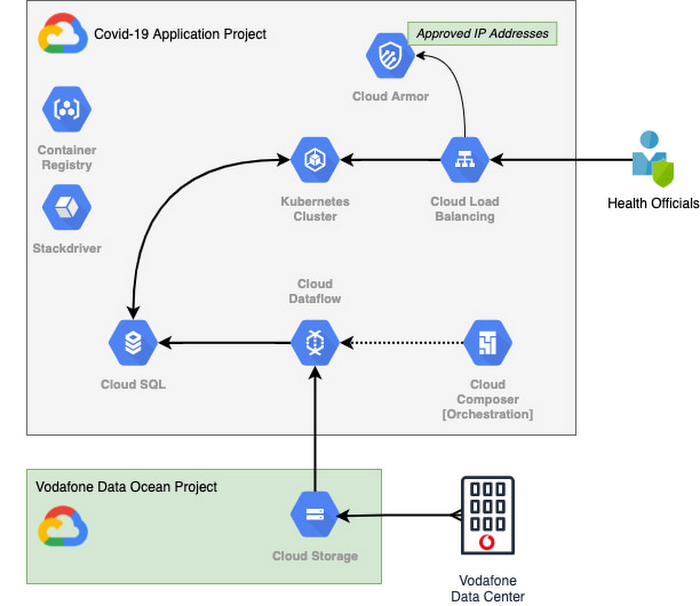
With the data residing in EU and UK data centers and not the United States, Vodafone could then retrieve anonymous insights from Google Cloud Storage instantaneously. Before supplying any information to the European Commission, however, Vodafone used Dataflow to validate the data and run a series of tests to ensure the database had accurate data, before ingesting and archiving the relevant metrics. For instant access, the data was then made available to the European Commission using a Redis database on Google Kubernetes Engine.
To ensure aggregate Vodafone customer data was always safe, secure, and anonymous, all entry points to the front-end were protected behind Google Cloud Armor, where only specific IP addresses were allowed. Using these tools, seamless data pipelines fed in predefined key performance indicators from each specified European market. While data quality measures ensured the definitions for metrics across markets were consistent and could be accurately compared.
The architecture (pictured below) shows how Vodafone integrated and anonymized its data on Google Cloud.
Live interactive dashboard shows population mobility in real-time
With its data integrated on Google Cloud, Vodafone created a live, interactive dashboard to track mobility patterns and share relevant information with the European Commission in real-time.
The European Commission Joint Research Center (JRC) was able to gather valuable information from these insights, which enabled them to see where population mobility was aiding the spread of the disease, when cross-referenced with health data. It could also assess the implications of lockdowns on different populations and forecast cross-country spreading.
Mobile data aids disease modeling for multiple stakeholders
The Vodafone data became instrumental in modeling the likely course of the disease too. For example, the University of Southampton in the UK used it to predict the outcome of different coordinated COVID-19 exit strategies across Europe. This research was published in Science Magazine in September 2020.
The Vodafone data dashboard continues to be used by individual governments, NGOs and organizations to further investigate the impacts of the pandemic and to measure the effectiveness of response strategies alongside the rollout of vaccination programs. The project also helped Vodafone win a DataIQ award for most effective stakeholder engagement.
Using the learnings from this project, Vodafone has been able to adapt its own B2B solution, called Vodafone Analytics, by adaptIng and migrating the code to work in Google Cloud Platform. This solution has been rolled out across Germany, Greece, Portugal and South Africa, and new countries are being onboarded every day. Vodafone Analytics already has more than 100 customers leveraging it for a variety of use cases—Italian fashion retailer OVS, uses it for its smart retail operation, while global real estate company, JLL, uses it to understand the footfall passing through its properties.
Working together, Vodafone and Google Cloud continue to help a range of organizations, governments, and NGOs navigate through the ongoing pandemic, optimize their operations, and help the greater good, without infringing individuals’ fundamental rights to privacy.
To learn more about Google Cloud and Vodafone, watch our full interview here.
DR for Cloud: Architecting Microsoft SQL Server with Google Cloud

3763
Of your peers have already read this article.
2:45 Minutes
The most insightful time you'll spend today!
Database disaster recovery (DR) planning is an important component of a bigger DR plan, and for enterprises using Microsoft SQL Server on Compute Engine, it often involves critical data.
When you’re architecting a disaster recovery solution with Microsoft SQL Server running on Google Cloud Platform (GCP), you have some decisions to make to build an effective, comprehensive plan.
Microsoft SQL Server includes a variety of disaster recovery strategies and features, such as Always On availability groups or Failover Cluster Instances.
And Google Cloud is designed from the start for resilience and availability. There are several types of data centers available within GCP where you can map SQL Server’s availability features based on your specific requirements: zones and regions. Zones are autonomous data centers co-located within a GCP region. These regions are available in different geographies such as North America or APAC.
However, there is no single disaster recovery strategy to map Microsoft SQL Server DR features to Google Cloud’s data center topology that satisfies every possible combination of disaster recovery requirements.
As a database architect, you have to design a custom disaster recovery strategy based on your specific use cases and requirements.
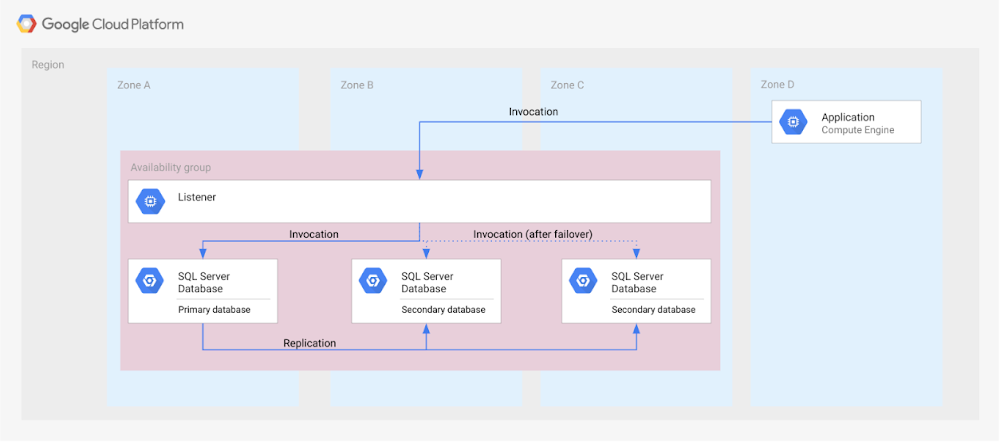
Our new Disaster Recovery for Microsoft SQL Server solution provides information on Microsoft’s SQL Server disaster recovery strategies, and shows how you can map them to zones and regions in GCP based on your business’s particular criteria and requirements. One example is deploying an availability group within a region across three zones (shown in the diagram below).
For successful DR planning, you should have a clear conceptual model and established terminology in place. In this solution, you’ll find a base set of concepts and terms in context of Google Cloud DR. This includes defining terms like primary database, secondary database, failover, switchover, and fallback.
You’ll also find details on recovery point objective, recovery time objective and single point of failure domain, since those are key drivers for developing a specific disaster recovery solution.
Building a DR solution with Microsoft SQL Server in GCP regions
To get started with implementing the availability features of Microsoft SQL Server in the context of Google Cloud, take a look at this diagram, which shows the implementation of an Always On availability group in a GCP region, using several zones:
In the new solution, you’ll see other availability features, like log shipping, along with how they map to GCP. In addition, features in Microsoft SQL Server that are not deemed availability features—like server replication and backup file shipping—can actually be used for disaster recovery, so those are included as well.
Disaster recovery features of Microsoft SQL Server do not have to be used in isolation and can be combined for more complex and demanding use cases. For example, you can set up availability groups in two regions with log shipping as the transfer mechanism between the regions.
Disaster Recovery for Microsoft SQL Server also describes the disaster recovery process itself, how to test and verify a defined disaster recovery solution, and outlines a basic approach, step-by-step.
Datashare for Financial Services: Securing the Publishers and Consumers’ Access to Market Data

8573
Of your peers have already read this article.
4:30 Minutes
The most insightful time you'll spend today!
Access to the cloud has advanced the distribution and consumption of financial information on a global scale. In parallel, the global financial data landscape has been transformed by an influx of alternative data sources, including social media, meteorological data, satellite imagery, and other data. Exchanges and market data providers now find they need to include these new datasets to enrich their products and compete, which has meant they now must consider cloud-based models to keep up with the demands of their customers who expect easy, quick, flexible and cost-efficient ways to consume market data.
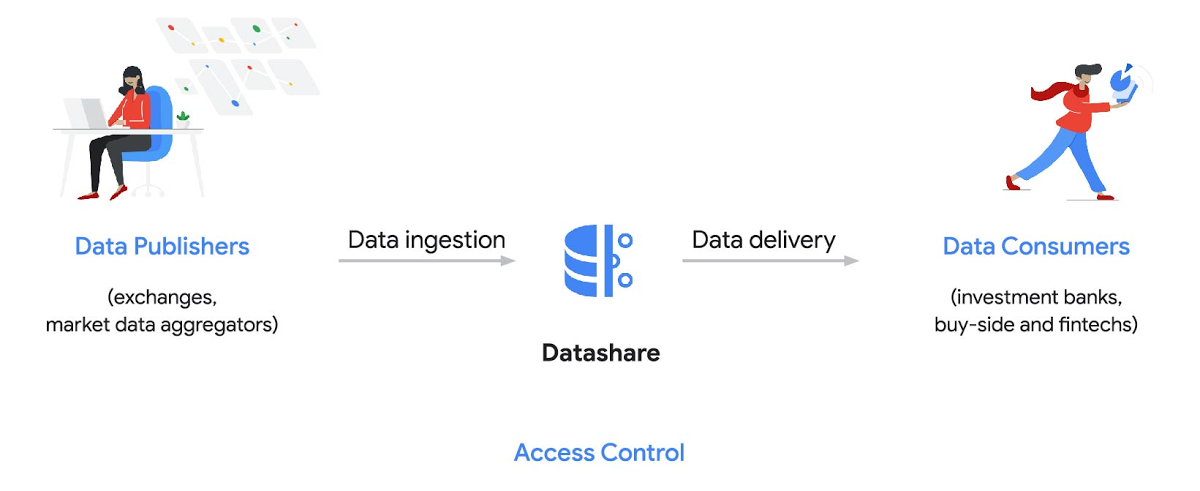
To address these needs, today we’re announcing the general availability of Datashare for financial services, a new Google Cloud solution that brings together the entire capital markets ecosystem—data publishers, and data consumers—to exchange market data securely and easily.
Datashare helps organize third-party financial information, making it accessible and useful to market data publishers and data consumers. We open-sourced the entire Datashare solution so market data publishers can now onboard their licensed datasets to Google Cloud securely, quickly and easily, while data consumers can consume that data as a service in tools of their preference, such as BigQuery.
Three ways to distribute and consume your data
Batch data delivery
Datashare provides a batch data delivery mechanism for data publishers to deliver their reference data, historical tick data, alternative market data sources and more via BigQuery, reducing the administrative burden on data consumers to extract insights from data.
Real-time data streaming delivery
By using this event-based data delivery channel for rapidly changing instrument prices, tick data, orders, news and others via Pub/Sub, data consumers can reliably process individual messages or rewind to a point in time to replay a prior market scenario and test model changes.
Monetizing licensed datasets
Market data publishers can onboard their licensed datasets to Google Cloud and make them available via a one-stop-shop on Google Cloud Marketplace, enabling a new sales channel to expand market reach.
Reference architecture
Check out the diagram below to see how you can share your batch and real-time data directly to your Google Cloud customers with BigQuery and Pub/Sub.

As you can see in the above reference architecture, both publishers and consumers can derive several benefits from the solution:
Benefits for data publishers
- You no longer have to maintain your own delivery and licensing infrastructure.
- You can easily package and deliver granular data products and experiments with SQL.
- You can have a solution that scales with your business as data volumes and number of customers grow.
Benefits for data consumers
- Your data is ready for analysis and machine learning (ML)— you no longer have to maintain extract, transform, and load (ETL) pipelines to load files and transform data.
- You can avoid the expense and burden of maintaining multiple copies of large data files.
- You can be more targeted with consumption of data using BigQuery queries, improving performance, and compliance, and reducing cost.
Accessing the datasets
Google Cloud has been working with multiple industry firms on innovating in the market data space. By using Datashare for publishing, data publishers can make their entire datasets available on Google Cloud. Early adopters of Datashare include firms such as OneTick and Accern. OneTick’s datasets include reference and historical futures data (that can be accessed in our console with your login). Accern’s datasets include alternative data such as market sentiment and credit analysis data (that can be accessed in our console with your login).
To make it more helpful, we partnered with Accern to create a hypothetical scenario to describe the data acquisition and analytics process step-by-step.
Accern use case
As a sustainability analyst, you require an economic, social and governance (ESG) dataset to determine which sector is the most widely covered ESG sector by analysts, and to also identify the sector with the lowest ESG sentiment score. Now, you can discover and acquire an ESG dataset in Google Cloud.
Step 1. Navigate to the Financial Services solutions page in the Google Cloud console:

Step 2. Click a dataset, for example Accern AI-Generated ESG Insights, then review the overview details, plans and pricing, documentation and support information. To view the available pricing tiers, click ‘View All Plans’. Once you’ve decided on a tier that you would like to subscribe to, click ‘Select’, choose a billing account and review and accept the terms of service to complete the subscription. Once the steps are complete, click ‘Subscribe’ at the bottom. An overlay window will appear, click ‘Register with Accern’ to activate and complete the subscription.
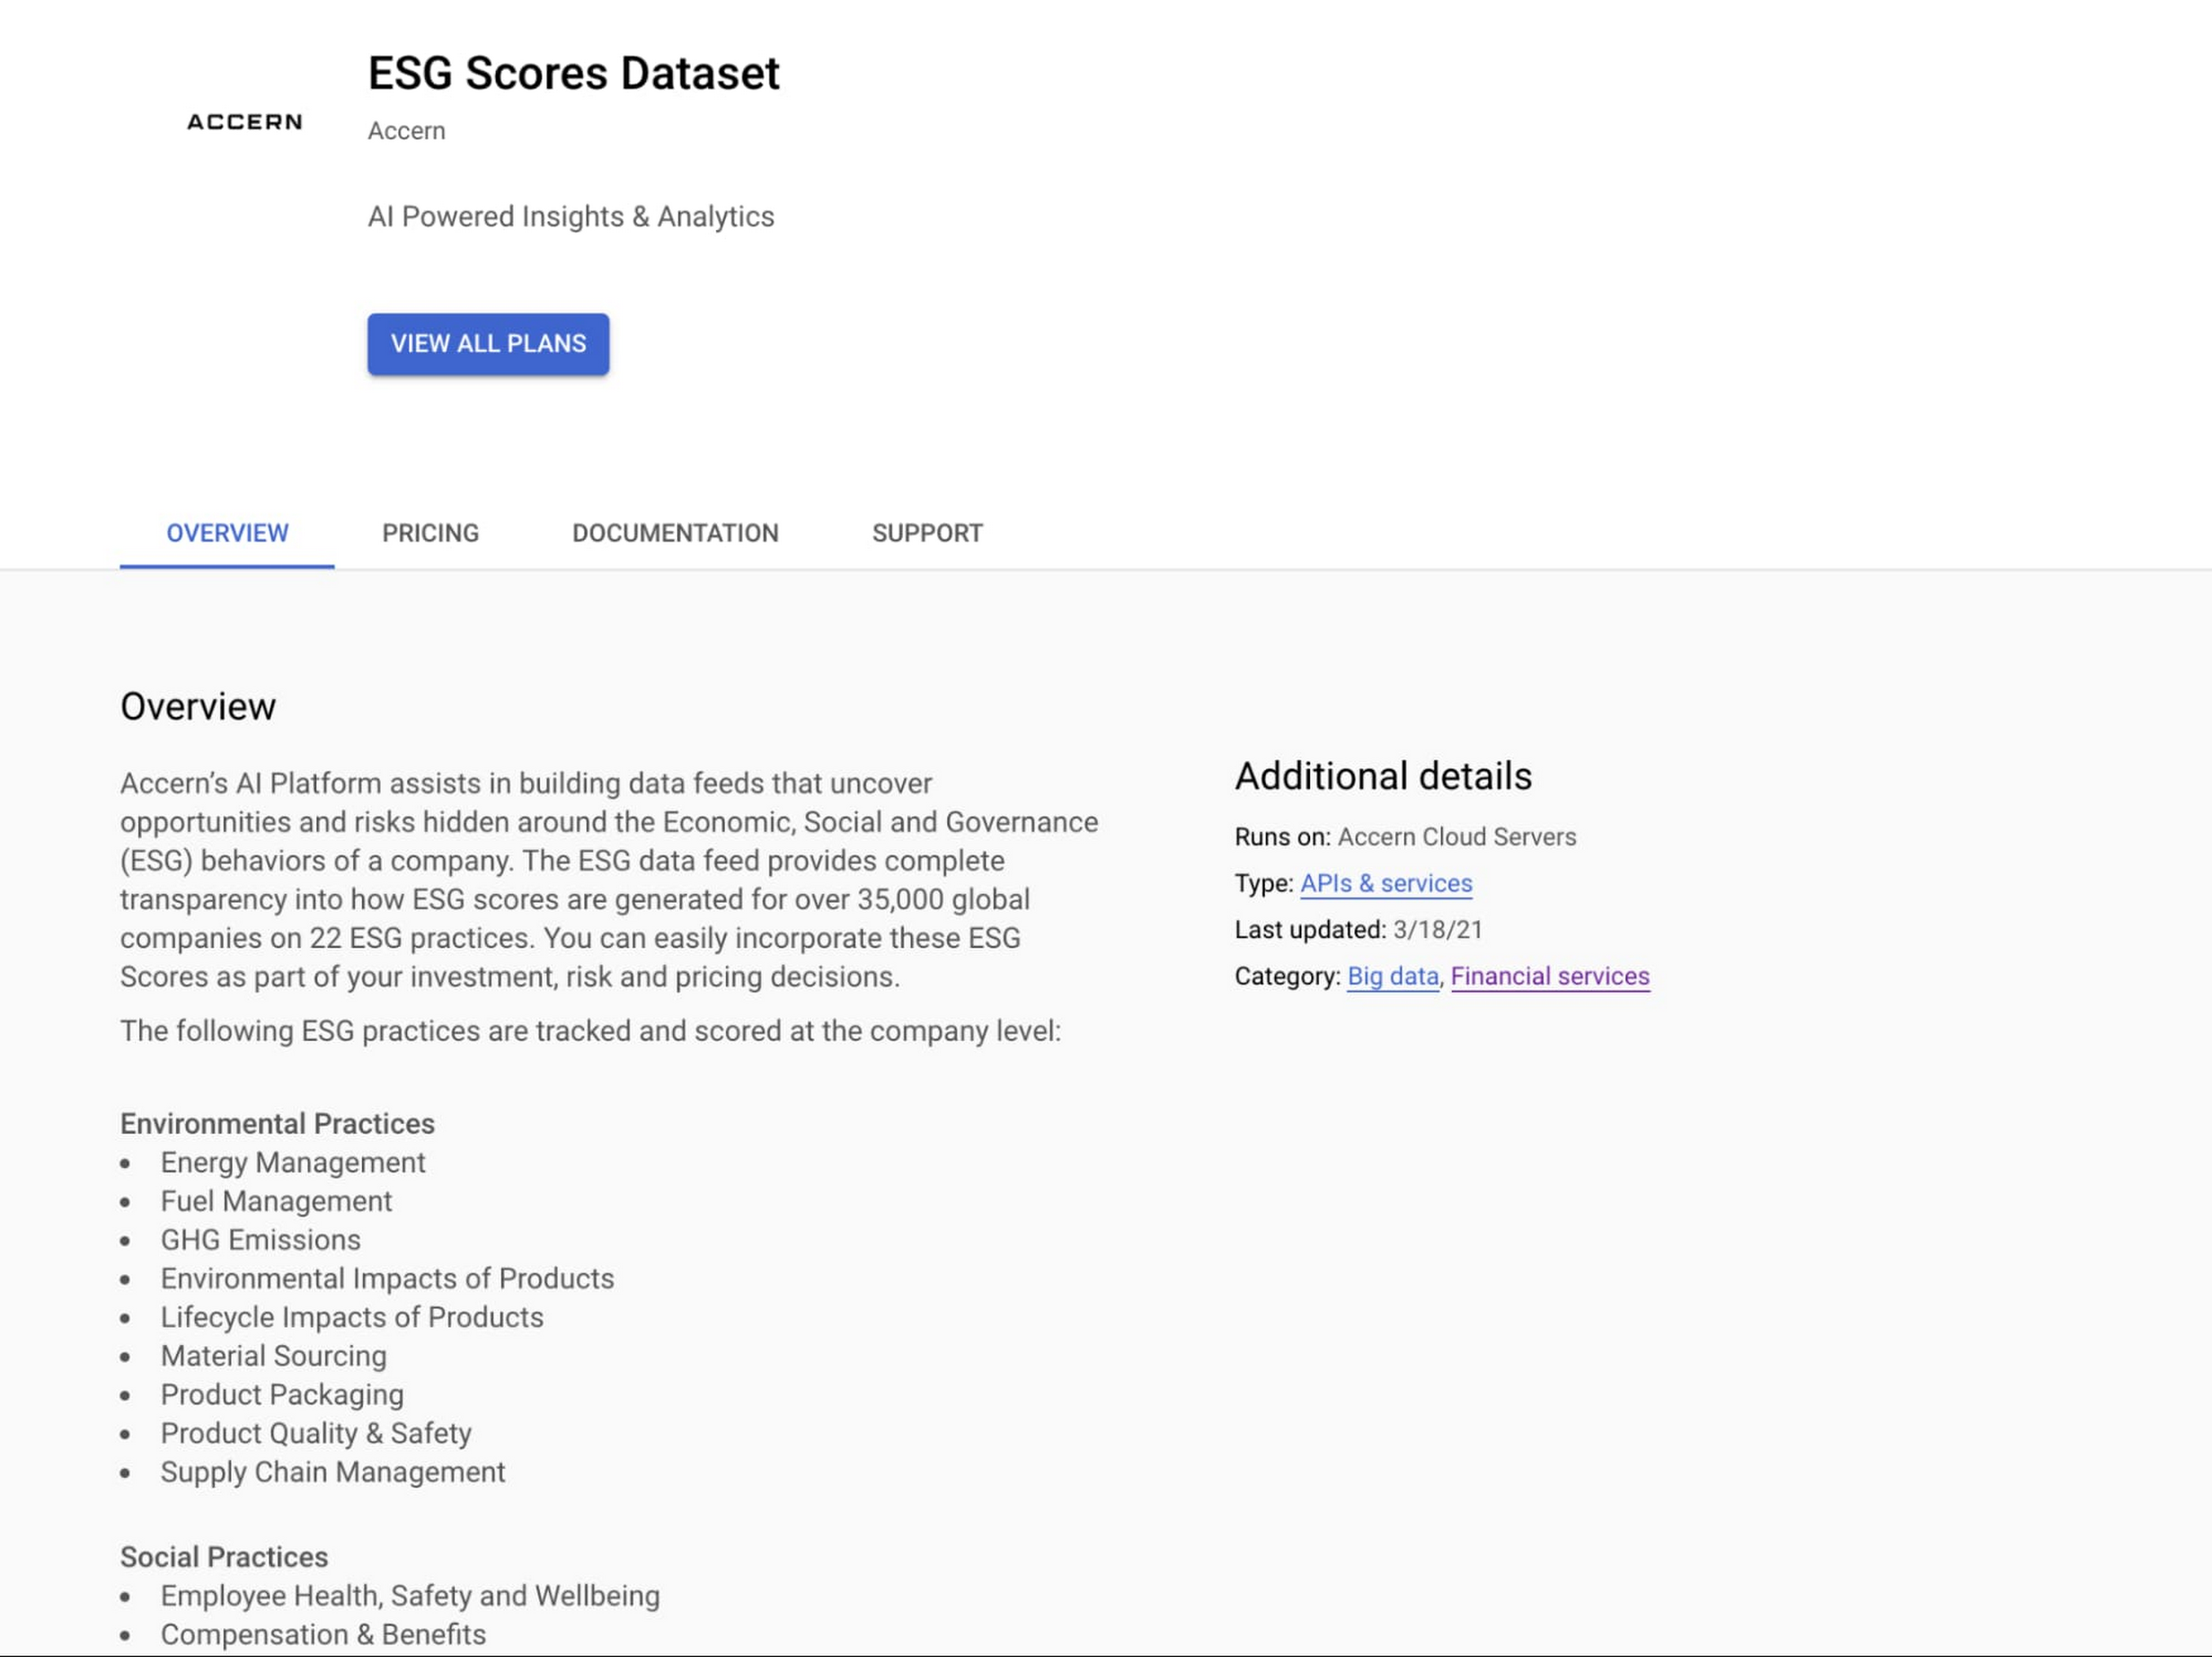

Step 3. Once activation is complete, you’ll be directed to the Datashare ‘My Products’ screen. Voila! You are now subscribed to Accern’s ESG Scores dataset and can access it in your Google Cloud instance using BigQuery. To access the data, click the hour glass icon on the corresponding ‘My Products’ record that you just purchased. An overlay will present you with the details on the dataset and/or table. Click the ‘Navigate to Table’ button to navigate through to the BigQuery console.

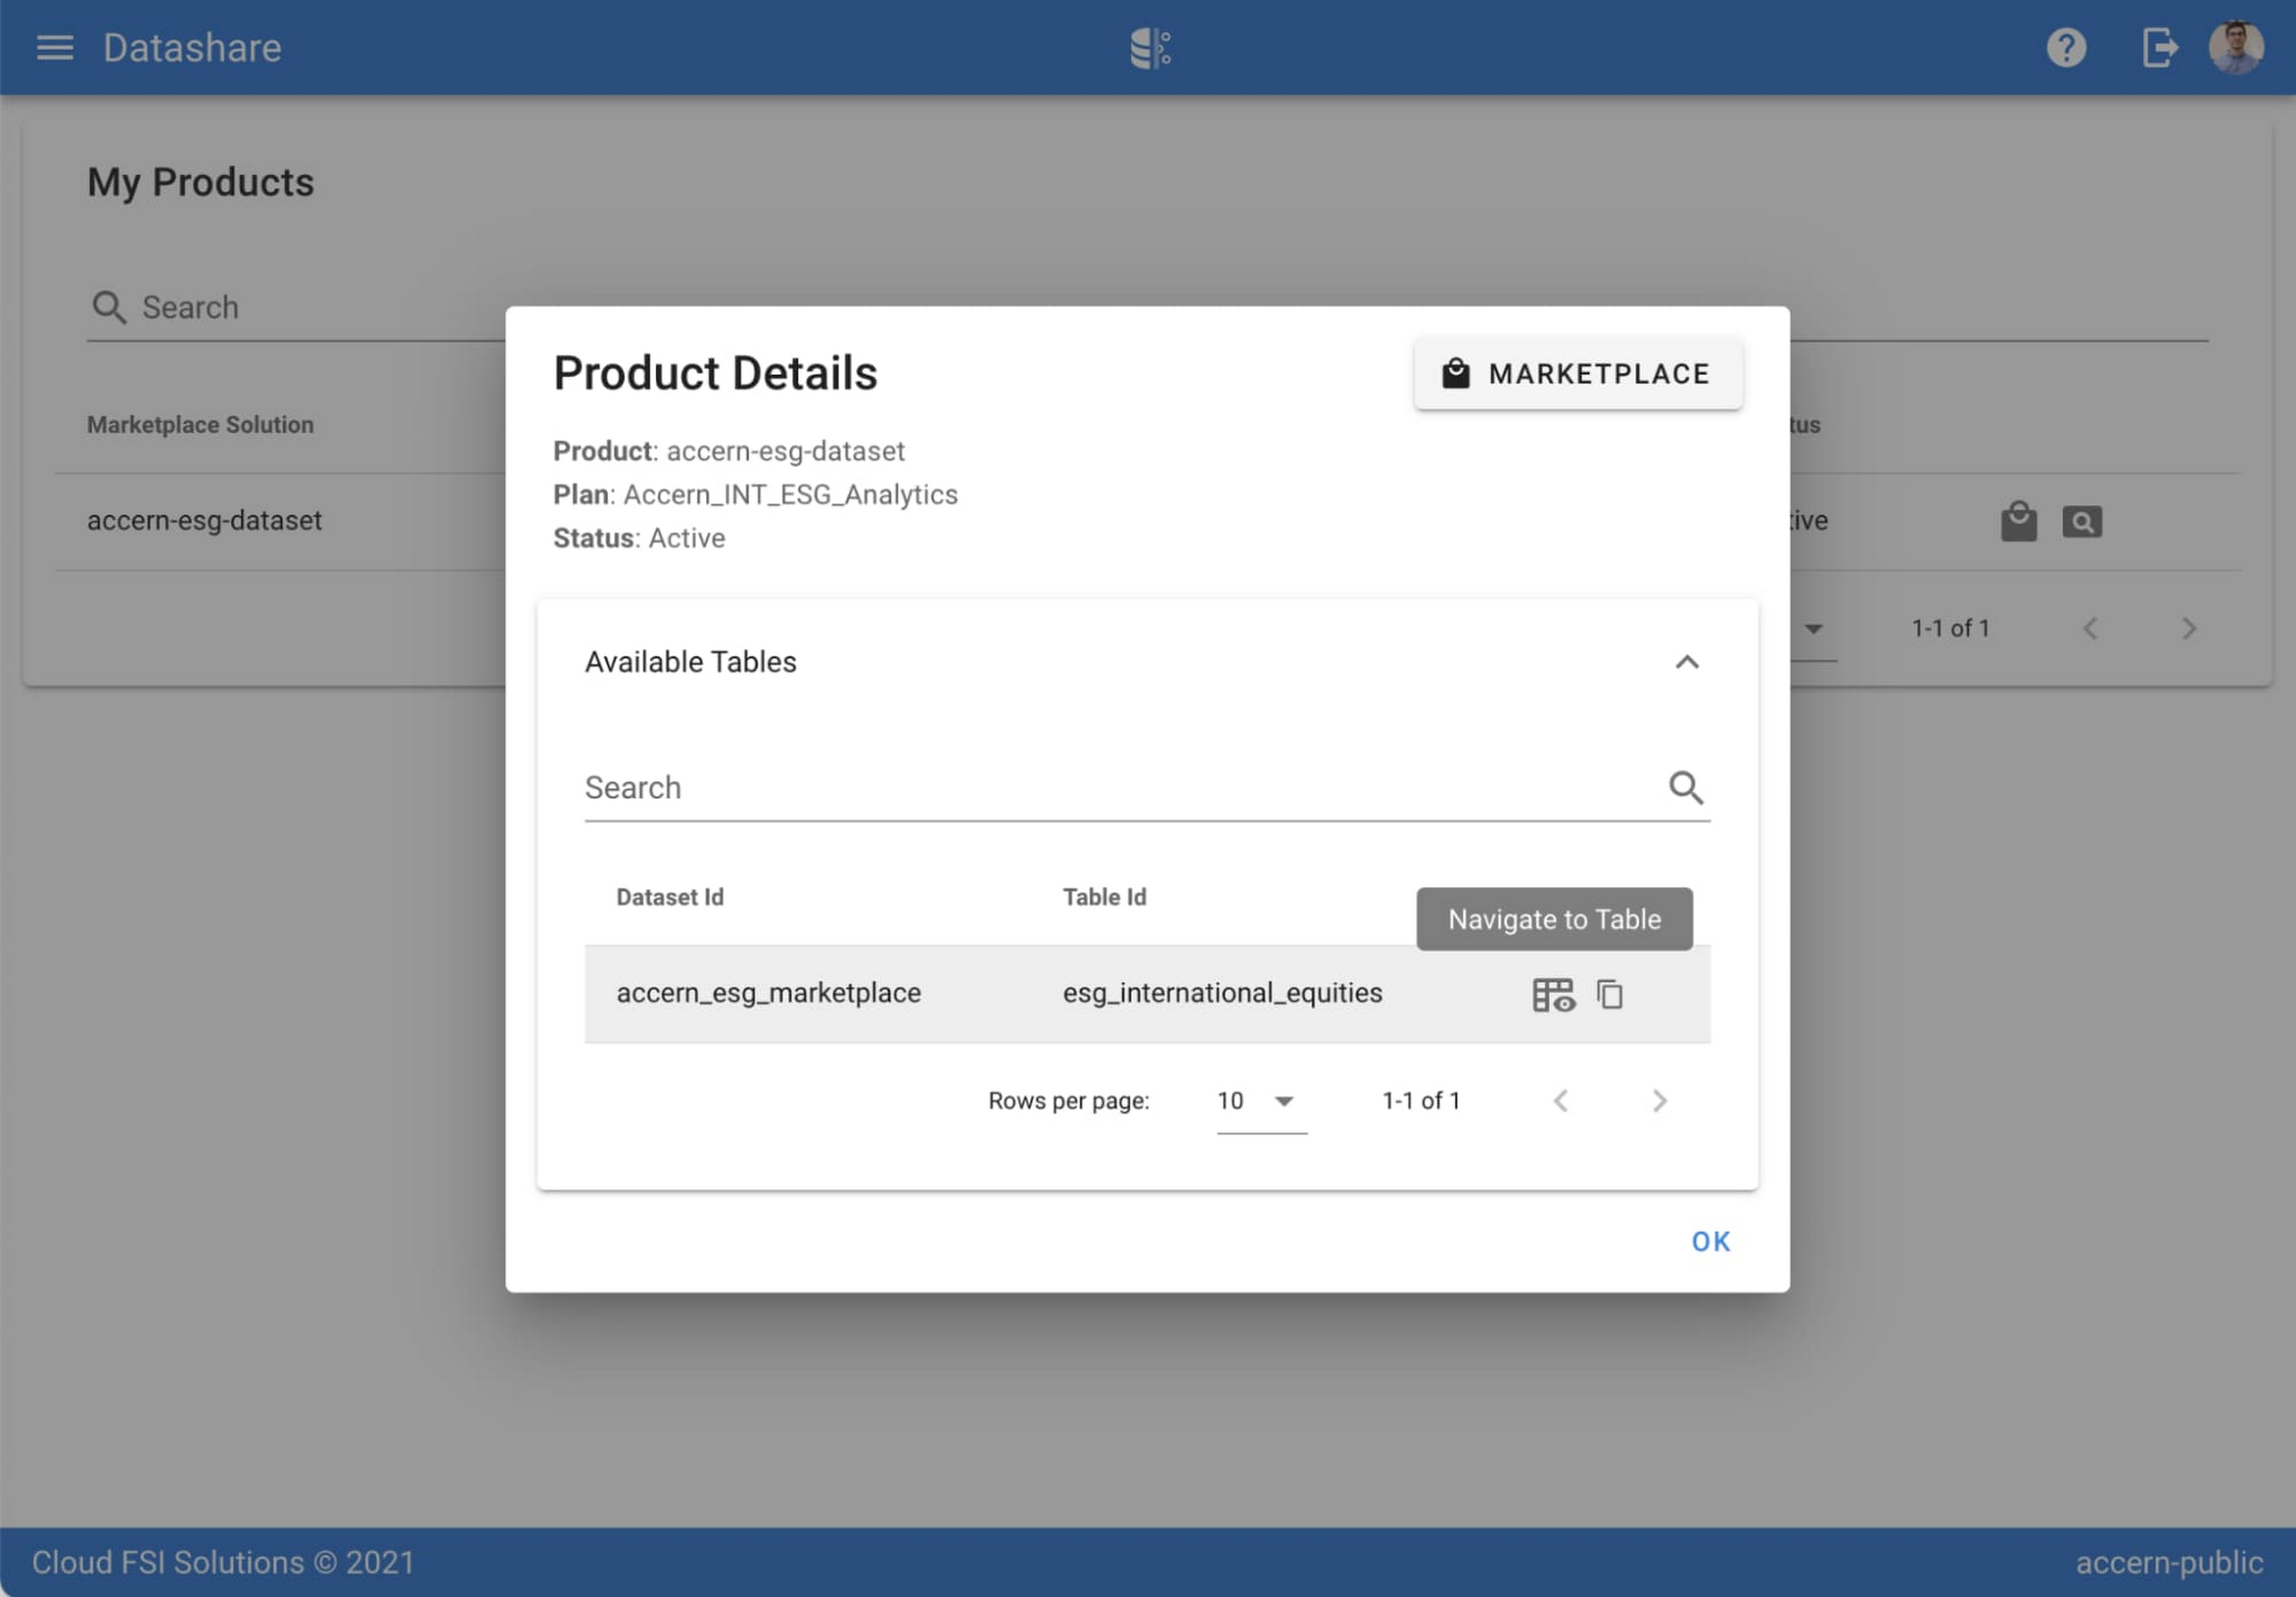

Step 4. Now that you have access and are in the BigQuery console, it’s time to generate data insights.
For this example, we’ve eliminated the company identifying information that is included as part of the subscription and aggregated company ESG in a view where each row represents a day, an industry sector, a specific identified ‘ESG Issues’ (event_group and event) and the respective ‘ESG Sentiment’ per issue.

For example, row 1 indicates that within the ‘Healthcare’ sector, there was a ‘Social – Civil Society’ issue identified and it had a negative ESG sentiment score of -15.35.
Step 5. Generate a report by exporting it to Data Studio to build visualizations and conduct additional analysis on the ESG data.
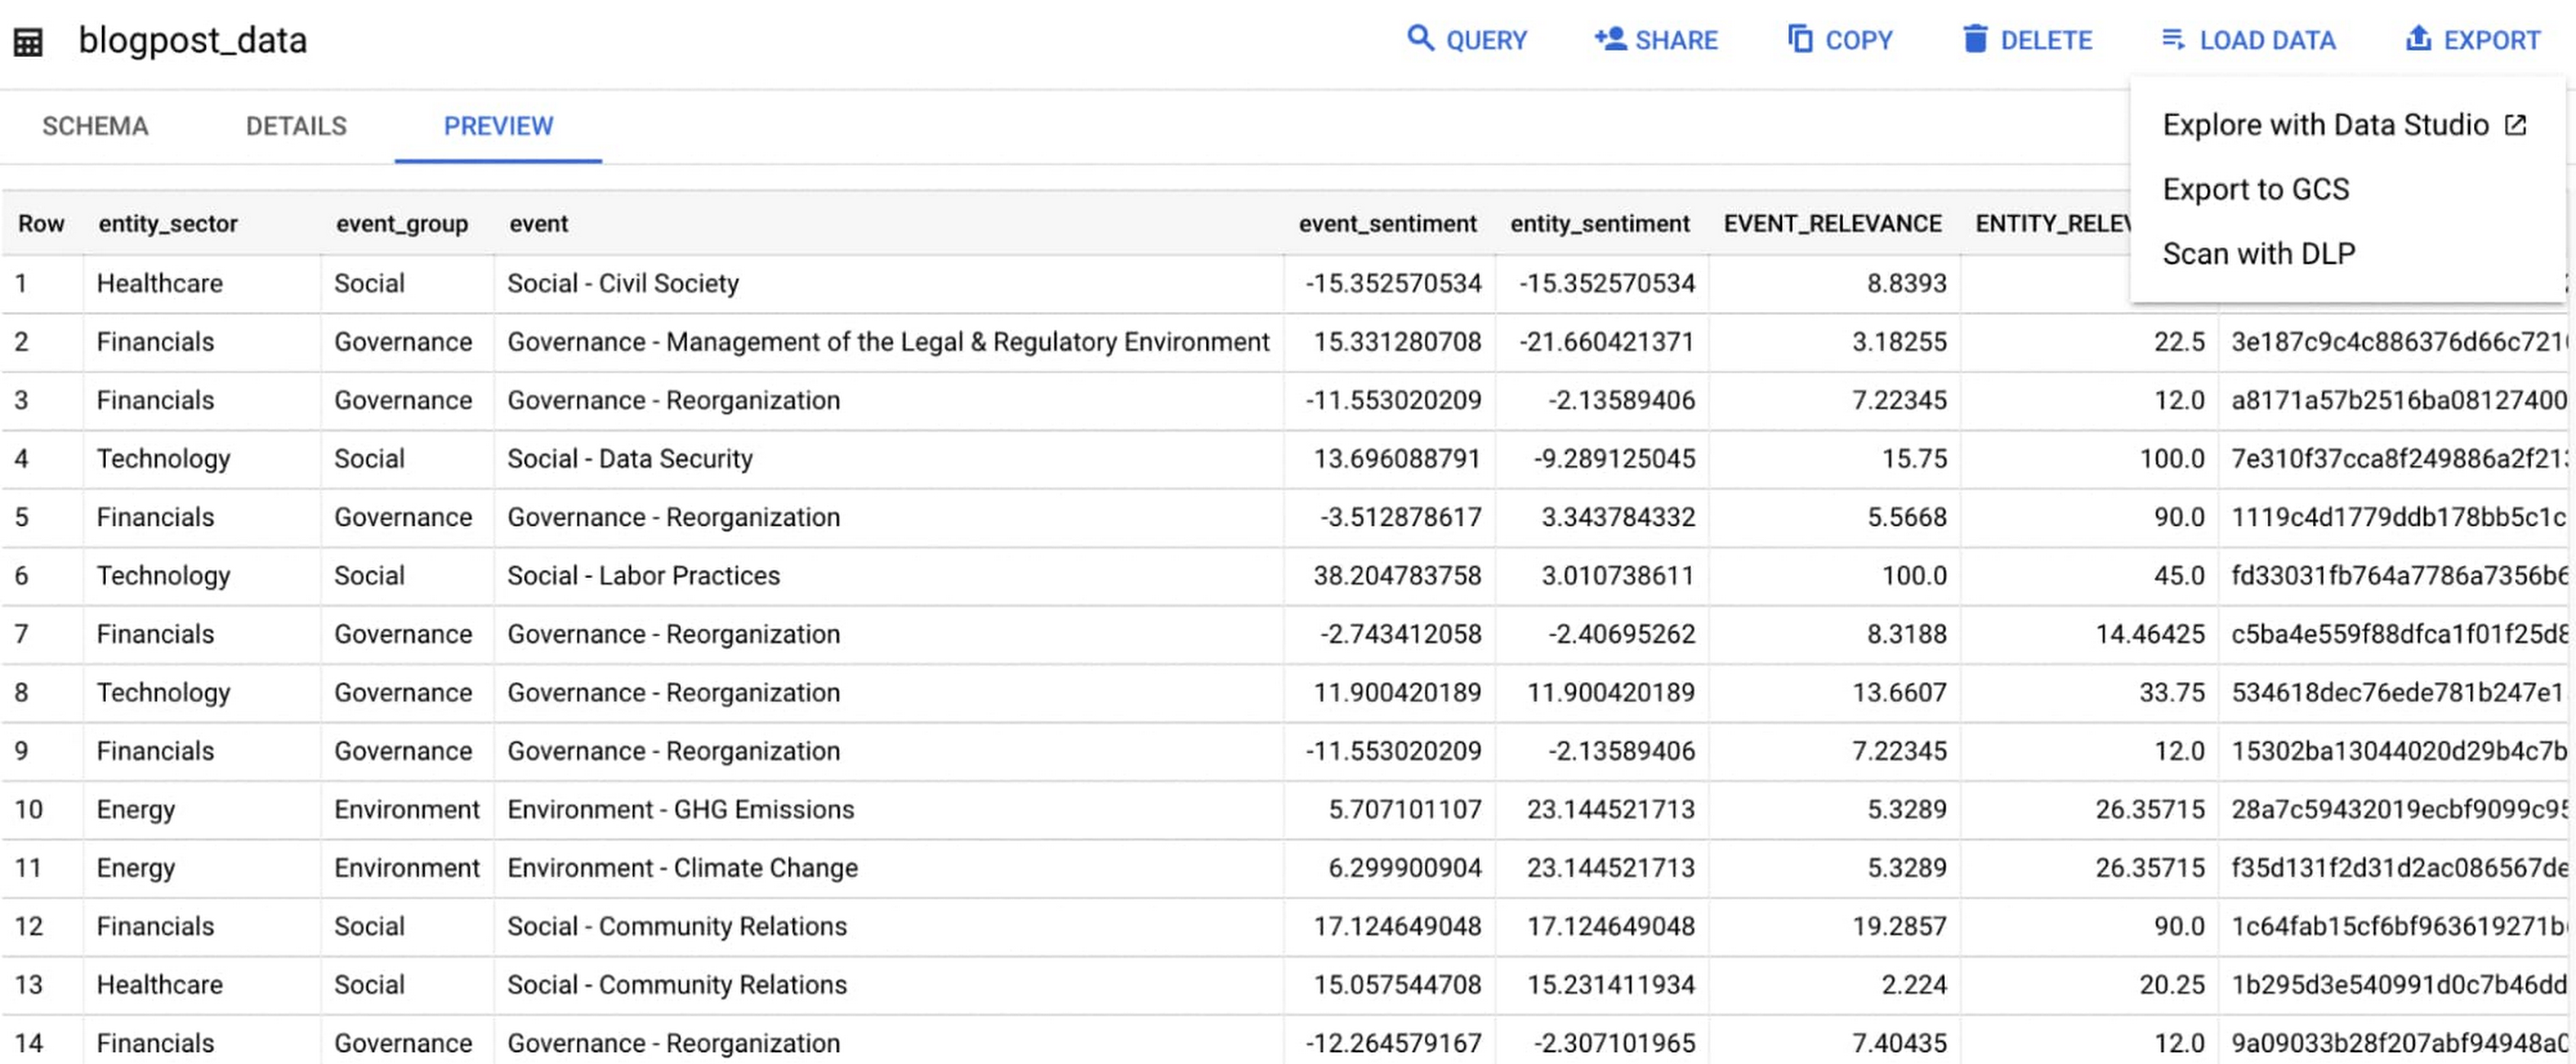
Select ‘Export’ and ‘Explore with Data Studio’.
Step 6. Build a simple/basic report.
Now that the ESG data appears in Data Studio, you can start by building a simple chart to help you understand which industry sectors have the highest volume of discussions around ESG and the overall ESG Sentiment per industry sector.
To build the chart:
- Select the chart type ‘Table’.
- Include
Entity_Sectoras your dimension to aggregate results by ‘Industry Sector.’ - Include
Signal_IDas a measure to count the number of ESG passages identified per ‘Industry Sector.’ - Include
AVG(Event_Sentiment)as a measure to display the overall ESG Sentiment per ‘Industry Sector’ across ESG Issues.

You can see sectors that are most discussed when it comes to ESG related topics and their corresponding ‘ESG Sentiment’ scores.
Step 7. Build your final report in Data Studio.
As a next step you can further drill into the data to understand ESG data specific to each ‘Industry Sector’ and identify positive and negative ESG practices.
Accern has built a more complex sample dashboard and made it available publicly here. You can interact with this report and play around with the data. The dashboard can help to identify material ESG insights for each sector to inform your investment and risk processes. If you have additional questions, you can reach out to Accern directly.

Discovering, accessing and analyzing licensed datasets is quick and easy. Stay tuned for more updates on new licensed datasets.
Publishing your data via Datashare
If you are a publisher of market data, alternative, or exotic data, you can use Datashare to get it published on Google Cloud Marketplace.
Start by joining the Partner Advantage program by registering for the Partner Advantage Portal and applying for the Partner Advantage Build Model engagement. Visit our getting started guide for information to get started on publishing licensed datasets in the Marketplace. Stay tuned for a future blog post about using Datashare to publish datasets in the Marketplace.
More solutions for capital markets
Check out other Google Cloud solutions for capital markets.
The Power of Personalization: Ocado Retail’s Strategy to Boost Revenue and Lower Churn

1724
Of your peers have already read this article.
3:30 Minutes
The most insightful time you'll spend today!
Retailers are becoming more skilled at making individual customers feel heard and valued. This is a necessity given the fact that 66% of respondents to a McKinsey survey stated that they expect email marketing messages to be tailored to their needs. While marketing personalization expertise is growing, it’s still difficult to manage, especially at scale.
Ocado Retail, one of the world’s largest dedicated online grocery retailers, delivering to over 645,000 customers in the U.K., has made personalization integral to its success.
Let’s look at how Ocado retail worked with Google Cloud and partner Cognizant to develop a new data platform to power its personalization efforts from the ground up.
Unifying data for more holistic, powerful personalization
To achieve its goals of personalization at scale, Ocado Retail needed a central data warehouse that could turn all forms of merchandising, advertising, business, and customer intelligence data into actionable insights. It wanted a means to accelerate customer segment identification, as well as the ideation and launch of relevant campaigns.
“We standardized on Google Cloud, including BigQuery, as the foundation for our data platform because we knew it was the right solution for now and the future,” says Kieren Johnson, Head of IT at Ocado Retail. “We have an incredibly lean team and we needed a partner with exceptional expertise to help build an ambitious enterprise data warehouse to provide powerful insights. Cognizant was also the clear choice to help us get there.”
Cognizant worked closely with Ocado Retail to make sure its expertise in Google Cloud and other technologies aligned with Ocado Retail’s vision to drive more advanced personalization at higher scales using machine learning. The partner helped build the foundation on BigQuery, and then incorporated other Google Cloud tools such as Cloud Run, Vertex AI, and Vertex AI Natural Language to provide no-ops, all-code warehousing, and analytics capabilities.
Cognizant also took advantage of the Google Cloud Partner Success Services (PSS) program to ensure best practices were being followed throughout the project. PSS provided advisory services that guided Cognizant through the highly complex process of building the new data warehouse for Ocado Retail on Google Cloud.
Building the enterprise data platform in this way allows Ocado Retail to leverage the full power of cloud-based analytics while maintaining a lean team. It also allows the company to greatly scale up its personalization efforts.
Making customers feel valued at every touch
The work Ocado Retail has done with Google Cloud and Cognizant has positioned it to make its growing customer base feel valued, understood, and supported in every interaction. Before launching the project with Cognizant and Google Cloud, Ocado Retail was only able to run a couple of campaigns per week and knew it lacked optimal insight into each campaign’s efficacy.
“We now run 10 times the number of campaigns we used to with the help of the data platform Cognizant built on Google Cloud,” says Kieren. “We run multiple campaigns every day for different customer segments, and all of that increased activity is entirely driven by data insights. The positive impacts on our marketing and customer service performance have been clear. We’re now working to expand what we do.”
Ocado Retail has enjoyed solid growth since the new data platform went live, including a 13% rise in active customers during fiscal year 2022, and has also seen a reduction in churn. It attributed these improvements to being better able to tailor products and communications to specific customer preferences.
Throughout the project, Cognizant supported data clean up while maximizing the scalable, flexible, and future-proofed data analytics infrastructure offered by Google Cloud.
Increasing data-driven actions
Ocado Retail plans to provide more data-driven insights to its commercial suppliers through a product called Beet Insights. So far, Beet Insights offers suppliers with intelligence about how their products are performing on the shelves. The result has been improving the role data plays throughout the supply chain, from production to purchase and beyond.
“By putting real-time insights about costs, marketing spend, and supply-funded activities into the hands of our commercial team and buyers, we are better positioned to improve our profits,” says Kieren. “At the same time, building data analytics into every part of our business will allow us to build on our personalization efforts.”
From the project’s inception, Ocado Retail ensured that the platform would be scalable and dynamic. Now, it is working to feed more data sources and streams into the warehouse to accelerate time to insights. Ocado Retail believes this next step in the evolution of the platform will unlock even more opportunities to initiate high-impact programs that transform personalization and every customer interaction.
Learn more about what Google Cloud and partners like Cognizant can do for your customer intelligence and personalization.
3791
Of your peers have already watched this video.
24:30 Minutes
The most insightful time you'll spend today!
Replacing Oracle with Cloud Spanner: What Optiva Learnt
Optiva is a Canada-based provider of business support system (BSS) and Operations Support Systems (OSS) software and services to the telecommunications vertical.
Optiva sought to improve its product offering. In the way were very tough challenges including a need for accuracy, the need to deal with very high volumes, the need for low latency.
So they looked at the market. And just by chance, they saw a Cloud Spanner press release.” And so we were looking. We were like: what can we do? How can we make this 10 times faster. And we read the Spanner press release, and we’re like: are you kidding me? This is our dream come true. We have a perfect database that can handle the transactional volume. It’s distributed, it’s consistent, multiple writings, like synchronized writing across 1,000 servers. It’s exactly what we needed to replace big bad Oracle,” says Danielle Roystone, CEO of Optiva.
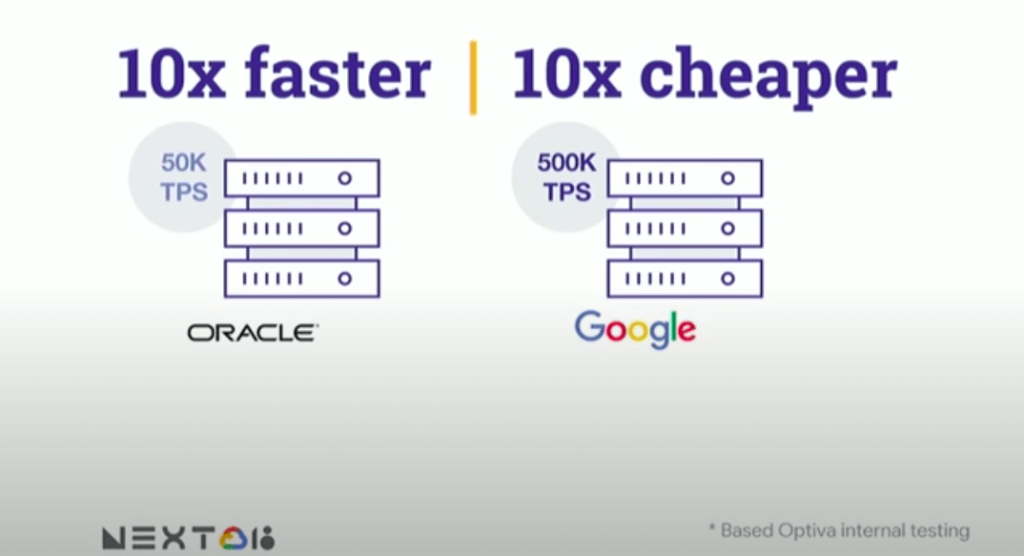
To hear the entire story, watch the video!
Using Google Cloud’s Backup and DR Service with Logging and Monitoring Tools

1105
Of your peers have already read this article.
2:30 Minutes
The most insightful time you'll spend today!
Backup and DR data is a valuable business asset, and ensuring that it’s safe and accessible is essential. In particular, you want to be able to monitor your backups to ensure that the data is indeed protected and that you can quickly recover it in the event of a disaster, user error, or failed upgrade.
Users of Google Cloud’s Backup and DR service often ask:
- What are the best practices for monitoring my backup and recovery jobs?
- How can I proactively identify issues and troubleshoot?
- How can I create alerts and be notified about important events?
The good news is that Google Cloud Backup and DR now integrates with Cloud Logging and Cloud Monitoring tools. Now, you can monitor backup events, jobs, appliance health, resource consumption and user actions in the same way you monitor other Google Cloud workloads and services.
With this integration, you can now:
- Monitor events related to backup and restore – With detailed Google Cloud Backup and DR service event logs in Cloud Logging, you can now use log based alerts to create a customisable notification, in near-real time. This lets you monitor important events such as backup job failures, jobs that did not run, local backup storage saturation, and network failures.
- Configure fine grained alerting – You can write custom event queries on a wide variety of dimensions such as event severity, application type, application name, job type, job name, error message and many more. This gives a lot of flexibility to define alerts for specific events or conditions within a system, thus reducing noise and helping you identify and fix issues easily.
- Get notified on your preferred notification channel – Google Cloud offers seven pre-built notification channels that let you receive customisable notifications directly over email, SMS, Slack or the Google Cloud mobile app. Alternatively, you can integrate with your own monitoring and event management tools using webhooks or Pub/Sub.
- Derive useful insights to troubleshoot issues – With Log Analytics, you can use BigQuery to query your data using SQL queries and generate operational insights, which can help you reduce time spent troubleshooting. For example, you can analyze the key reasons that backup and restore jobs fail for a given application or application type.
The integration also lets you proactively discover deeper issues related to backup and recovery, such as capacity-related issues or certain job failures that happen periodically, by monitoring recurring events in the logs over time. With log-based metrics, you can:
- Create trend charts to track important metrics such as the number of backup or restore jobs that failed during a day/week/month
- Receive a notification when the number of occurrences crosses a threshold, for example receive a notification if a snapshot pool saturates more than five times a week
- Monitor trends in data, such as latency values in logs, and receive a notification if the values change in an unacceptable way.
Getting started
The time to learn that your backup failed should never be when you go to restore. By integrating our Backup and DR service with Cloud Monitoring and Cloud Logging, you can get valuable assurances about the health of your backup and business continuity processes with the same tools that you use to manage other Google Cloud workloads. To get started, check out the Backup and DR event logs page. You can also watch a video that shows you how to set up and use the service and configure some custom alerts.
More Relevant Stories for Your Company

Four Key Takeaways from Google and Quantum Metric’s Back-to-School Retail Benchmark Study
Is it September yet? Hardly! School is barely out for the summer. But according to Google and Quantum Metric research, the back-to-school and off-to-college shopping season – which in the U.S. is second only to the holidays in terms of purchasing volume1 – has already begun. For retailers, that means

Quantum Metric Increases Business 10-fold
At Quantum Metric, we’re in the business of bringing our customers business insights that are based on customer experience data and analytics for mid-market and Fortune 500 companies. Our software, powered by big data, machine intelligence, and Google Cloud, helps our customers identify, quantify, prioritize and measure opportunities to improve
Migrating Hadoop to Dataproc by LiveRamp: Best Practices
Abstract In this blog, we describe our journey to the cloud and share some lessons we learned along the way. Our hope is that you’ll find this information helpful as you go through the decision, execution, and completion of your own migration to the cloud. Introduction LiveRamp is a data

Harnessing the Power of Data and AI to Transform Life Science Supply Chains
Global life science supply chains are lengthy and complex with many moving parts. One small disruption can create serious delays and affect your ability to deliver therapeutics for patients. Supply chain disruptors Over the last few years, healthcare organizations have encountered a range of obstacles, from both internal and external
