





How to Pick a Database that is Suitable for Your Application

7026
Of your peers have already read this article.
2:30 Minutes
The most insightful time you'll spend today!
Picking the right database for your application is not easy. The choice depends heavily on your use case—transactional processing, analytical processing, in-memory database, and so on—but it also depends on other factors. This post covers the different database options available within Google Cloud across relational (SQL) and non-relational (NoSQL) databases and explains which use cases are best suited for each database option.

Relational databases
In relational databases information is stored in tables, rows and columns, which typically works best for structured data. As a result they are used for applications in which the structure of the data does not change often. SQL (Structured Query Language) is used when interacting with most relational databases. They offer ACID consistency mode for the data, which means:
- Atomic: All operations in a transaction succeed or the operation is rolled back.
- Consistent: On the completion of a transaction, the database is structurally sound.
- Isolated: Transactions do not contend with one another. Contentious access to data is moderated by the database so that transactions appear to run sequentially.
- Durable: The results of applying a transaction are permanent, even in the presence of failures.
Because of these properties, relational databases are used in applications that require high accuracy and for transactional queries such as financial and retail transactions. For example: In banking when a customer makes a funds transfer request, you want to make sure the transaction is possible and it actually happens on the most up-to-date account balance, in this case an error or resubmit request is likely fine.
There are three relational database options in Google Cloud: Cloud SQL, Cloud Spanner, and Bare Metal Solution.
Cloud SQL: Provides managed MySQL, PostgreSQL and SQL Server databases on Google Cloud. It reduces maintenance cost and automates database provisioning, storage capacity management, back ups, and out-of-the-box high availability and disaster recovery/failover. For these reasons it is best for general-purpose web frameworks, CRM, ERP, SaaS and e-commerce applications.
Cloud Spanner: Cloud Spanner is an enterprise-grade, globally-distributed, and strongly-consistent database that offers up to 99.999% availability, built specifically to combine the benefits of relational database structure with non-relational horizontal scale. It is a unique database that combines ACID transactions, SQL queries, and relational structure with the scalability that you typically associate with non-relational or NoSQL databases. As a result, Spanner is best used for applications such as gaming, payment solutions, global financial ledgers, retail banking and inventory management that require ability to scale limitlessly with strong-consistency and high-availability.
Bare Metal Solution: Provides hardware to run specialized workloads with low latency on Google Cloud. This is specifically useful if there is an Oracle database that you want to lift and shift into Google Cloud. This enables data center retirements and paves a path to modernize legacy applications.
Non-relational databases
Non-relational databases (or NoSQL databases) store compex, unstructured data in a non-tabular form such as documents. Non-relational databases are often used when large quantities of complex and diverse data need to be organized. Unlike relational databases, they perform faster because a query doesn’t have to access several tables to deliver an answer, making them ideal for storing data that may change frequently or for applications that handle many different kinds of data.
For example, an apparel store might have a database in which shirts have their own document containing all of their information, including size, brand, and color with room for adding more parameters later such as sleeve size, collars, and so on.
Qualities that make NoSQL databases fast:
- Eventual consistency: stores usually exhibit consistency at some later point (e.g., lazily at read time)
- Horizontal scaling, usually using hashed distributions
- Typically, they are optimized for a specific workload pattern (i.e., key-value, graph, wide-column)
- Typically, they don’t support cross shard transactions or flexible isolation modes.
Because of these properties, non-relational databases are used in applications that require large scale, reliability, availability, and frequent data changes.They can easily scale horizontally by adding more servers, unlike some relational databases, which scale vertically by increasing the machine size as the data grows. Although, some relations databases such as Cloud Spanner support scale-out and strict consistency.
Non-relational databases can store a variety of unstructured data such as documents, key-value, graphs, wide columns, and more. Here are your non-relational database options in Google Cloud:
- Document databases: Store information as documents (in formats such as JSON and XML). For example: Firestore
- Key-value stores: Group associated data in collections with records that are identified with unique keys for easy retrieval. Key-value stores have just enough structure to mirror the value of relational databases while still preserving the benefits of NoSQL. For example: Datastore, Bigtable, Memorystore
- In-memory database: Purpose-built database that relies primarily on memory for data storage. These are designed to attain minimal response time by eliminating the need to access disks. They are ideal for applications that require microsecond response times and can have large spikes in traffic. For example: Memorystore
- Wide-column databases: Use the tabular format but allow a wide variance in how data is named and formatted in each row, even in the same table. They have some basic structure while preserving a lot of flexibility. For example: Bigtable
- Graph databases: Use graph structures to define the relationships between stored data points; useful for identifying patterns in unstructured and semi-structured information. For example: JanusGraph
There are three non-relational databases in Google Cloud:
- Firestore: Is a serverless document database which scales on demand and acts as a backend-as-a-service. It is DBaaS that increases the speed of building applications. It is perfect for all general purpose uses cases such as ecommerce, gaming, IoT and real time dashboards. With Firestore users can interact with and collaborate on live and offline data making it great for real-time application and mobile apps.
- Cloud Bigtable: Cloud Bigtable is a sparsely populated table that can scale to billions of rows and thousands of columns, enabling you to store terabytes or even petabytes of data. It is ideal for storing very large amounts of single-keyed data with very low latency. It supports high read and write throughput at sub-millisecond latency, and it is an ideal data source for MapReduce operations. It also supports the open-source HBase API standard to easily integrate with the Apache ecosystem including HBase, Beam, Hadoop and Spark along with Google Cloud ecosystem.
- Memorystore: Memorystore is a fully managed in-memory data store service for Redis and Memcached at Google Cloud. It is best for in-memory and transient data stores and automates the complex tasks of provisioning, replication, failover, and patching so you can spend more time coding. Because it offers extremely low latency and high performance, Memorystore is great for web and mobile, gaming, leaderboard, social, chat, and news feed applications.
Conclusion
Choosing a relational or a non-relational database largely depends on the use case. Broadly, if your application requires ACID transactions and your data structure is not going to change much, select a relational database.
In Google Cloud use Cloud SQL for any general-purpose SQL database and Cloud Spanner for large-scale globally scalable, strongly consistent use cases. In general, if your data structure may change later and if scale and availability is a bigger requirement than consistency then a non-relational database is a preferable choice. Google Cloud offers Firestore, Memorystore, and Cloud Bigtable to support a variety of use cases across the document, key-value, and wide column database spectrum.
For more comparison resources on each database check out the overview. For more hands-on experience with Bigtable, check out our on-demand training here and learn about migrating databases to managed services check out this whitepaper.
https://youtube.com/watch?v=2TZXSnCTd7E%3Fenablejsapi%3D1%26
For more #GCPSketchnote, follow the GitHub repo. For similar cloud content follow me on Twitter @pvergadia and keep an eye out on thecloudgirl.dev.
Cloud Databases: An Essential Building Block for Transforming Customer Experiences
DOWNLOAD RESEARCH REPORTS2760
Of your peers have already downloaded this article
11:30 Minutes
The most insightful time you'll spend today!
Around the globe, companies realize that iterating and innovating the customer experience (CX) is the key to their business transformation and success goals. Customers expect exceptional and speedy service from organizations through personalized experiences and easy-to-use apps.
However, while most companies want data-driven innovation, many of them overlook a key mechanism to do so: operational databases. These databases run a company’s day-to-day operations and power applications around the globe.
“Operational databases are often overlooked because they are behind the scenes,” says Kumar Menon, senior vice president of data fabric and decision science technology at Atlanta-based Equifax, the multinational consumer credit reporting agency. “Companies often focus on providing strong customer-facing applications, but the application will only achieve the desired results with a well-architected operational data capability that helps drive the real-time analytics needed to make the customer experience effective and memorable. It is the backbone of anything that you will build on top of it.”
Better customer experience is a business outcome of using cloud databases to build applications. This dictum stands to reason because moving from a traditional on-premises database to a modern database in the cloud, or simply building new applications in the cloud, allows companies to address operational overhead, unlock new possibilities, implement new features quickly, increase application reliability, and serve users across more regions—all the things that enhance CX and make it possible. Google Cloud sponsored this research by Harvard Business Review Analytic Services to understand how digital innovators are delighting their customers by using modern cloud databases. The report analyzes why operational databases are an essential building block for transformative experiences and highlights some of the critical capabilities leaders should prioritize. Through interviews with technology executives, data leaders, and industry experts, it provides real-world examples of benefits companies are realizing with cloud databases. We hope you find the findings and real-world examples in this report insightful and inspiring.
Make Meaningful Analysis with Geo Boundary Public Datasets on BigQuery

6336
Of your peers have already read this article.
4:00 Minutes
The most insightful time you'll spend today!
Geospatial data is a critical component for a comprehensive analytics strategy. Whether you are trying to visualize data using geospatial parameters or do deeper analysis or modeling on customer distribution or proximity, most organizations have some type of geospatial data they would like to use – whether it be customer zipcodes, store locations, or shipping addresses. However, converting geographic data into the correct format for analysis and aggregation at different levels can be difficult. In this post, we’ll walk through some examples of how you can leverage the Google Cloud platform alongside Google Cloud Public Datasets to perform robust analytics on geographic data. The full queries can be accessed from this notebook here.
Public US Geo Boundaries dataset
BigQuery hosts a slew of public datasets for you to access and integrate into your analytics. Google pays for the storage of these datasets and provides public access to the data via the bigquery-public-data project. You only pay for queries against the data. Plus, the first 1 TB per month is free! These public datasets are valuable on their own, but when joined against your own data they can unlock new analytics use cases and save the team a lot of time.
Within the Google Cloud Public Datasets Program there are several geographic datasets. Here, we’ll work with the geo_us_boundaries dataset, which contains a set of tables that have the boundaries of different geospatial areas as polygons and coordinates based on the center point (GEOGRAPHY column type in BigQuery), published by the US Census Bureau.

Mapping geospatial points to hierarchical areas
Many times you will find yourself in situations where you have a string representing an address. However, most tools require lat/long coordinates to actually plot points. Using the Google Maps Geocoding API we can convert an address into a lat/long and then store the results in the BigQuery table.
With a lat/long representation of our point, we can join our initial dataset back onto any of the tables here using the ST_WITHIN function. This allows us to check and see if a point is within the specified polygon.
ST_WITHIN(geography_1, geography_2)
This can be helpful for ensuring standard nomenclature; for example, metropolitan areas that might be named differently. The query below maps each customers’ address to a given metropolitan area name.
SELECTcust.id as customer_id,metro.name as metro_nameFROM `looker-private-demo.retail.customers` as cust,`bigquery-public-data.geo_us_boundaries.metropolitan_divisions` as metroWHERE ST_WITHIN(ST_GEOGPOINT(cust.longitude, cust.latitude),metro.metdiv_geom)
It can also be useful for converting to designated market area (DMA), which is often used in creating targeted digital marketing campaigns.
SELECTcust.id as customer_id,dma.dma_nameFROM `looker-private-demo.retail.customers` as cust,`bigquery-public-data.geo_us_boundaries.designated_market_area` as dmaWHERE ST_WITHIN(ST_GEOGPOINT(cust.longitude, cust.latitude),dma.dma_geom)
Or for filling in missing information; for example, some addresses may be missing zip code which results in incorrect calculations when aggregating up to the zipcode level. By joining onto the zip_codes table we can ensure all coordinates are mapped appropriately and aggregate up from there.
SELECTzip.zip_code,count(distinct cust.id) as unique_customersFROM `looker-private-demo.retail.customers` as cust,`bigquery-public-data.geo_us_boundaries.zip_codes` as zipWHERE ST_WITHIN(ST_GEOGPOINT(cust.longitude, cust.latitude),zip.zip_code_geom)GROUP BY 1
Note that the zip code table isn’t a comprehensive list of all US zip codes, they are zip code tabulation areas (ZCTAs). Details about the differences can be found here. Additionally, the zip code table gives us hierarchical information, which allows us to perform more meaningful analytics. One example is leveraging hierarchical drilling in Looker. I can aggregate my total sales up to the country level, and then drill down to state, city and zipcode to identify where sales are highest. You can also use the BigQuery GeoViz tool to visualize geospatial data!

Aside from simply checking if a point is within an area, we can also use ST_DISTANCE to do something like find the closest city using the centerpoint for the metropolitan area table.
SELECTcust.id as customer_id,ARRAY_AGG(metro.name order by ST_DISTANCE(ST_GEOGPOINT(cust.longitude, cust.latitude),metro.internal_point_geom) asc limit 1)[offset(0)] as metro_nameFROM`looker-private-demo.retail.customers` as cust,`bigquery-public-data.geo_us_boundaries.metropolitan_divisions` as metroGROUP BY cust.id
This concept doesn’t just hold true for points, we can also leverage other GIS functions to see if a geospatial area is contained within areas that are listed in the boundaries datasets. If your data comes into BigQuery as a GeoJSON string, we can convert it to a GEOGRAPHY type using the ST_GEOGFROMGEOJSON function. Once our data is in a GEOGRAPHY type we can do things like check to see what urban area the geo is within – using either ST_WITHIN or ST_INTERSECTS to account for partial coverage. Here, I am using the customer’s zip code to find all metropolitan divisions where the zip code polygon and the metropolitan polygon intersect. I am then selecting the metropolitan area that has the most overlap (or the intersection has the largest area) to be the customer’s metro that we use for reporting.
SELECTcust.id as customer_id,ARRAY_AGG(metro.name order by ST_AREA(ST_INTERSECTION(zip.zip_code_geom,metro.metdiv_geom)) desc limit 1)[offset(0)] as metro_nameFROM`looker-private-demo.retail.customers` as custJOIN `bigquery-public-data.geo_us_boundaries.zip_codes` as zip on cust.zip=zip.zip_code,`bigquery-public-data.geo_us_boundaries.metropolitan_divisions` as metroWHERE ST_INTERSECTS(zip.zip_code_geom,metro.metdiv_geom)GROUP BY cust.id
The same ideas can be applied to the other tables in the dataset including the county, urban areas and National Weather Service forecast regions (which can also be useful if you want to join your datasets onto weather data).
Correcting for data discrepancy
One problem that we may run into when working with geospatial data is that different data sources may have different representations of the same information. For example, you might have one system that records state as a two letter abbreviation and another using the full name. Here, we can use the state table to join the different datasets.
SELECTst.state_name,sum(ab.sales+fn.sales) as total_salesFROM `bigquery-public-data.geo_us_boundaries.states` as stLEFT JOIN abbreviated_table as ab on ab.state = st.stateLEFT JOIN fullname_table as fn on fn.state = st.state_nameWHERE COALESCE(ab.state, fn.state) IS NOT NULLGROUP BY 1
Another example might be using the tables as a source of truth for fuzzy matching. If the address is a manually entered field somewhere in your application, there is a good chance that things will be misspelled. Different representations of the same name may prevent tables from joining with each other or lead to duplicate entries when performing aggregations. Here, I use a simple Soundex algorithm to generate a code for each county name, using helper functions from this blog post. We can see that even though some are misspelled they have the same Soundex code.

Next, we can join back onto our counties table so we make sure to use the correct spelling of the county name. Then, we can simply aggregate our data for more accurate reporting.
SELECTc.county_name,sum(sales) as total_salesFROMtableJOIN `bigquery-public-data.geo_us_boundaries.counties` as con testing.dq_fm_Soundex(table.county) = testing.dq_fm_Soundex(c.county_name)WHERE c.state_fips_code = cast(36 as string)GROUP BY 1
Note that fuzzy matching definitely isn’t perfect and you might need to try different methods or apply certain filters for it to work best depending on the specifics of your data.
The US Geo Boundary datasets allow you to perform meaningful geographic analysis without needing to worry about extracting, transforming or loading additional datasets into BigQuery. These datasets, along with all the other Google Cloud Public Datasets, will be available in the Analytics Hub. Please sign up for the Analytics Hub preview, which is scheduled to be available in the third quarter of 2021, by going to g.co/cloud/analytics-hub.
11220
Of your peers have already watched this video.
1:30 Minutes
The most insightful time you'll spend today!
Indian Retailer Figures Optimizes Hyperlocal Delivery to Increase Customer Experience
Anyone who follows the Indian e-commerce scene knows that one of the largest challenges these companies face is hyperlocal delivery.
That was a problem facing Wellness Forever, a retail chain of pharmacies with 150-plus stores across India.
“Exactly a year ago, we started our journey of hyperlocal deliveries. This optimization was a big time challenge for us to understand how to optimize this,” Palani Subbiah, CTO, Wellness Forever.
The problem in front of Wellness Forever was to identify which customer could can be sold from which store, so that a delivery could be made within 90 minutes.
“We handle a large amount of customer data and we wanted to use insights to help and improve the customer satisfaction index,” says Subbiah.
To do that Wellness Forever leveraged Google Big Query to run massive amount of data to come up with the operational insights. They also used Firebase and Google Maps.
“By 2021, we are going to have about 450 stores. Those stores are going to be not only a physical store, which is a digital store.
Statsig’s Journey to Seamless Data Management with Google BigQuery

1198
Of your peers have already read this article.
3:30 Minutes
The most insightful time you'll spend today!
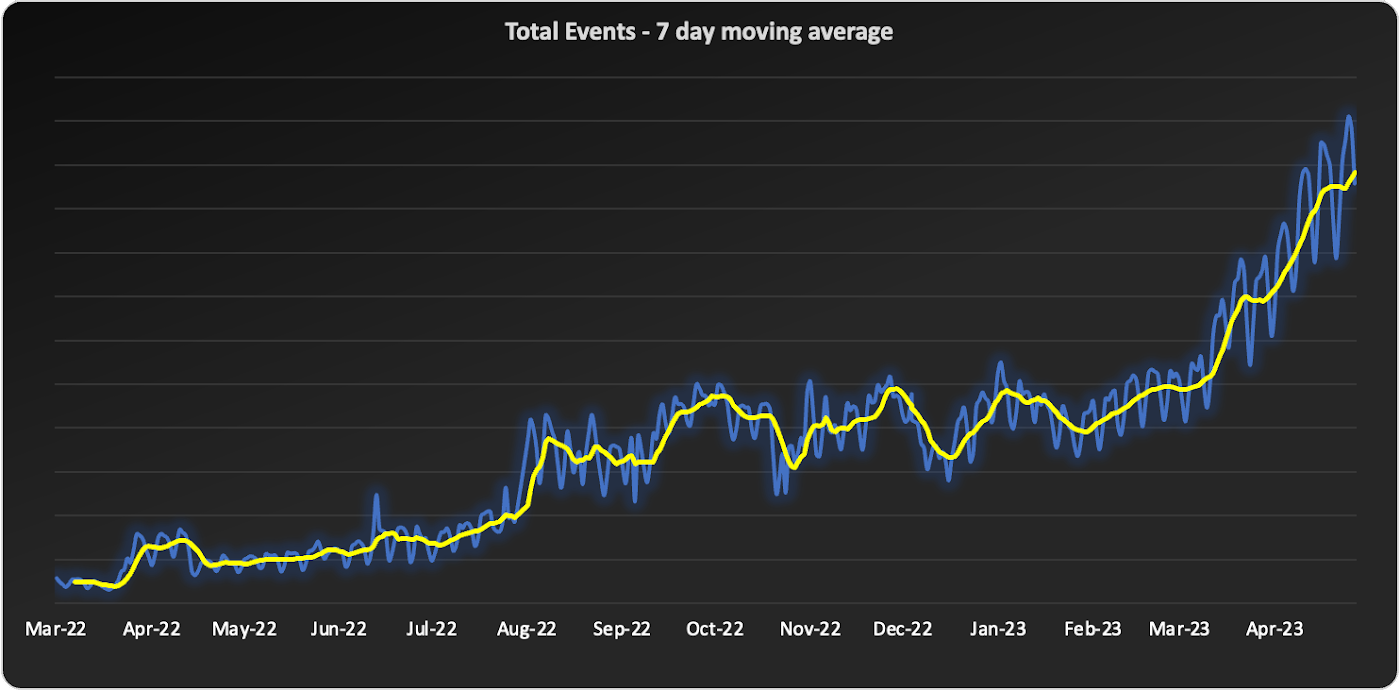
Statsig is a modern feature management and experimentation platform used by hundreds of organizations. Statsig’s end-to-end product analytics platform simplifies and accelerates experimentation with integrated feature gates (flags), custom metrics, real-time analytics tools, and more, enabling data-driven decision-making and confident feature releases. Companies send their real-time event-stream data to Statsig’s data platform, which, on average, adds up to over 30B events a day and has been growing at 30-40% month over month.
With these fast-growing event volumes, our Spark-based data processing regularly ran into performance issues, pipeline bottlenecks, and storage limits. In turn, this rapid data growth negatively impacted the team’s ability to deliver product insights on time. The sustained Spark tuning efforts that we were dealing with made it challenging to keep up with our feature backlog. Instead of spending time building new features for our customers, our engineering team was controlling significant increases in Spark’s runtime and cloud costs.
Adopting BigQuery pulled us out of Spark’s recurring spiral of re-architecture and into a Data Cloud, enabling us to focus on our customers and develop new features to help them run scalable experimentation programs.
The growing data dilemma
At Statsig, our processing volumes were growing rapidly. The assumptions and optimizations we madea month ago would become irrelevant the next month. While our team was knowledgeable in Spark performance tuning, the benefits of each change were short lived and became obsolete almost as quickly as it was implemented. As the months passed, our data teams were dedicating moretime to optimizing and tuning Spark clusters instead of building new data products and features. We knew we needed to change our data cloud strategy.
We started to source advice from companies and startups who had faced similar data scaling challenges – the resounding recommendation was “Go with BigQuery.” Initially, our team was reluctant. For us, a BigQuery migration would require an entirely new data warehouse and a cross-cloud migration to GCP.
However, during a company-wide hackathon, a pair of engineers decided to test BigQuery with our most resource-intensive job. Shockingly, this unoptimized job finished much faster and at a lower cost than our current finely-tuned setup. This outcome made it impossible for us to ignore a BigQuery migration any longer. We set out to learn more.
Investigating BigQuery
When we started our BigQuery journey, the first and obvious thing we had to understand was how to actually run jobs. With Spark, we were accustomed to daunting configurations, mapping concepts like executors back to virtual machines, and creating orchestration pipelines for all the tracking and variations required.
When we approached running jobs on BigQuery, we were surprised to learn that we only needed to configure the number of slots allocated to the project. Suddenly, with BigQuery, there were no longer hundreds of settings affecting query performance. Even before running our first migration test, BigQuery had already eliminated an expensive and tedious task list of optimizations our team would typically need to complete.
Digging into BigQuery, we learned about additional serverless optimizations that BigQuery offered out of the box that addressed many of the issues we had with Spark. For example, we often had a single task get stuck with Spark because virtual machines would be lost or the right VM shape needed to be attainable. With BigQuery’s autoscaling, SQL jobs are much more granularly defined and can move resources as needed between multiple jobs. As another example, we sometimes encountered a storage issue with Spark due to the shuffled data overwhelming a machine’s disk. On BigQuery, there is a separate in-memory shuffle service that eliminates the need for our team to worry about predicting and sizing shuffle disk sizes.
At this point, it was clear that the migration away from the DevOps of Spark and into the serverless BigQuery architecture would be worth the effort.
Spark to BigQuery migration
When migrating our pipelines over, we ran into situations where we had to rewrite large blocks of code, making it easy to introduce new bugs. We needed a way to simultaneously stage this migration without committing to huge rewrites . Dataproc is a very useful tool for this purpose. Dataproc provides us with a simple yet flexible API to spin up Spark clusters and gives us access to the full swath of configurations and optimizations that we’re accustomed to from our previous Spark deployments.
Additionally, BigQuery offers a direct Spark integration through stored procedures with Apache Spark, which provides a fully managed and serverless Spark experience native to BigQuery and allows you to call Spark code directly from BigQuery SQL. It can be configured as part of the BigQuery autoscaler and called from any orchestration tool that can execute SQL, such as dbt.
This ability to mix and match BigQuery SQL and multiple options for Spark gave us the flexibility to move to BigQuery immediately but roll out the entire migration on our timeline.
With BigQuery, we’re back to building features
With BigQuery, we could to tap into performance improvements, direct cost savings, and experienced a reduction in our data pipeline error rates. However, BigQuery really changed our business by unlocking new real-time features that we didn’t have before. A couple of examples are:
1. Fresh, fast data results
On our Spark cluster, we needed to pre-compute tens of thousands of possible results each day if a customer wanted to look at a specific detail. While only a small percentage of results would get viewed each day, we couldn’t predict which results would be needed, so we had to pre-compute it all. With BigQuery, the queries run much faster, so we now compute specific results when customers need them. We benefit from avoiding expensive jobs. To our customers, this translates into fresher data.
2. Real-time decision features
Since our migration to BigQuery began, we have rolled out several new features powered by BigQuery’s ability to compute things in near real-time, enhancing our customers’ ability to make real-time decisions.
1) A metrics explorer that lets our customers query their metric data in real-time.
2) A deep dive experience that lets our customers instantly dig into a specific user’s details instead of waiting on a 15-minute Spark job to process.
3) A warehouse-native solution that lets our customers use their own BigQuery project to run analysis.
Migrating from Spark to BigQuery has simplified many of our workflows and saved us significant money. But equally importantly, it has made it easier to work with massive data, reduced the strain on our perpetually stretched-thin data team, and allowed us to build awesome products faster for our customers.
Getting started with BigQuery
There are a few ways to get started with BigQuery. New customers get $300 in free credits to spend on BigQuery. All customers get 10GB storage and up to 1TB queries free per month, not charged against their credits. You can get these credits by signing up for the BigQuery free trial. Not ready yet? You can use the BigQuery sandbox without a credit card to see how it works.
The Built with BigQuery advantage for ISVs
Google is helping tech companies like Statsig build innovative applications on Google’s data cloud with simplified access to technology, helpful and dedicated engineering support, and joint go-to-market programs through the Built with BigQuery initiative.
More on Statsig
Companies want to understand the impact of their new features on the business, test different options, and identify optimal configurations that balance customer success with business impact. But running these experiments is hard. Simple mistakes can cause you to make wrong decisions, and lack of standardization can make results hard to compare, and reduce user trust. When implemented poorly, an experimentation program can become a bottleneck, causing feature releases to slow down or, in some cases, causing teams to skip experimentation altogether. Statsig provides an end-to-end product experimentation and analytics platform that makes it simple for companies to leverage best-in-class experimentation tooling.
If you’re looking to improve your company’s experimentation process, visit statsig.com and explore what our platform can offer. We have a generous free tier and a community of experts on Slack to help ensure your efforts are successful. Boost your business’s growth with Statsig and unlock the full potential of your data.
Analytics Hub for Secure Data Sharing and Analytics Unlocks True Data Value and Insights

6742
Of your peers have already read this article.
2:30 Minutes
The most insightful time you'll spend today!
Customers tell us that sharing and exchanging data with other organizations is a critical element of their analytics strategy, but it’s hamstrung by unreliable data and processes, and only getting harder with security threats and privacy regulations on the rise.
Furthermore, traditional data sharing techniques use batch data pipelines that are expensive to run, create late arriving data, and can break with any changes to the source data. They also create multiple copies of data, which brings unnecessary costs and can bypass data governance processes. These techniques do not offer features for data monetization, such as managing subscriptions and entitlements. Altogether, these challenges mean that organizations are unable to realize the full potential of transforming their business with shared data.
To address these limitations, we are introducing Analytics Hub, a new fully managed service, available in Q3, in preview, that helps you unlock the value of data sharing, leading to new insights and increased business value. With Analytics Hub you get:
- A rich data ecosystem by publishing and subscribing to analytics-ready datasets.
- Control and monitoring over how your data is being used, because data is shared in one place.
- A self-service way to access valuable and trusted data assets, including data provided by Google. For example, a unique dataset from Google Search Trends will be available, that you can query and combine with your own data.
- An easy way to monetize your data assets without the overhead of building and managing the infrastructure.
Built on a decade of cross-organizational sharing
While Analytics Hub is a new service, it builds on BigQuery, Google’s petabyte-scale, serverless cloud data warehouse. BigQuery’s unique architecture provides separation between compute and storage, enabling data publishers to share data with as many subscribers as you want without having to make multiple copies of your data. With BigQuery, there are no servers to deploy or manage, which means that data consumers get immediate value from shared data. Data can be provided and consumed in real-time using the streaming capabilities of BigQuery and you can leverage the built in machine learning, geospatial, and natural language capabilities of BigQuery or take advantage of the native business intelligence support with tools like Looker, Google Sheets, and Data Studio.
BigQuery has had cross-organizational, in-place data sharing capabilities since it was introduced in 2010. We took a look at usage metrics in BigQuery and found that over a 7 day period in April, we had over 3,000 different organizations sharing over 200 petabytes of data. These numbers don’t include data sharing between departments within the same organization.
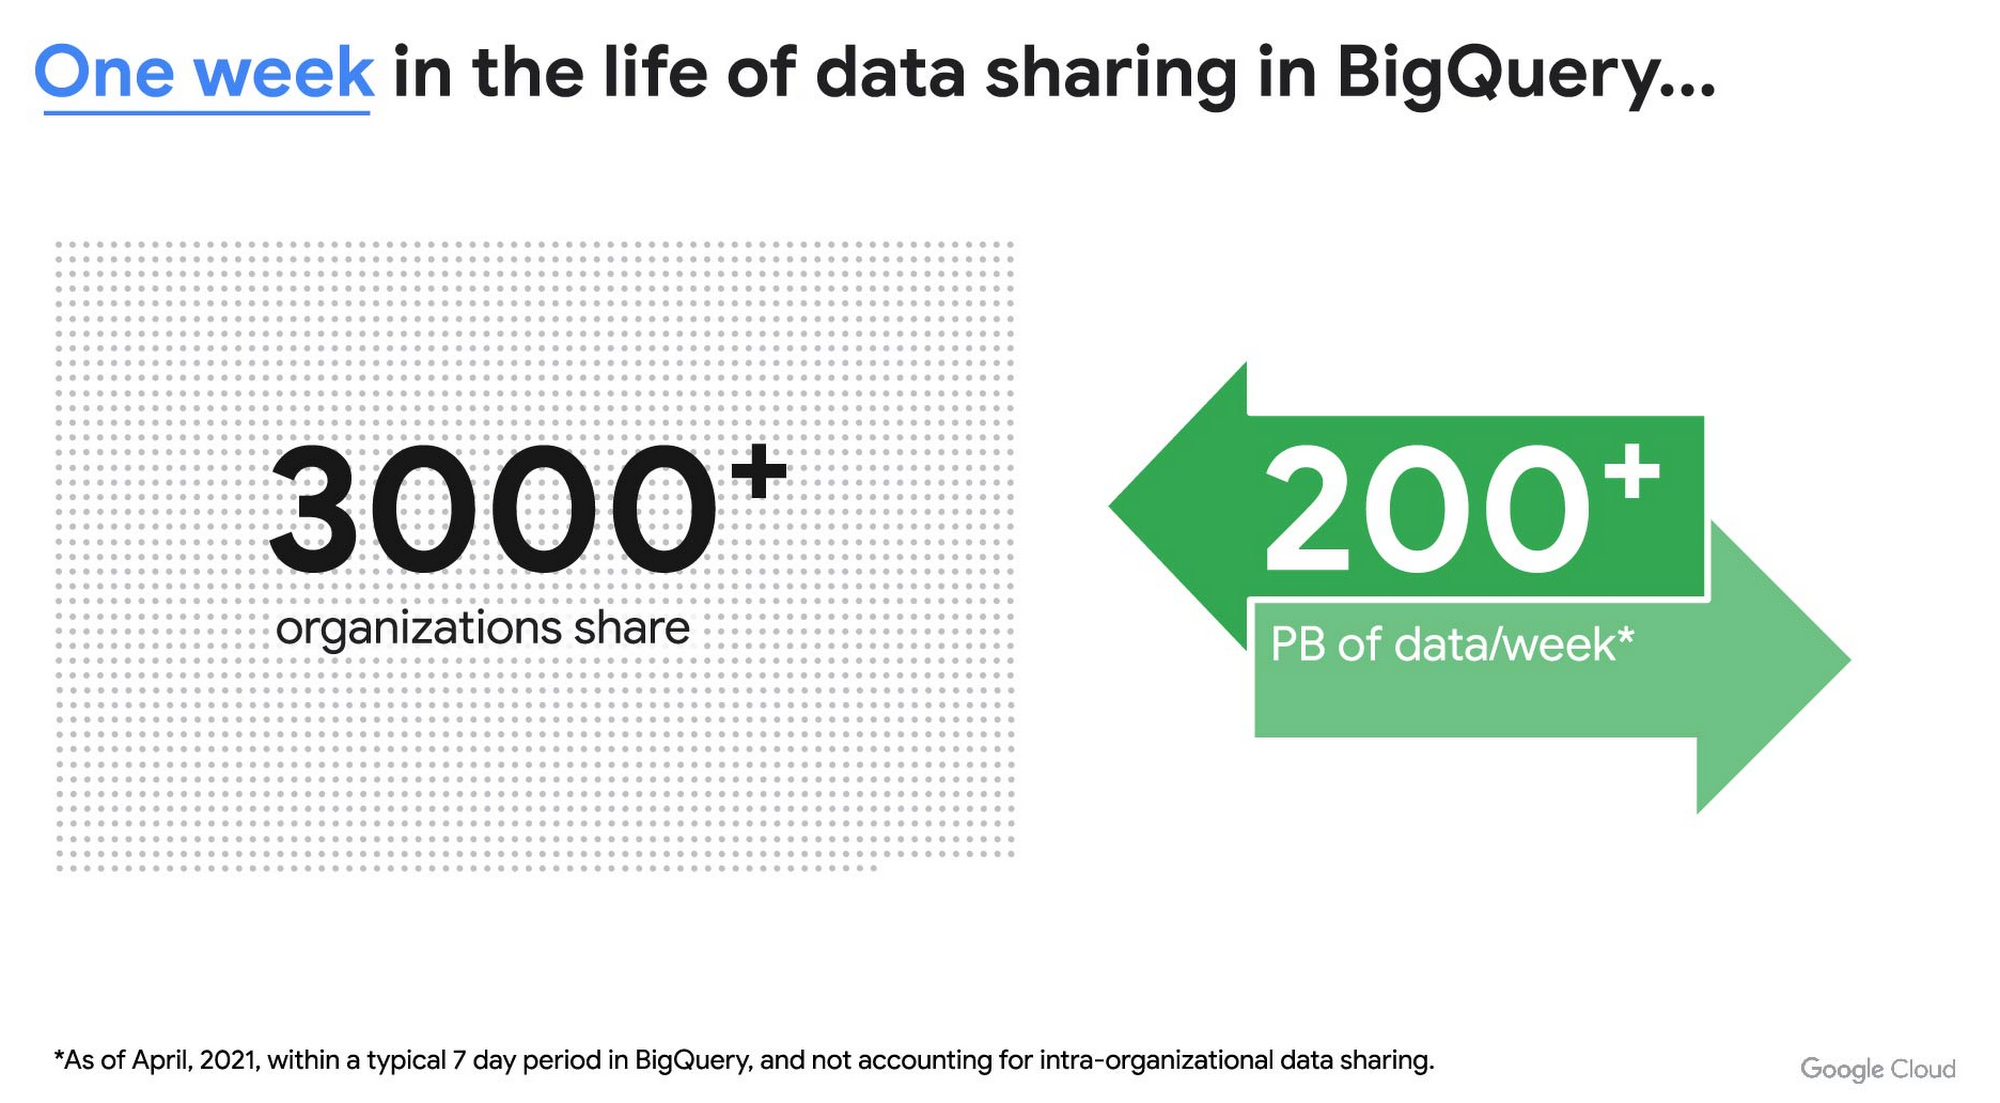
As you can see, data sharing in BigQuery is already popular. But we want to make it easier and even more scalable.
Raising the bar on data sharing
To make data sharing easier and more scalable in BigQuery, Analytics Hub introduces the concepts of shared datasets and exchanges. As a data publisher, you create shared datasets that contain the views of data that you want to deliver to your subscribers. Next, you create exchanges, which are used to organize and secure shared datasets. By default, exchanges are completely private, which means that only the users and groups that you give access to can view or subscribe to the data. You can also create internal exchanges or leverage public exchanges provided by Google. Finally, you publish shared datasets into an exchange to make them available to subscribers.
Data subscribers search through the datasets that are available across all exchanges for which they have access and subscribe to relevant datasets. This creates a linked dataset in their project that they can query and join with their own data. Subscribers pay for the queries that they run against the data while the publisher pays for the storage of the data. Data providers can add new data, new tables, or new columns to the shared dataset and these will be immediately available to subscribers. In addition, the publisher can track subscribers, disable subscriptions, and see aggregated usage information for the shared data.
Analytics Hub makes it easy for you to publish, discover, and subscribe to valuable datasets that you can combine with your own data to derive unique insights. Here are some types of data that will be available through Analytics Hub:
- Public datasets: Easy access to the existing repository of over 200 public datasets, including data about weather and climate, cryptocurrency, healthcare and life sciences, and transportation.
- Google datasets: Unique, freely-available datasets from Google. One example of this is the COVID-19 community mobility dataset. Another example is the forthcoming Google Trends dataset, which will provide the top 25 search terms and top 25 rising search terms over a 5 year window in 210 distinct locations in the US. Trends data can be used by everyone in the organization to gain insights into what customers care about.
- Commercial (paid for) datasets: We are working with leading commercial data providers to bring their data products to Analytics Hub. If you are interested in delivering your data via Analytics Hub, we’re also introducing Data Gravity, an initiative that provides storage benefits and new distribution paths for data published through Analytics Hub.
- Internal datasets: We know that data sharing can be challenging in larger organizations. Analytics Hub can be used for internal data, for example, to share standardized customer demographics with your sales engineering and data science teams.
Customers and partners using Analytics Hub

“Google Search Trends data has always been an important tool for our WPP agency data teams. At WPP we believe that data variety is a superpower which is why we are excited to use the new Trends dataset availability within BigQuery, plus the launch of Analytics Hub. The best creativity in the world is informed by data insights, and influenced by what people search for, so the operational efficiencies we’ll gain via the Analytics Hub and the insights we can drive with Trends data are just phenomenal.”
—Di Mayze Global Head of Data and AI, WPP

“Equifax Ignite is our shared data analytics environment within our Equifax data fabric. We are excited to partner with Google to leverage Analytics Hub and BigQuery to deliver data to over 400 statisticians and data modelers as well as securely sharing data with our partner financial institutions.”
—Kumar Menon, SVP Data Fabric and Decision Science, Equifax

“The flow of data and insights between our teams at Deloitte and our clients is paramount for building truly transformational data cultures. With its purpose-built architecture for secure data exchanges and sharing analytics resources, Google Cloud’s Analytics Hub can help provide significant operational efficiencies for how Deloitte teams support our clients’ data-driven initiatives within their industry ecosystems. It will also help minimize the worries about scale, privacy and security, or the administrative burden associated with each.”
—Navin Warerkar, Managing Director, Deloitte Consulting LLP, and US Google Cloud Data & Analytics GTM Lead

“Crux Informatics is proud to partner with Google to support the launch of Analytics Hub, removing friction for those who need access to analytics-ready data. With thousands of datasets from over 140 sources, Crux Informatics will accelerate access to data on Analytics Hub and together provide a more efficient and cost effective solution to deliver datasets in Google Cloud’s ecosystem.”
—Will Freiberg, CEO, Crux Informatics
Next steps for Analytics Hub
This is just the beginning for Analytics Hub. As we get to preview and general availability, we will be adding additional capabilities, including workflows for publishing and subscribing, publishing analytics assets (Looker Blocks, Data Studio reports, Connected Google Sheets) along with the shared data, the ability for data publishers to specify query restrictions on the usage of their data, and making it easy for data publishers to create sandbox environments for subscribers to work with their data, even if they are not yet on Google Cloud. We will provide features in Analytics Hub for monetization of data, including managing subscriptions, data entitlements, and billing.
Please sign up for the preview, which is scheduled to be available in the third quarter of 2021. In the meantime, you can learn more about BigQuery and how to leverage its built-in data sharing capabilities. Please go to g.co/cloud/analytics-hub to register your interest in Analytics Hub.
More Relevant Stories for Your Company

Migrate Your Microsoft SQL Server Workloads to Google Cloud
Enterprise database workloads are the backbone of many of your applications and ecosystems. Also, guaranteed availability is critical when choosing a cloud provider. Many enterprises built their mission-critical applications on Microsoft SQL Server 2008, and it’s common still to run into older versions of SQL Server as you’re working toward

Over 700 SaaS Companies Trust Google’s Data Cloud to Build Intelligent Apps!
Today, a typical enterprise uses over 100 SaaS applications while large organizations commonly use over 400 apps. These applications contain valuable data on customers, suppliers, employees, products and more, offering the potential for valuable insights and powerful workflows. However, in the past, this data has often remained siloed and underutilized,
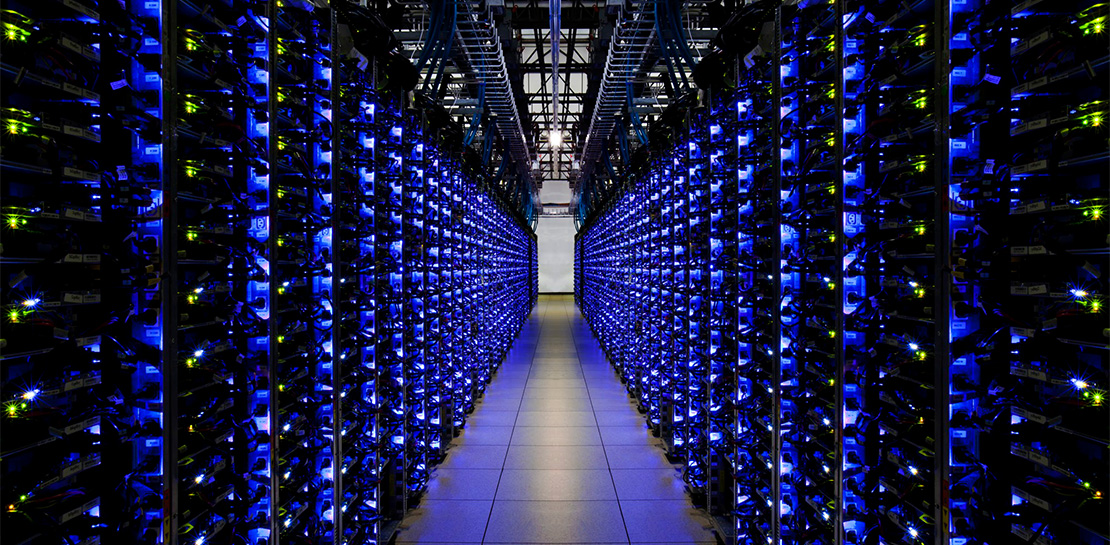
Memorystore for Redis Read Replicas to Scale App Read Requests by 6X
Modern applications need to process large-scale data at millisecond latency to provide experiences like instant gaming leaderboards, fast analysis of streaming data from millions of IoT sensors, or real-time threat detection of malicious websites. In-memory datastores are a critical component to deliver the scale, performance, and availability required by these

Four Key Takeaways from Google and Quantum Metric’s Back-to-School Retail Benchmark Study
Is it September yet? Hardly! School is barely out for the summer. But according to Google and Quantum Metric research, the back-to-school and off-to-college shopping season – which in the U.S. is second only to the holidays in terms of purchasing volume1 – has already begun. For retailers, that means
