





Build Open Data Platform on GCP with Delta Lake, Presto and Dataproc

3406
Of your peers have already read this article.
5:00 Minutes
The most insightful time you'll spend today!
Organizations today build data lakes to process, manage and store large amounts of data that originate from different sources both on-premise and on cloud. As part of their data lake strategy, organizations want to leverage some of the leading OSS frameworks such as Apache Spark for data processing, Presto as a query engine and Open Formats for storing data such as Delta Lake for the flexibility to run anywhere and avoiding lock-ins.
Traditionally, some of the major challenges with building and deploying such an architecture were:
- Object Storage was not well suited for handling mutating data and engineering teams spent a lot of time in building workarounds for this
- Google Cloud provided the benefit of running Spark, Presto and other varieties of clusters with the Dataproc service, but one of the challenges with such deployments was the lack of a central Hive Metastore service which allowed for sharing of metadata across multiple clusters.
- Lack of integration and interoperability across different Open Source projects
To solve for these problems, Google Cloud and the Open Source community now offers:
- Native Delta Lake support in Dataproc, a managed OSS Big Data stack for building a data lake with Google Cloud Storage, an object storage that can handle mutations
- A managed Hive Metastore service called Dataproc Metastore which is natively integrated with Dataproc for common metadata management and discovery across different types of Dataproc clusters
- Spark 3.0 and Delta 0.7.0 now allows for registering Delta tables with the Hive Metastore which allows for a common metastore repository that can be accessed by different clusters.
Architecture
Here’s what a standard Open Cloud Datalake deployment on GCP might consist of:
- Apache Spark running on Dataproc with native Delta Lake Support
- Google Cloud Storage as the central data lake repository which stores data in Delta format
- Dataproc Metastore service acting as the central catalog that can be integrated with different Dataproc clusters
- Presto running on Dataproc for interactive queries
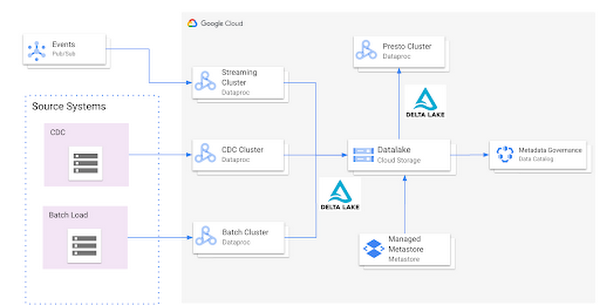
Such an integration provides several benefits:
- Managed Hive Metastore service
- Integration with Data Catalog for data governance
- Multiple ephemeral clusters with shared metadata
- Out of the box integration with open file formats and standards
Reference implementation
Below is a step by step guide for a reference implementation of setting up the infrastructure and running a sample application
Setup
The first thing we would need to do is set up 4 things:
- Google Cloud Storage bucket for storing our data
- Dataproc Metastore Service
- Delta Cluster to run a Spark Application that stores data in Delta format
- Presto Cluster which will be leveraged for interactive queries
Create a Google Cloud Storage bucket
Create a Google Cloud Storage bucket with the following command using a unique name.
gsutil mb gs://<your-bucket-name>
Create a Dataproc Metastore service
Create a Dataproc Metastore service with the name “demo-service” and with version 3.1.2. Choose a region such as us-central1. Set this and your project id as environment variables.
REGION=<your-region>PROJECT_ID=<your-project-id>gcloud metastore services create demo-service \--hive-metastore-version=3.1.2 \--location=${REGION}
Create a Dataproc cluster with Delta Lake
Create a Dataproc cluster which is connected to the Dataproc Metastore service created in the previous step and is in the same region. This cluster will be used to populate the data lake. The jars needed to use Delta Lake are available by default on Dataproc image version 1.5+
gcloud dataproc clusters create delta-cluster \--dataproc-metastore=projects/${PROJECT_ID}/locations/us-central1/services/demo-service \--region=${REGION} \--image-version=2.0.0-RC22-debian10
Create a Dataproc cluster with Presto
Create a Dataproc cluster in us-central1 region with the Presto Optional Component and connected to the Dataproc Metastore service.
gcloud dataproc clusters create presto-cluster \--dataproc-metastore=projects/${PROJECT_ID}/locations/us-central1/services/demo-service \--region=${REGION} \--image-version=2.0-debian10 \--optional-components=PRESTO \--enable-component-gateway
Spark Application
Once the clusters are created we can log into the Spark Shell by SSHing into the master node of our Dataproc cluster “delta-cluster”.. Once logged into the master node the next step is to start the Spark Shell with the delta jar files which are already available in the Dataproc cluster. The below command needs to be executed to start the Spark Shell. Then, generate some data.
spark-shell --jars /usr/lib/delta/jars/delta-core.jarimport io.delta.tables._import org.apache.spark.sql.functions._// Simulate application dataval orig_df = Seq((1L, 3.0), (2L, -1.0), (3L, 0.0)).toDF("x", "y")
# Write Initial Delta format to GCS
Write the data to GCS with the following command, replacing the project ID.
orig_df.write.mode("append").format("delta").save("gs://<your-bucket-name>/first-delta-table")
# Ensure that data is read properly from Spark
Confirm the data is written to GCS with the following command, replacing the project ID.
spark.read.format("delta").load("gs://<your-bucket-name>/first-delta-table").show()
Once the data has been written we need to generate the manifest files so that Presto can read the data once the table is created via the metastore service.
# Generate manifest files
val deltaTable = DeltaTable.forPath("gs://<your-bucket-name>/first-delta-table")deltaTable.generate("symlink_format_manifest")
With Spark 3.0 and Delta 0.7.0 we now have the ability to create a Delta table in Hive metastore. To create the table below command can be used. More details can be found here
# Create Table in Hive metastore
spark.sql("CREATE TABLE my_first_table (x bigint,y double) ROW FORMAT SERDE 'org.apache.hadoop.hive.ql.io.parquet.serde.ParquetHiveSerDe' STORED AS INPUTFORMAT 'org.apache.hadoop.hive.ql.io.SymlinkTextInputFormat' OUTPUTFORMAT 'org.apache.hadoop.hive.ql.io.HiveIgnoreKeyTextOutputFormat' LOCATION 'gs://<your-bucket-name>/first-delta-table/_symlink_format_manifest'")
Once the table is created in Spark, log into the Presto cluster in a new window and verify the data. The steps to log into the Presto cluster and start the Presto shell can be found here.
#Verify Data in Presto
presto:default> select * from hive.default.my_first_table;x | y----+------2 | -1.03 | 0.01 | 3.0
Once we verify that the data can be read via Presto the next step is to look at schema evolution. To test this feature out we create a new dataframe with an extra column called “z” as shown below:
# Schema Evolution in Spark
Switch back to your Delta cluster’s Spark shell and enable the automatic schema evolution flag
spark.sql("SET spark.databricks.delta.schema.autoMerge.enabled = true")
Once this flag has been enabled create a new dataframe that has a new set of rows to be inserted along with a new column
val merge_df = Seq((10L, 30.0, "a"), (20L, -10.0, "b"), (30L, 100.0, "c")).toDF("x", "y", "z")
Once the dataframe has been created we leverage the Delta Merge function to UPDATE existing data and INSERT new data
# Use Delta Merge Statement to handle automatic schema evolution and add new rows
deltaTable.alias("o").merge(merge_df.as("n"),"o.x = n.x").whenMatched.updateAll().whenNotMatched.insertAll().execute()
As a next step we would need to do two things for the data to reflect in Presto:
- Generate updated schema manifest files so that Presto is aware of the updated data
- Modify the table schema so that Presto is aware of the new column.
When the data in a Delta table is updated you must regenerate the manifests using either of the following approaches:
- Update explicitly: After all the data updates, you can run the generate operation to update the manifests.
- Update automatically: You can configure a Delta table so that all write operations on the table automatically update the manifests. To enable this automatic mode, you can set the corresponding table property using the following SQL command.
ALTER TABLE delta.<path-to-delta-table> SET TBLPROPERTIES(delta.compatibility.symlinkFormatManifest.enabled=true)
However, in this particular case we will use the explicit method to generate the manifest files again
deltaTable.generate("symlink_format_manifest")
Once the manifest file has been re-created the next step is to update the schema in Hive metastore for Presto to be aware of the new column. This can be done in multiple ways, one of the ways to do this is shown below:
# Promote Schema Changes via Delta to Presto
val schema_evolution = "ALTER TABLE my_first_table ADD COLUMN ( " + merge_df.schema.toDDL.replace(orig_df.schema.toDDL,"").substring(1) + ")"spark.sql(s"$schema_evolution")
Once these changes are done we can now verify the new data and new column in Presto as shown below:
# Verify changes in Presto
presto:default> select * hive.default.from my_first_table;x | y | z----+-------+------20 | -10.0 | b2 | -1.0 | NULL3 | 0.0 | NULL30 | 100.0 | c10 | 30.0 | a1 | 3.0 | NULL
In summary, this article demonstrated:
- Set up the Hive metastore service using Dataproc Metastore, spin up Spark with Delta lake and Presto clusters using Dataproc
- Integrate the Hive metastore service with the different Dataproc clusters
- Build an end to end application that can run on an OSS Datalake platform powered by different GCP services
Next steps
If you are interested in building an Open Data Platform on GCP please look at the Dataproc Metastore service for which the details are available here and for details around the Dataproc service please refer to the documentation available here. In addition, refer to this blog which explains in detail the different open storage formats such as Delta & Iceberg that are natively supported within the Dataproc service.
Datashare for Financial Services: Securing the Publishers and Consumers’ Access to Market Data

8567
Of your peers have already read this article.
4:30 Minutes
The most insightful time you'll spend today!
Access to the cloud has advanced the distribution and consumption of financial information on a global scale. In parallel, the global financial data landscape has been transformed by an influx of alternative data sources, including social media, meteorological data, satellite imagery, and other data. Exchanges and market data providers now find they need to include these new datasets to enrich their products and compete, which has meant they now must consider cloud-based models to keep up with the demands of their customers who expect easy, quick, flexible and cost-efficient ways to consume market data.
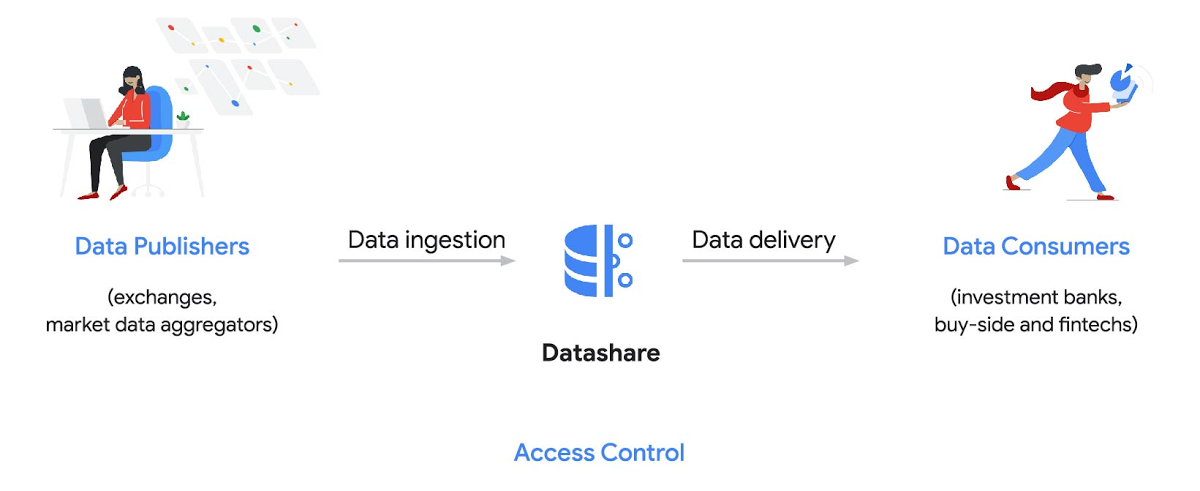
To address these needs, today we’re announcing the general availability of Datashare for financial services, a new Google Cloud solution that brings together the entire capital markets ecosystem—data publishers, and data consumers—to exchange market data securely and easily.
Datashare helps organize third-party financial information, making it accessible and useful to market data publishers and data consumers. We open-sourced the entire Datashare solution so market data publishers can now onboard their licensed datasets to Google Cloud securely, quickly and easily, while data consumers can consume that data as a service in tools of their preference, such as BigQuery.
Three ways to distribute and consume your data
Batch data delivery
Datashare provides a batch data delivery mechanism for data publishers to deliver their reference data, historical tick data, alternative market data sources and more via BigQuery, reducing the administrative burden on data consumers to extract insights from data.
Real-time data streaming delivery
By using this event-based data delivery channel for rapidly changing instrument prices, tick data, orders, news and others via Pub/Sub, data consumers can reliably process individual messages or rewind to a point in time to replay a prior market scenario and test model changes.
Monetizing licensed datasets
Market data publishers can onboard their licensed datasets to Google Cloud and make them available via a one-stop-shop on Google Cloud Marketplace, enabling a new sales channel to expand market reach.
Reference architecture
Check out the diagram below to see how you can share your batch and real-time data directly to your Google Cloud customers with BigQuery and Pub/Sub.

As you can see in the above reference architecture, both publishers and consumers can derive several benefits from the solution:
Benefits for data publishers
- You no longer have to maintain your own delivery and licensing infrastructure.
- You can easily package and deliver granular data products and experiments with SQL.
- You can have a solution that scales with your business as data volumes and number of customers grow.
Benefits for data consumers
- Your data is ready for analysis and machine learning (ML)— you no longer have to maintain extract, transform, and load (ETL) pipelines to load files and transform data.
- You can avoid the expense and burden of maintaining multiple copies of large data files.
- You can be more targeted with consumption of data using BigQuery queries, improving performance, and compliance, and reducing cost.
Accessing the datasets
Google Cloud has been working with multiple industry firms on innovating in the market data space. By using Datashare for publishing, data publishers can make their entire datasets available on Google Cloud. Early adopters of Datashare include firms such as OneTick and Accern. OneTick’s datasets include reference and historical futures data (that can be accessed in our console with your login). Accern’s datasets include alternative data such as market sentiment and credit analysis data (that can be accessed in our console with your login).
To make it more helpful, we partnered with Accern to create a hypothetical scenario to describe the data acquisition and analytics process step-by-step.
Accern use case
As a sustainability analyst, you require an economic, social and governance (ESG) dataset to determine which sector is the most widely covered ESG sector by analysts, and to also identify the sector with the lowest ESG sentiment score. Now, you can discover and acquire an ESG dataset in Google Cloud.
Step 1. Navigate to the Financial Services solutions page in the Google Cloud console:

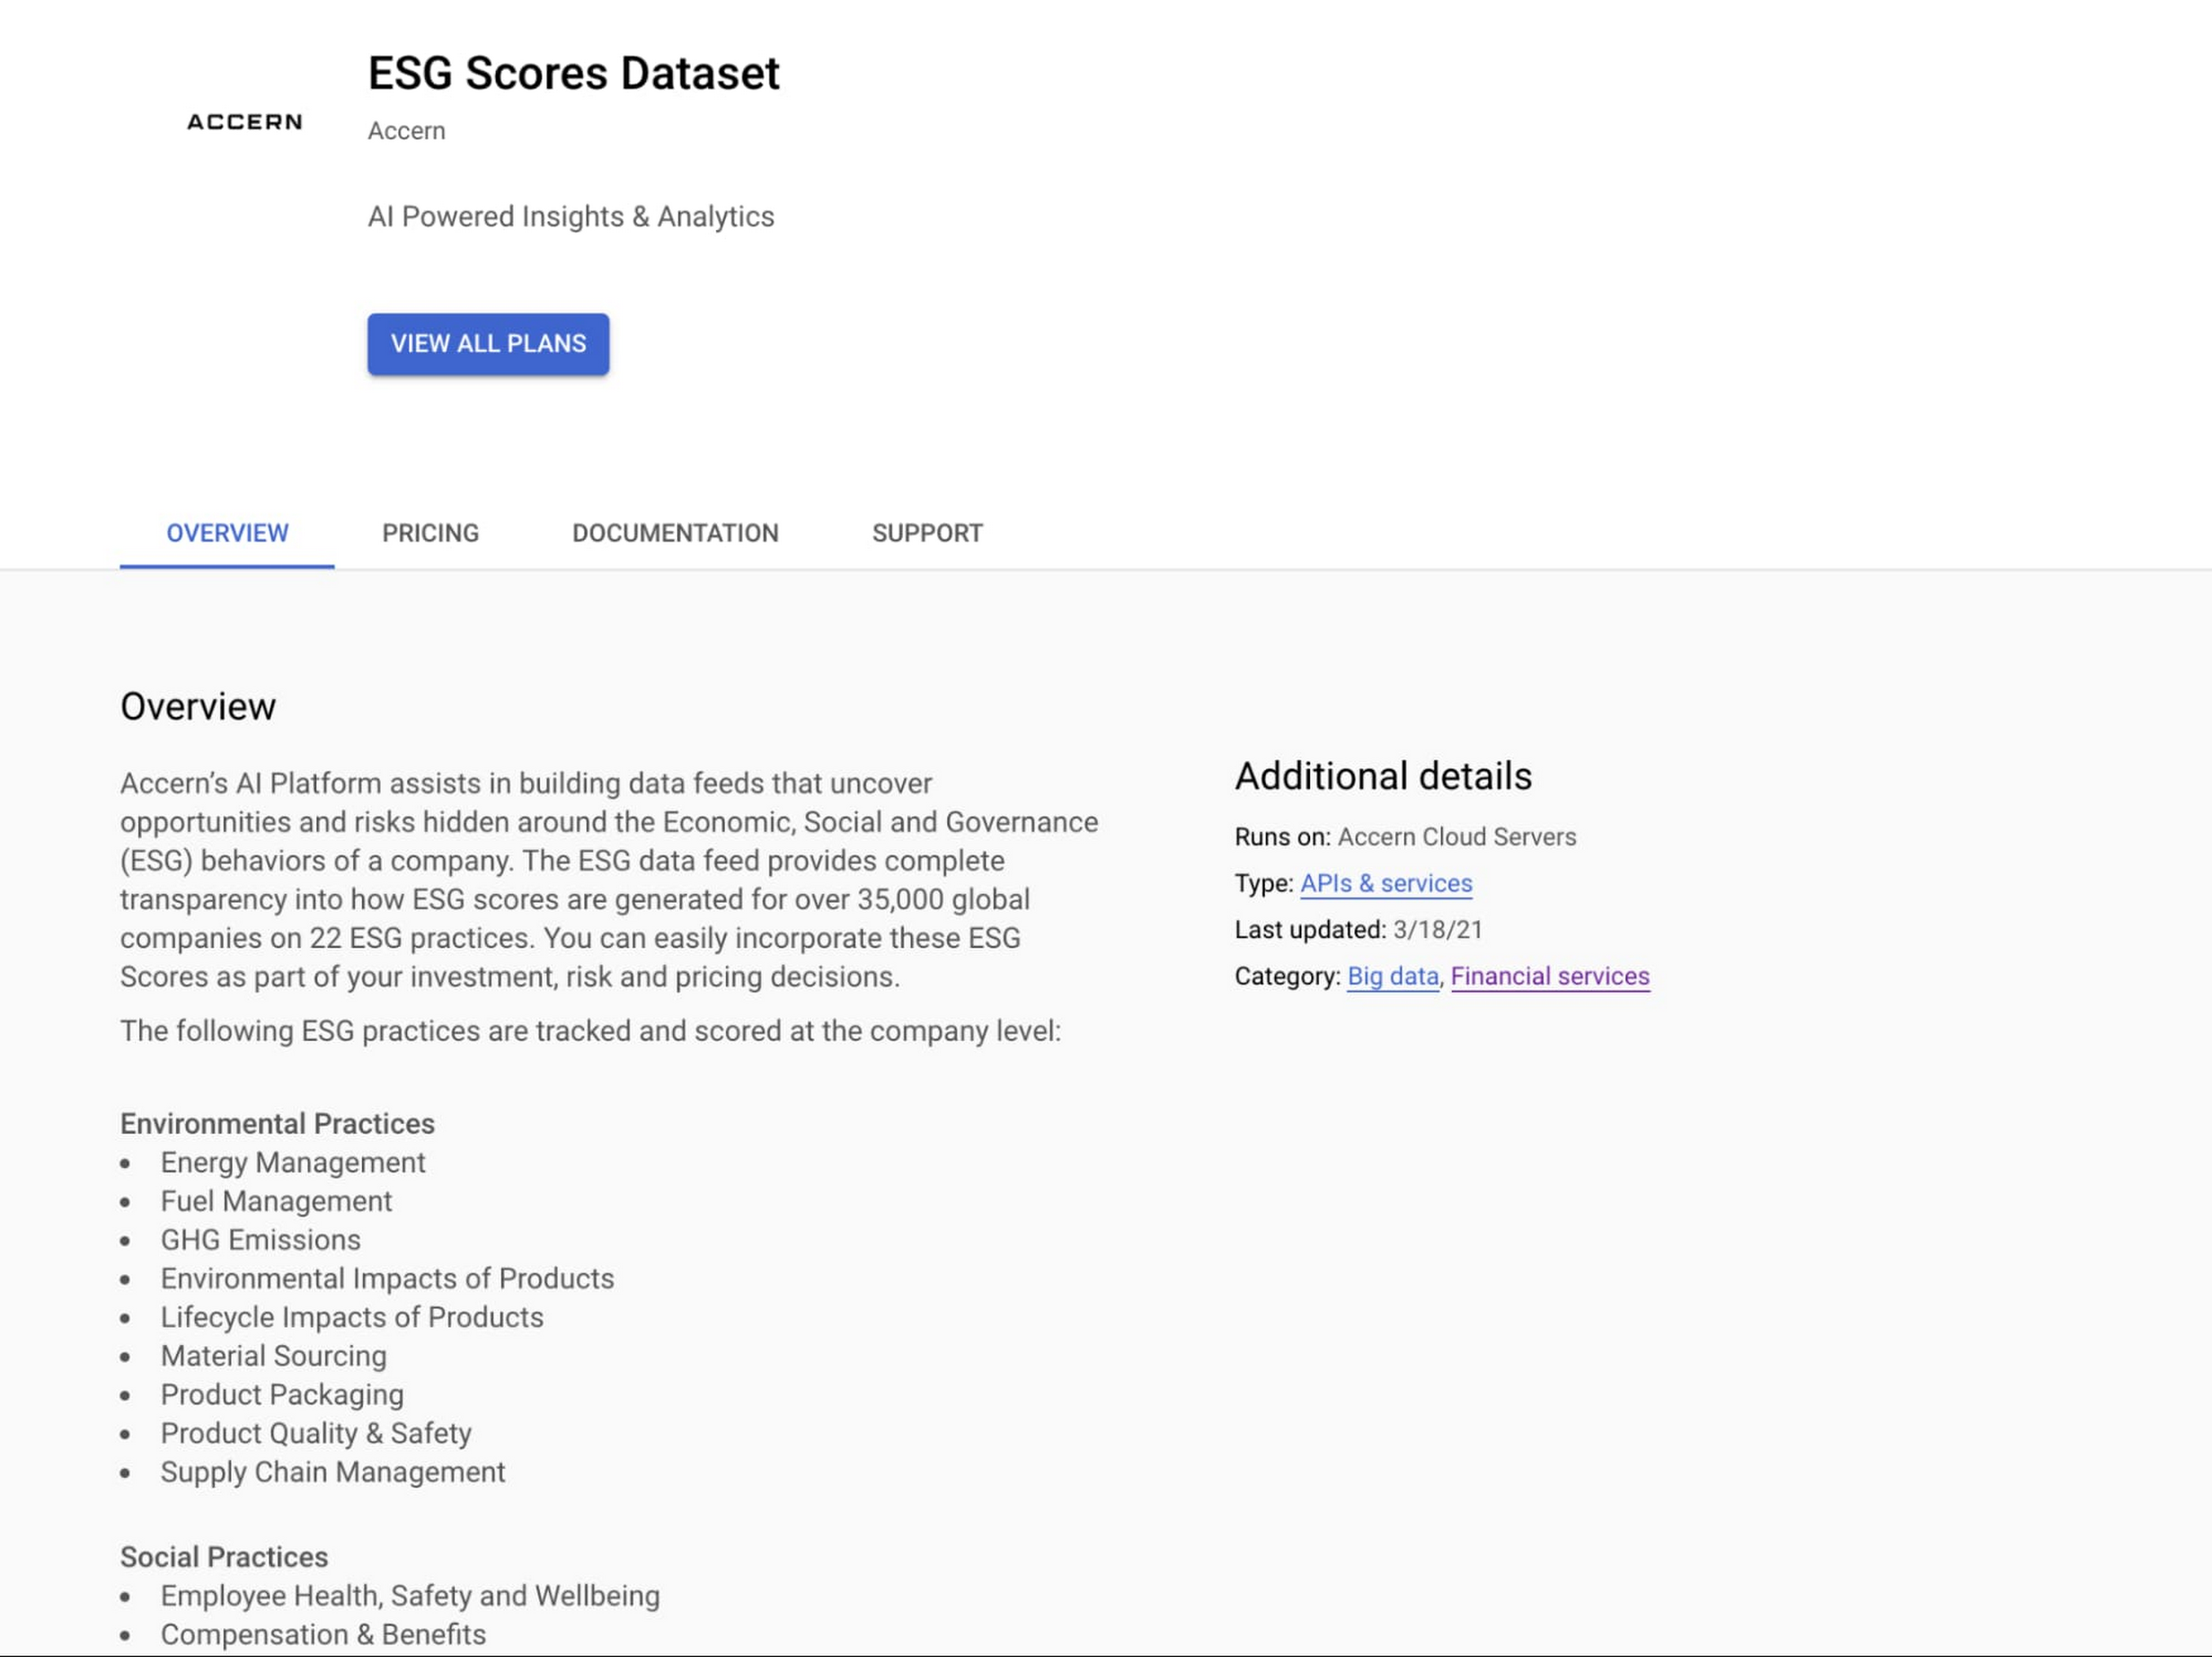
Step 2. Click a dataset, for example Accern AI-Generated ESG Insights, then review the overview details, plans and pricing, documentation and support information. To view the available pricing tiers, click ‘View All Plans’. Once you’ve decided on a tier that you would like to subscribe to, click ‘Select’, choose a billing account and review and accept the terms of service to complete the subscription. Once the steps are complete, click ‘Subscribe’ at the bottom. An overlay window will appear, click ‘Register with Accern’ to activate and complete the subscription.

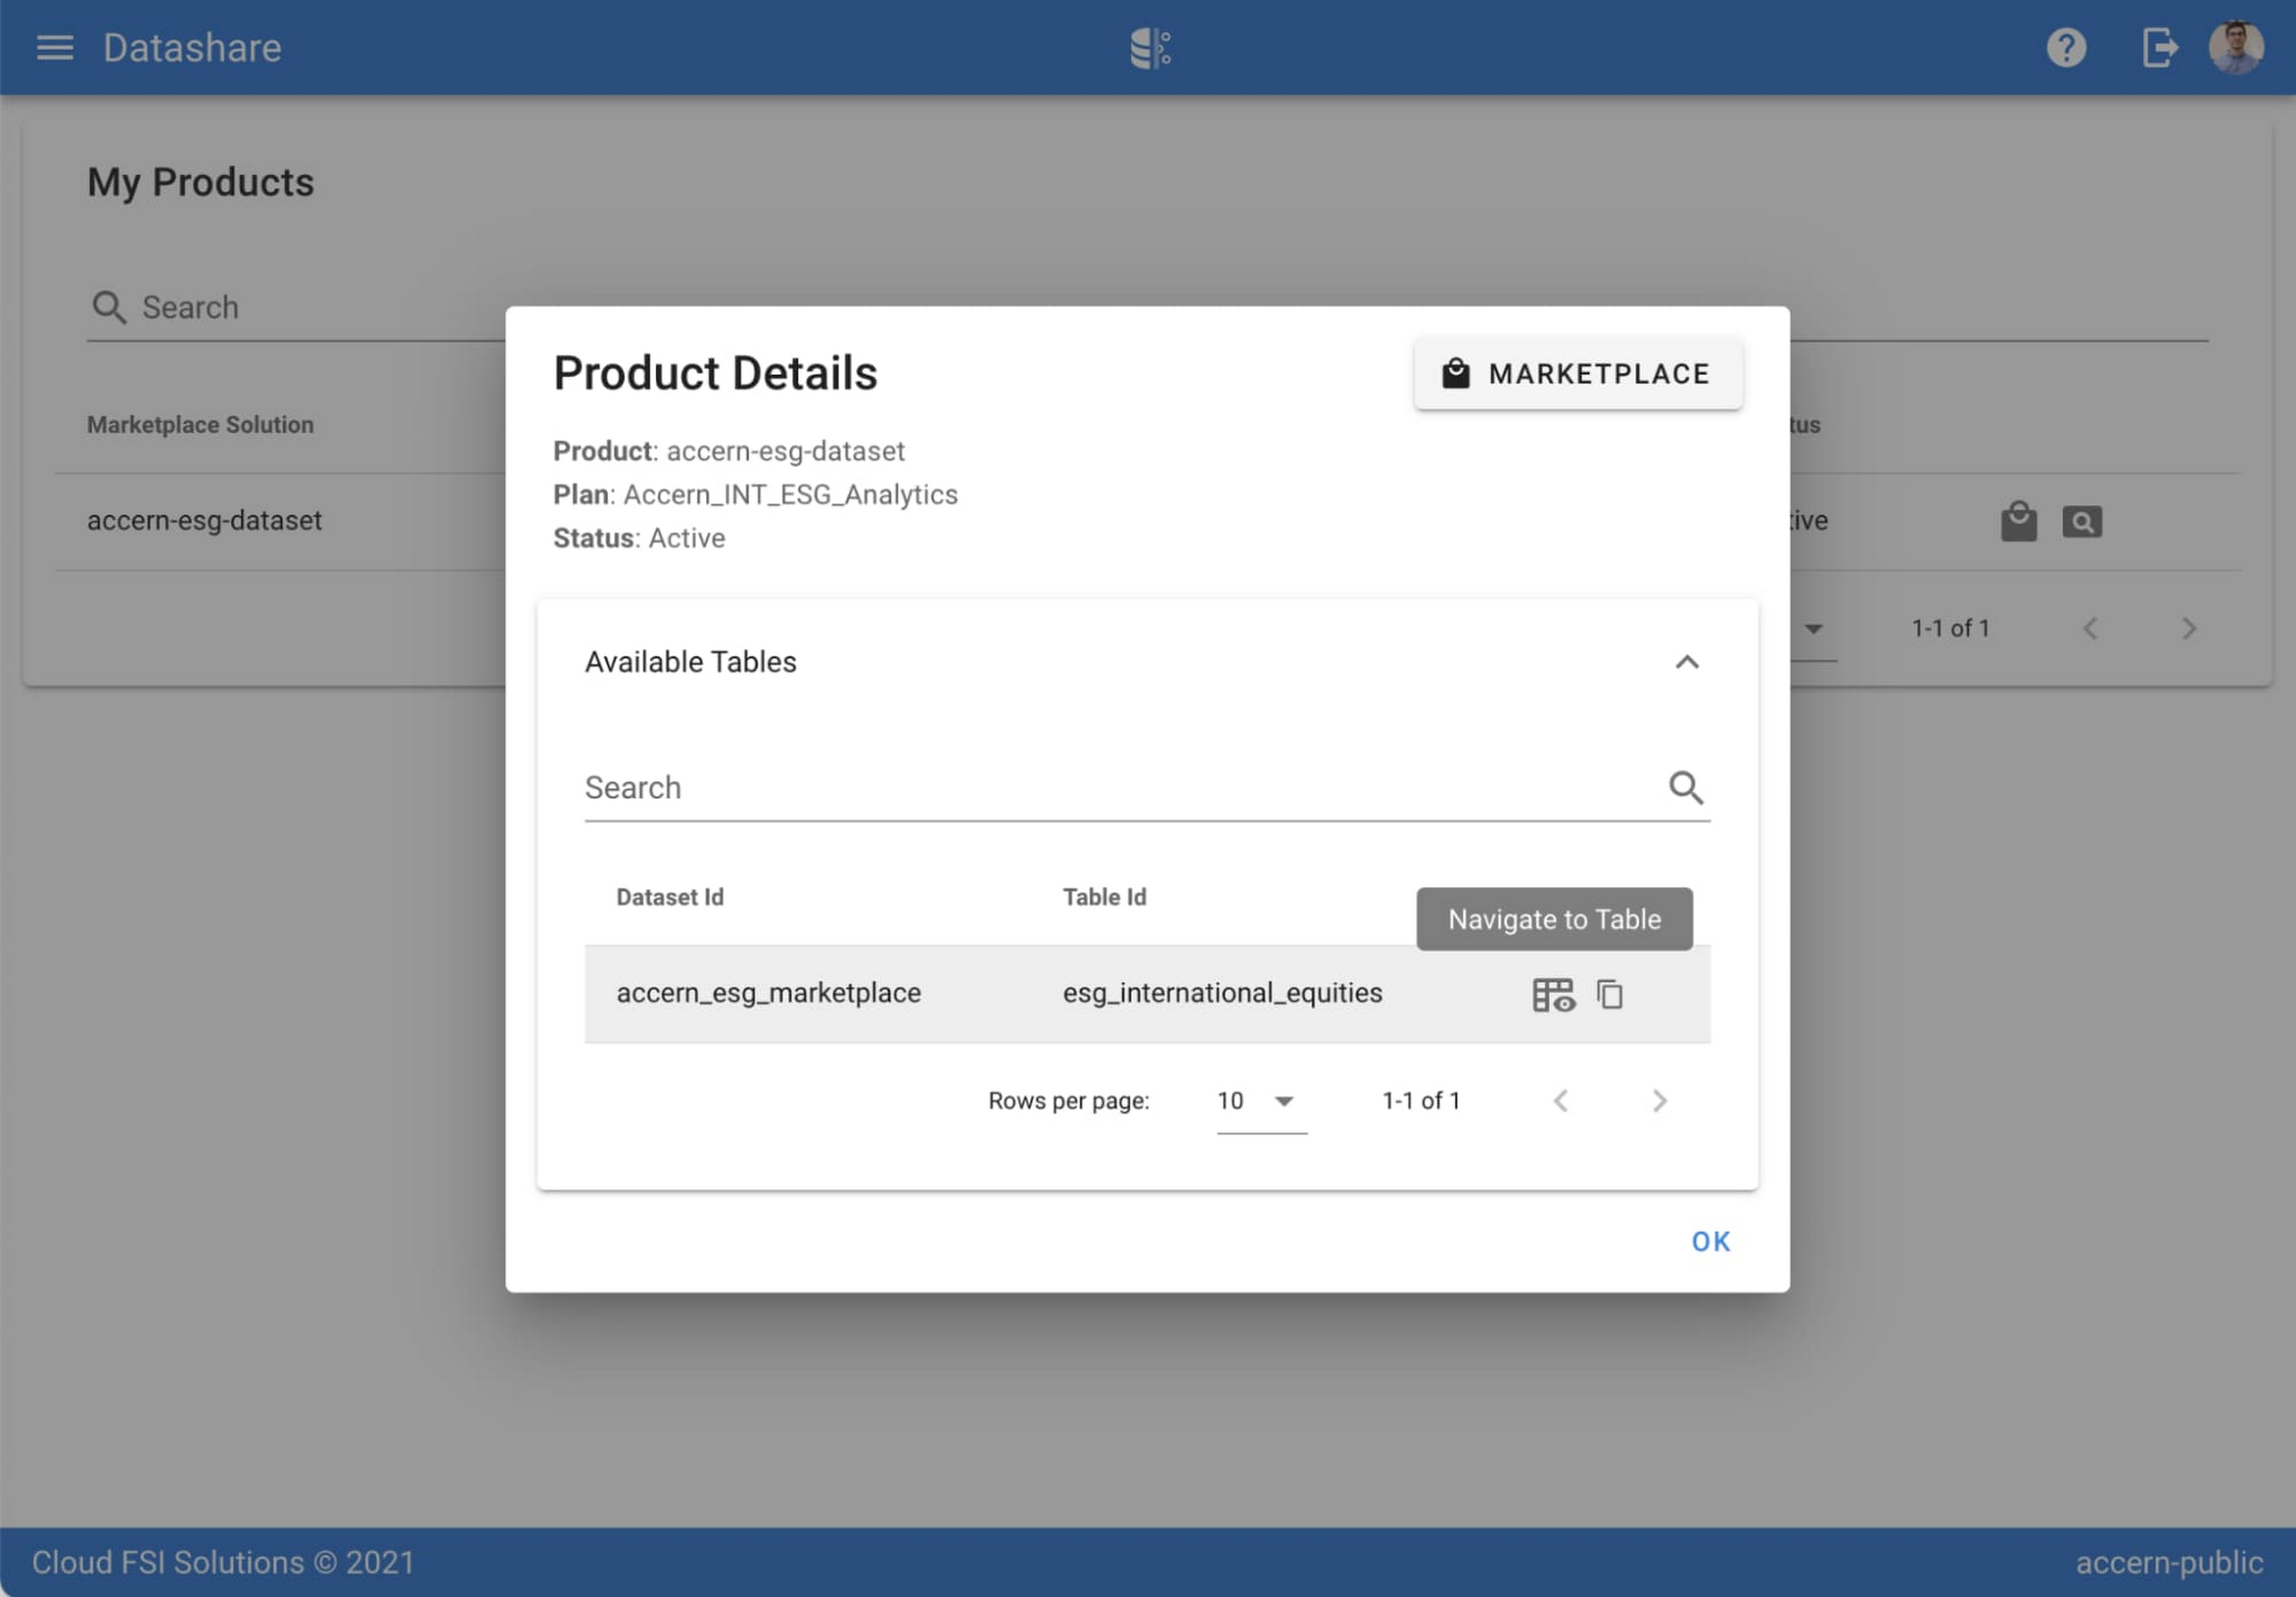
Step 3. Once activation is complete, you’ll be directed to the Datashare ‘My Products’ screen. Voila! You are now subscribed to Accern’s ESG Scores dataset and can access it in your Google Cloud instance using BigQuery. To access the data, click the hour glass icon on the corresponding ‘My Products’ record that you just purchased. An overlay will present you with the details on the dataset and/or table. Click the ‘Navigate to Table’ button to navigate through to the BigQuery console.


Step 4. Now that you have access and are in the BigQuery console, it’s time to generate data insights.
For this example, we’ve eliminated the company identifying information that is included as part of the subscription and aggregated company ESG in a view where each row represents a day, an industry sector, a specific identified ‘ESG Issues’ (event_group and event) and the respective ‘ESG Sentiment’ per issue.

For example, row 1 indicates that within the ‘Healthcare’ sector, there was a ‘Social – Civil Society’ issue identified and it had a negative ESG sentiment score of -15.35.
Step 5. Generate a report by exporting it to Data Studio to build visualizations and conduct additional analysis on the ESG data.
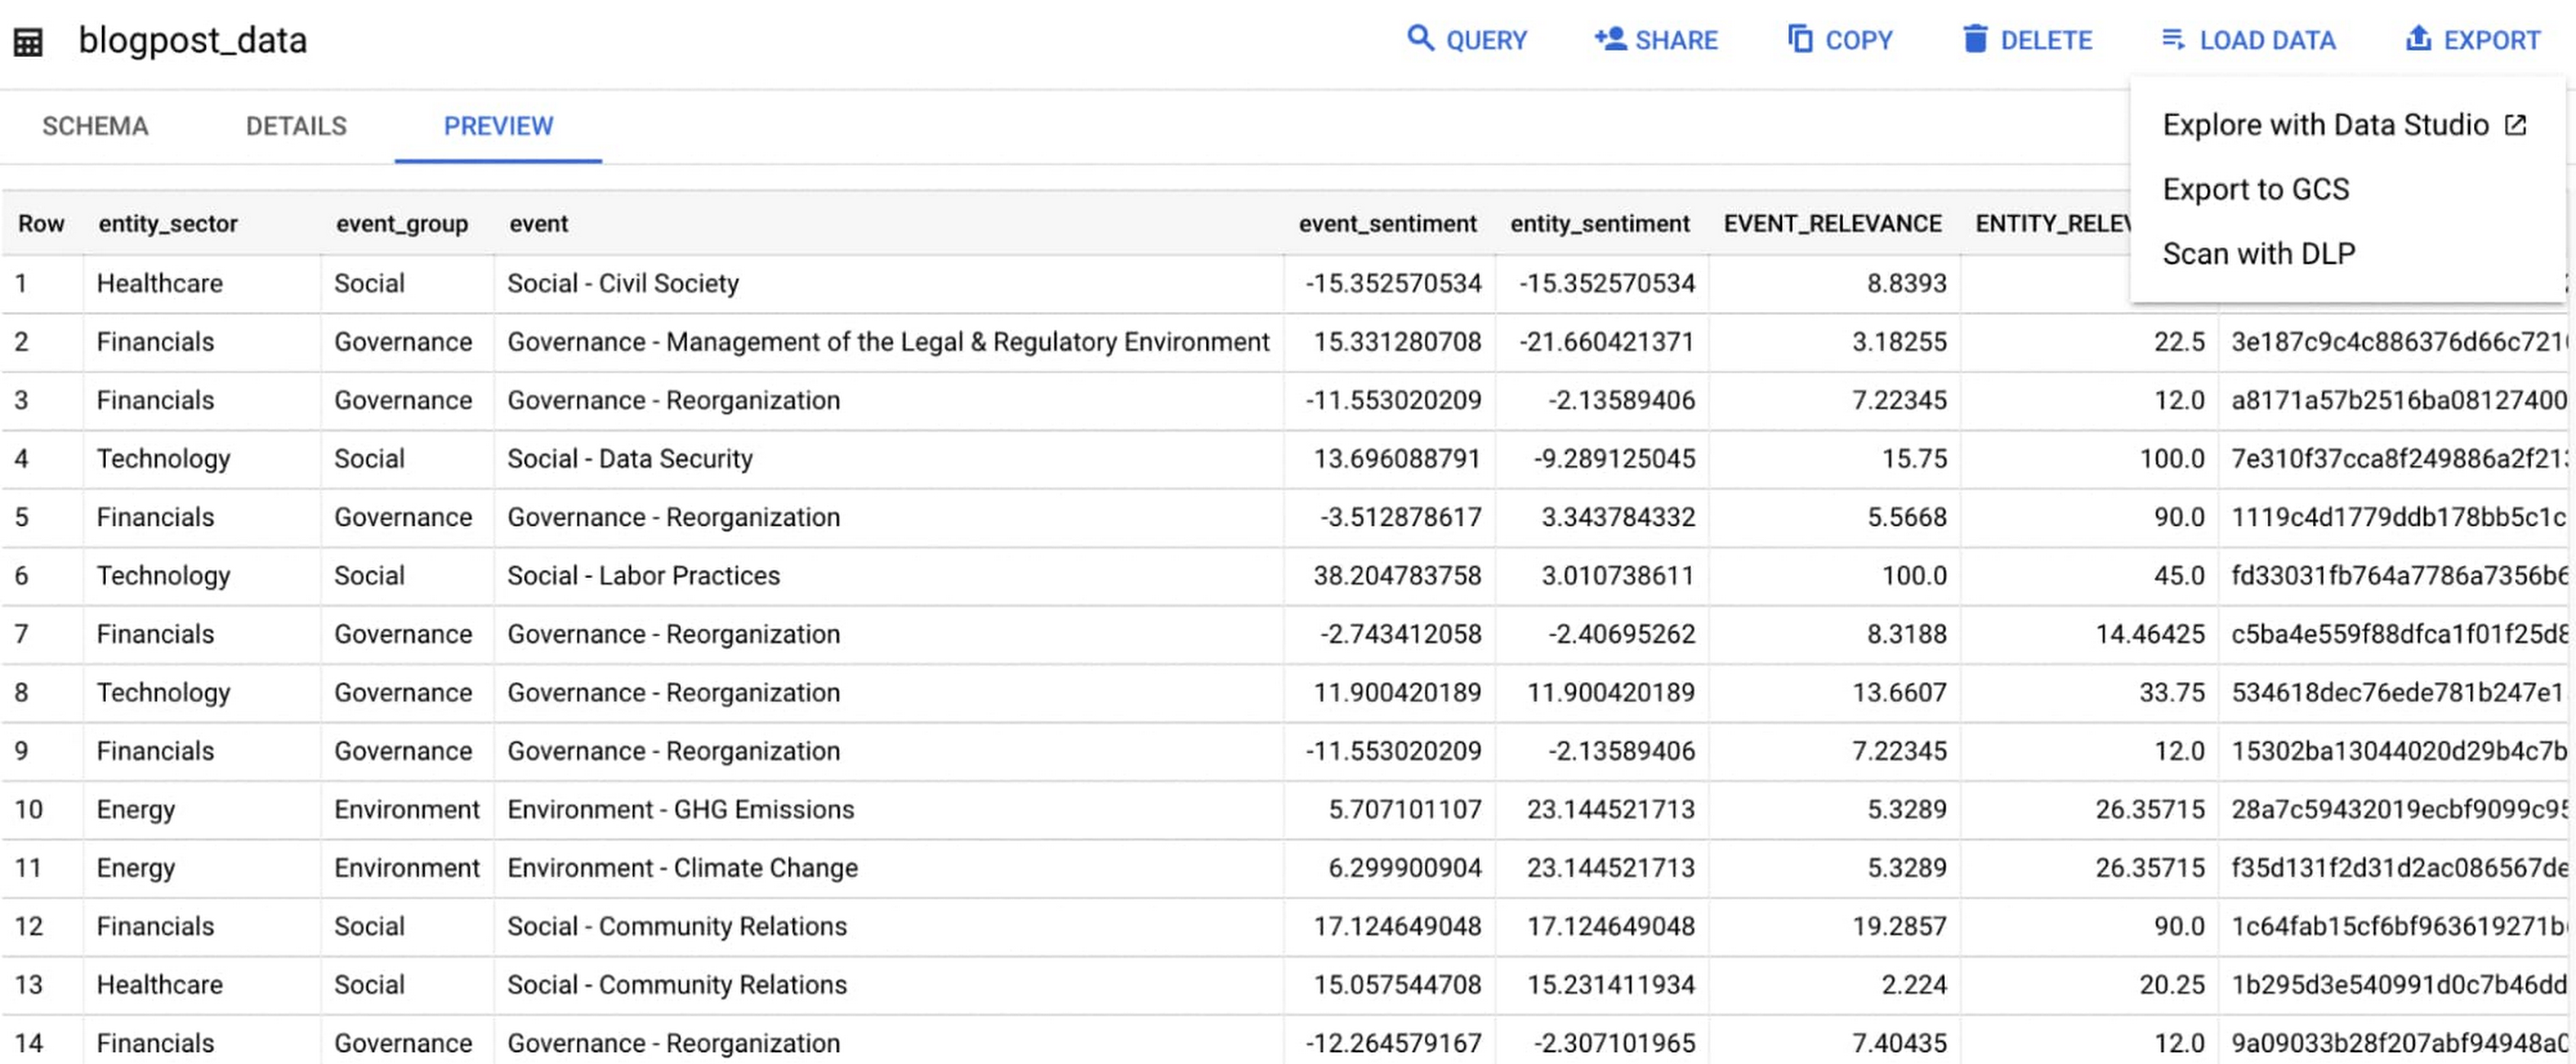
Select ‘Export’ and ‘Explore with Data Studio’.
Step 6. Build a simple/basic report.
Now that the ESG data appears in Data Studio, you can start by building a simple chart to help you understand which industry sectors have the highest volume of discussions around ESG and the overall ESG Sentiment per industry sector.
To build the chart:
- Select the chart type ‘Table’.
- Include
Entity_Sectoras your dimension to aggregate results by ‘Industry Sector.’ - Include
Signal_IDas a measure to count the number of ESG passages identified per ‘Industry Sector.’ - Include
AVG(Event_Sentiment)as a measure to display the overall ESG Sentiment per ‘Industry Sector’ across ESG Issues.

You can see sectors that are most discussed when it comes to ESG related topics and their corresponding ‘ESG Sentiment’ scores.
Step 7. Build your final report in Data Studio.
As a next step you can further drill into the data to understand ESG data specific to each ‘Industry Sector’ and identify positive and negative ESG practices.
Accern has built a more complex sample dashboard and made it available publicly here. You can interact with this report and play around with the data. The dashboard can help to identify material ESG insights for each sector to inform your investment and risk processes. If you have additional questions, you can reach out to Accern directly.

Discovering, accessing and analyzing licensed datasets is quick and easy. Stay tuned for more updates on new licensed datasets.
Publishing your data via Datashare
If you are a publisher of market data, alternative, or exotic data, you can use Datashare to get it published on Google Cloud Marketplace.
Start by joining the Partner Advantage program by registering for the Partner Advantage Portal and applying for the Partner Advantage Build Model engagement. Visit our getting started guide for information to get started on publishing licensed datasets in the Marketplace. Stay tuned for a future blog post about using Datashare to publish datasets in the Marketplace.
More solutions for capital markets
Check out other Google Cloud solutions for capital markets.
Vodafone Leverages Google Cloud to Aid COVID-19 Frontline with Anonymized Insights on Population Mobility

11181
Of your peers have already read this article.
1:30 Minutes
The most insightful time you'll spend today!
Editor’s note: When Europe’s largest mobile communications company, Vodafone, was asked by the European Commission to help understand population movement across the European Union and the UK to help fight COVID-19, it was able to provide anonymized mobile network-based insights to answer the call. Here’s how Vodafone, with the support of Google Cloud, rapidly mobilized the COVID-19 frontline, while respecting its customers’ privacy.
With the emergence of COVID-19 in early 2020, the European Commission—the executive branch of the European Union (EU)—knew that technology would be instrumental in its fight to control the pandemic. With various lockdowns imposed across its member states, the Commission was keen to predict and prevent the spread of COVID-19 and to manage the related social, political and financial impacts.
Mobile network data helps track COVID-19 across the EU
Mobile networks produce location data, which can be turned into useful anonymous insights to understand population movement within a geographic area. The European Commission, working with mobile industry association GSMA (Groupe Speciale Mobile Association), asked Europe’s major mobile phone operators for help in producing insights to support the fight against COVID-19. As the largest mobile network operator within the EU, Vodafone saw this as a critical opportunity to participate.
Vodafone had previous experience of using mobile network data to support pandemic research. For example, in 2019, Vodafone provided mobility pattern analysis to help track the spread of Malaria in Mozambique. And, during the early stages of the COVID-19 pandemic (prior to working with the European Commission), Vodafone assisted the Italian and Spanish governments in understanding their citizens’ mobility patterns. Vodafone had also previously offered anonymized and aggregated population mobility insights to support public transport and tourism authorities and retail organizations in a number of countries. Consequently, Vodafone was perfectly placed to play a greater role in supporting the European Commission’s response to the pandemic.
When asked to assist the European Commission, Vodafone first considered how it could safely share its data with the governing body without providing details on the individual movements of its customers. It realized it could achieve this through an elaborate set of anonymization and aggregation techniques. Insights are aggregated from a minimum of 50 users and Vodafone only shared these anonymous insights and never the actual raw data with the Commission. As specified by the EU, these insights are then presented onto a large geographical region, typically a city or a county with thousands of people living in that area.
These insights illustrate how people move, helping to determine how lockdowns and self-isolation measures were impacting behaviors.
Using Google Cloud to collate and store population mobility data
In April 2020, Vodafone began migrating its operations, including its mobile data, to Google Cloud on servers in Europe and the UK with elaborate security safeguards, including encryption, building on a previous partnership.
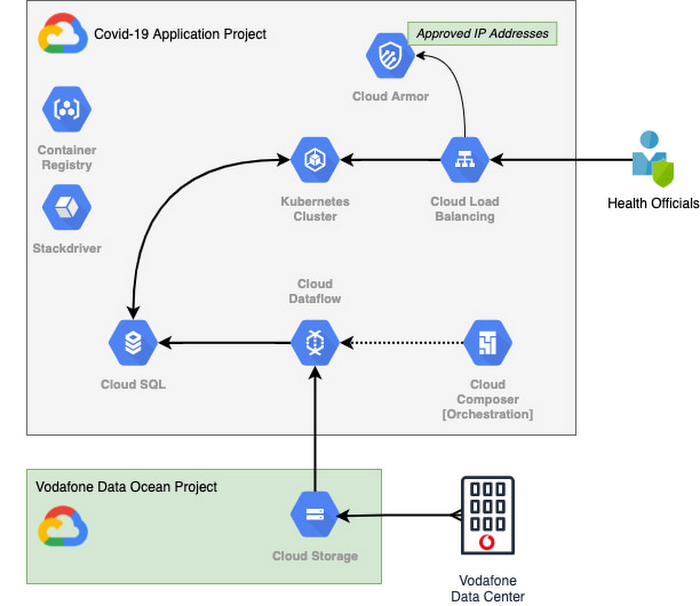
With the data residing in EU and UK data centers and not the United States, Vodafone could then retrieve anonymous insights from Google Cloud Storage instantaneously. Before supplying any information to the European Commission, however, Vodafone used Dataflow to validate the data and run a series of tests to ensure the database had accurate data, before ingesting and archiving the relevant metrics. For instant access, the data was then made available to the European Commission using a Redis database on Google Kubernetes Engine.
To ensure aggregate Vodafone customer data was always safe, secure, and anonymous, all entry points to the front-end were protected behind Google Cloud Armor, where only specific IP addresses were allowed. Using these tools, seamless data pipelines fed in predefined key performance indicators from each specified European market. While data quality measures ensured the definitions for metrics across markets were consistent and could be accurately compared.
The architecture (pictured below) shows how Vodafone integrated and anonymized its data on Google Cloud.
Live interactive dashboard shows population mobility in real-time
With its data integrated on Google Cloud, Vodafone created a live, interactive dashboard to track mobility patterns and share relevant information with the European Commission in real-time.
The European Commission Joint Research Center (JRC) was able to gather valuable information from these insights, which enabled them to see where population mobility was aiding the spread of the disease, when cross-referenced with health data. It could also assess the implications of lockdowns on different populations and forecast cross-country spreading.
Mobile data aids disease modeling for multiple stakeholders
The Vodafone data became instrumental in modeling the likely course of the disease too. For example, the University of Southampton in the UK used it to predict the outcome of different coordinated COVID-19 exit strategies across Europe. This research was published in Science Magazine in September 2020.
The Vodafone data dashboard continues to be used by individual governments, NGOs and organizations to further investigate the impacts of the pandemic and to measure the effectiveness of response strategies alongside the rollout of vaccination programs. The project also helped Vodafone win a DataIQ award for most effective stakeholder engagement.
Using the learnings from this project, Vodafone has been able to adapt its own B2B solution, called Vodafone Analytics, by adaptIng and migrating the code to work in Google Cloud Platform. This solution has been rolled out across Germany, Greece, Portugal and South Africa, and new countries are being onboarded every day. Vodafone Analytics already has more than 100 customers leveraging it for a variety of use cases—Italian fashion retailer OVS, uses it for its smart retail operation, while global real estate company, JLL, uses it to understand the footfall passing through its properties.
Working together, Vodafone and Google Cloud continue to help a range of organizations, governments, and NGOs navigate through the ongoing pandemic, optimize their operations, and help the greater good, without infringing individuals’ fundamental rights to privacy.
To learn more about Google Cloud and Vodafone, watch our full interview here.
Google Migration and BigQuery Brings PedidosYa Closer towards its Goal of Becoming Data-driven

7240
Of your peers have already read this article.
2:00 Minutes
The most insightful time you'll spend today!
Editor’s note: PedidosYa is the market leader for online food ordering in Latin America, serving 15 markets and over 400 cities. It’s also one of the largest brands within the German multinational company Delivery Hero SE. With over 20 million app downloads, PedidosYa provides the best online delivery experience through 71,000+ online partners, including restaurants, shops, drugstores, and specialized markets.
Having constant access to fresh customer data is a key requirement for PedidosYa to improve and innovate our customer’s experience. Our internal stakeholders also require faster insights to drive agile business decisions. Back in early 2020, PedidosYa’s leadership tasked the data team to make the impossible possible. Our team’s mission was to democratize data by providing universal and secure access while creating a comprehensive information ecosystem across PedidosYa. We also had to achieve this goal while keeping costs under control— even during the migration stage and removing operational bottlenecks.
Challenges with legacy cloud infrastructure
PedidosYa first built its data platform on top of AWS. Our data warehouse ran on Redshift, and our data lake was in S3. We used Presto and Hue as the user interfaces for our data analysts. However, maintaining this infrastructure was a daunting task. Our legacy platform couldn’t keep up with the increasing analytics demands. For example, the data stored on S3 complemented by Presto/Hue required high operational overhead. This was because Presto and our IAM (identity access management) didn’t integrate well in our legacy ecosystem. Managing individual users and mapping IAM roles with groups and Kerberos was operationally time-consuming and costly. Further, sharding access on the S3 files was far too complicated to enable seamless ACLs (access control lists).
There were also challenges with workload management. Our data warehouse had batch data loaded overnight. If one analyst scheduled a query to run during the overnight ETL (extract, transform, load) workload, it would disrupt the current ETL task. This could stop the entire data pipeline. We’d have to wait until data engineers intervened with a manual fix.
It was also difficult to understand whether a query error was due to performance issues or platform resource exhaustion. This lack of clarity affected our data analysts’ ability to autonomously improve querying efficiency. Data team members needed to manually inspect personal queries looking for performance issues. Also, the current architecture was prone to a ‘tragedy of the commons’ situation; it was seen as an unlimited and free resource. As a result, it was impossible to disentangle the infrastructure from different stakeholder teams, as all had very different needs.
The decision to modernize our data warehouse
Given the growing challenges from our legacy platform, our tech team decided to transform our analytics environment with a modern data warehouse. They required the following key criteria from their next data platform:
- Scalability – The ability to grow with elastic infrastructure.
- Cost control – Cost management and transparency. These factors promote efficiency and ownership—both key aspects of data democratization.
- Metadata management – Intuitive data platform focusing on users’ previous SQL knowledge. Plus, being able to enrich the informational ecosystem with metadata, to diminish data gatekeepers.
- Ease of management – The team needed to reduce operational costs with a serverless solution. Data engineers wanted to focus on their key roles rather than acting as database administrators and infrastructure engineers. The team also wanted much higher availability, and to reduce the impact of maintenance windows and vacuum/analysis.
- Data governance and access rights – With a growing employee base with varying data access requirements, the team needed a simple yet comprehensive solution to understand and track user access to data.
Migrating to Google Cloud
After exploring other alternatives, we concluded Google Cloud had an answer to each of our decision drivers. Google Cloud’s serverless, managed, and integrated data platform, coupled with its seamless integration across open-source solutions, was the perfect answer for our organization. In particular, the natural integration with Airflow as a job orchestrator and Kubernetes for flexible on-demand infrastructure was key.
We used Dataflow together with Pub/Sub and Cloud Functions for our data ingestion requirements, which has made our deployment process with Terraform seamless. Because we set up everything in our environment programmatically, operation time has diminished. Google Cloud reduced the deployment process from about 16 hours in our legacy platform to 4 hours. This is partly due to the friendliness of automating the deployment (such as schema check, load test, table creation, build.) process with Terraform, Cloud Functions, Pub/Sub, Dataflow, and BigQuery on GCP. Input messages processed with Dataflow allow us to abstract and plan the schema changes according to the needs of the functional team. For example, schema changes raise an alarm, and then we can modify the raw layer table schema. By doing this, we ensure that backend modifications that we don’t control do not affect upper layers.
A key reason why we picked Google Cloud was because of its advanced cost and workload management coupled with its transparent log analytics. This information gives us a complete view into any query performance issues to make improvements on the fly. Further, we achieved a significant amount of cost savings by consolidating multiple tools to BigQuery.With BigQuery, we’ve been able to reduce our total cost per query by 5x.
This was due to a number of reasons:
- Automating pipeline deployment made it much simpler to maintain the data processing processes.
- Analysts are conscious about what queries they’re running, resulting in running better, more optimized queries.
- Analysts use a Data Studio dashboard to see their queries and all the associated costs. As a result, there’s a lot more transparency for each persona.
With these changes, we can easily manage and assign costs associated with each workload with their own cost centers using specific Google Cloud projects.
Change management is always challenging. However, BigQuery is intuitive and doesn’t have a steep learning curve from Hue/Hive on SQL basics. BigQuery also allowed the team to expand its capabilities and enabled them to properly work with nested structures, avoiding unnecessary joins and improving query efficiency. Additionally, we now use Data Catalog as our unique point of truth for metadata management. This allows our team to break the data access barriers and enable federation of data across the organization. By using Airflow to orchestrate everything, we keep track of every data stream. With this information, each end user can see their regularly used data entities’ status via the dashboard. This also adds transparency to our everyday data processes.
Finally, with Google Cloud’s IAM rules applied across the different products, data sharing and access is close to a noOps experience. We have programmatically implemented access according to roles and level access within the company. This allows certain pre-validated roles to view more sensitive information. These solutions help drive a more automated data governance experience.
Up next: Google Cloud AI/ML
The new stack based on BigQuery has created significant productivity gains. Freed from the burden of operational management, PedidosYa’s data team can now focus on adding value through data tools and products.
- Our data engineers are better equipped to integrate constantly changing transactional and operational data.
- The dataOps team can automate the infrastructure and provide autonomy to the end user.
- Our data quality team can focus on bringing added value to data stakeholders.
- Data scientists and data analytics can spend more time analyzing data and less time asking data gatekeepers for data access.
PedidosYa can now democratize data access with a well-governed architecture. We are still at the beginning of our journey, but we are closer to achieving our vision of building a data-driven organization. Up next: expanding our artificial intelligence and machine learning capabilities.
Tune in to Google Cloud’s Applied ML Summit on June 10th, 2021, or listen on-demand later, to learn how to apply groundbreaking machine learning technology in your projects.
Lending DocAI Shortens Borrowers’ Journey on Roostify

11805
Of your peers have already read this article.
3:00 Minutes
The most insightful time you'll spend today!
The home lending journey entails processing an immense number of documents daily from hundreds of thousands of borrowers. Currently, home lending document processing relies on some outdated digital models and a high dependency on manual labor, resulting in slow processing times and higher origination costs. Scaling a business that sorts through millions of documents daily, while increasing efficacy and accuracy, is no small feat. When it comes to applying for a mortgage loan, consumers expect a digital experience that’s as good as the in-person one. Roostify simplifies the home lending journey for lenders and their customers.
No time to spare: Overcoming document processing challenges with AI
Roostify provides enterprise cloud applications for mortgage and home lenders. In order to empower its customers to deliver a better, more personalized lending experience, they needed to automate and scale their in-house document parsing functionality.
As a key component of its document intelligence service, Roostify is leveraging Google Cloud’s Lending DocAI machine learning platform to automate processing documents required during a home loan application process, such as tax returns or bank statements with multi-language support. This partnership delivers data capture at scale, enabling Roostify customers to automatically identify document types from the uploaded file and to extract relevant entities such as wages, tax liabilities, names, and ID numbers for further processing, and make things move faster in the cumbersome lending process.
Roostify’s solutions leverage Google Cloud’s Lending DocAI, which is built on the recently announced Document AI platform, a unified console for document processing. Customers can easily create and customize all the specialized parsers (e.g., mortgage lending documents and tax returns parsers) on the platform without the need to perform additional data mapping or training. All Google Cloud’s specialized parsers are fine-tuned to achieve industry-leading accuracy, helping customers and partners confidently unlock insights from documents with machine learning. Learn more about the solution from the GA launch blog and the overview video.
Integrating Lending DocAI’s intelligent document processing capabilities into the Roostify platform means more innovation for their customers and tangible results: faster loan processing times, fewer document intake errors, and lower origination costs. Additional support in Google Lending DAI for other languages and more documents like global Know Your Customer (KYC) documents or payroll reports is in the near future.
Full integration of AI solutions
Working together with Roostify’s platform team, we were able to help them solve their document processing challenge through integration of various GCP products such as Lending DocAI (LDAI), Data Loss Prevention (DLP) for redacting sensitive data, BigQuery for data warehousing and analytics, and Firestore for API status. To make it very safe and secure, all data was encrypted end-to-end at Rest and in Transit. LDAI won’t require any training data to process. It is an easy plug and play API.
Here is a sneak peek in the high level deployment architecture for LDAI in Roostify environment:

Here are the steps for processing data:
- Receives document processing request from the client.
- API Function directs requests to the pre-processing service. For Async requests a processing ID is generated and returned to the caller.
- Pre-processing service sends the request for further processing (Long/short PDF conversion), calling other microservices and receives back the responses. Any error in the response received is then sent to the response processing service.
- If the response is synchronous, the pre-processing service directs it to the LDAI Invoker service.
- If the response is asynchronous, the pre-processing service feeds it into the Cloud Pub/Sub service.
- Cloud Pub/Sub service feeds the response back to the LDAI Invoker service.
- LDAI Invoker service routes the request to the Google LDAI API for classification if there are multiple pages in the document.
- Document will be split based on LDAI response and then saved in a GCS bucket for temporary storage.
- LDAI entity interface for single page processing and then LDAI Invoker sends LDAI results to LDAI Response Processing
- If a request is a synchronous request the LDAI Response Processor sends results to the API Function so that it can complete the synchronous call and respond to the rConnect caller.
- If the request is an asynchronous request the LDAI Response Processor will respond to the caller’s webhook and complete the transaction.
- Finally, Data stored in the GCP bucket will be deleted.
All the responses that come from the LDAI API can optionally feed into BigQuery via the Response Processor, after parsing it through Data Loss Prevention (DLP) API to redact the PII/sensitive information. Throughout the processing of both asynchronous and synchronous requests all transactions are logged using Cloud Logging. For asynchronous transactions, the state is maintained throughout the process using Cloud Firestore.
Roostify currently uses this technology to power two different solutions: Roostify Document Intelligence and Roostify Beyond™. Roostify Document Intelligence is a real-time document capture, classification, and data extraction solution built for home lenders. It ingests documents uploaded by borrowers and loan officers, identifies the relevant documents, and extracts and classifies key information. Roostify Document Intelligence is available as a standalone API service to any home lender with any digital lending infrastructure already in place.
Roostify Beyond™ is a robust suite of AI-powered solutions that enables home lenders to create intelligent experiences from start to close. It combines powerful data, insightful analytics, and meaningful visualization to streamline the underwriting process. Roostify Beyond™ is currently available only to Roostify customers as part of an Early Adopter program and will be rolled out to the market later this year.


Through this partnership, Roostify has enabled its customers to adopt a data-first approach to their home lending processes, which will lead to improved user experiences and significantly reduced loan processing times.
Fast track end-to-end deployment with Google Cloud AI Services (AIS)
Google AIS (Professional Services Organization), in collaboration with our partner Quantiphi, helped Roostify deploy this system into production and fast-tracked the development multifold to generate the final business value.
The partnership between Google Cloud and Roostify is just one of the latest examples of how we’re providing AI-powered solutions to solve business problems.
Choose the Right Google Database Service With This Chart

4752
Of your peers have already read this article.
2:30 Minutes
The most insightful time you'll spend today!
A growing number of Indian enterprises are leveraging the Google Cloud to run their database workloads.
This is because Google Cloud offers fully managed, scalable database services to support all applications today and tomorrow.
In fact, Forrester has named Google as a Leader in The Forrester Wave™: Database-as-a-Service, Q2 2019.
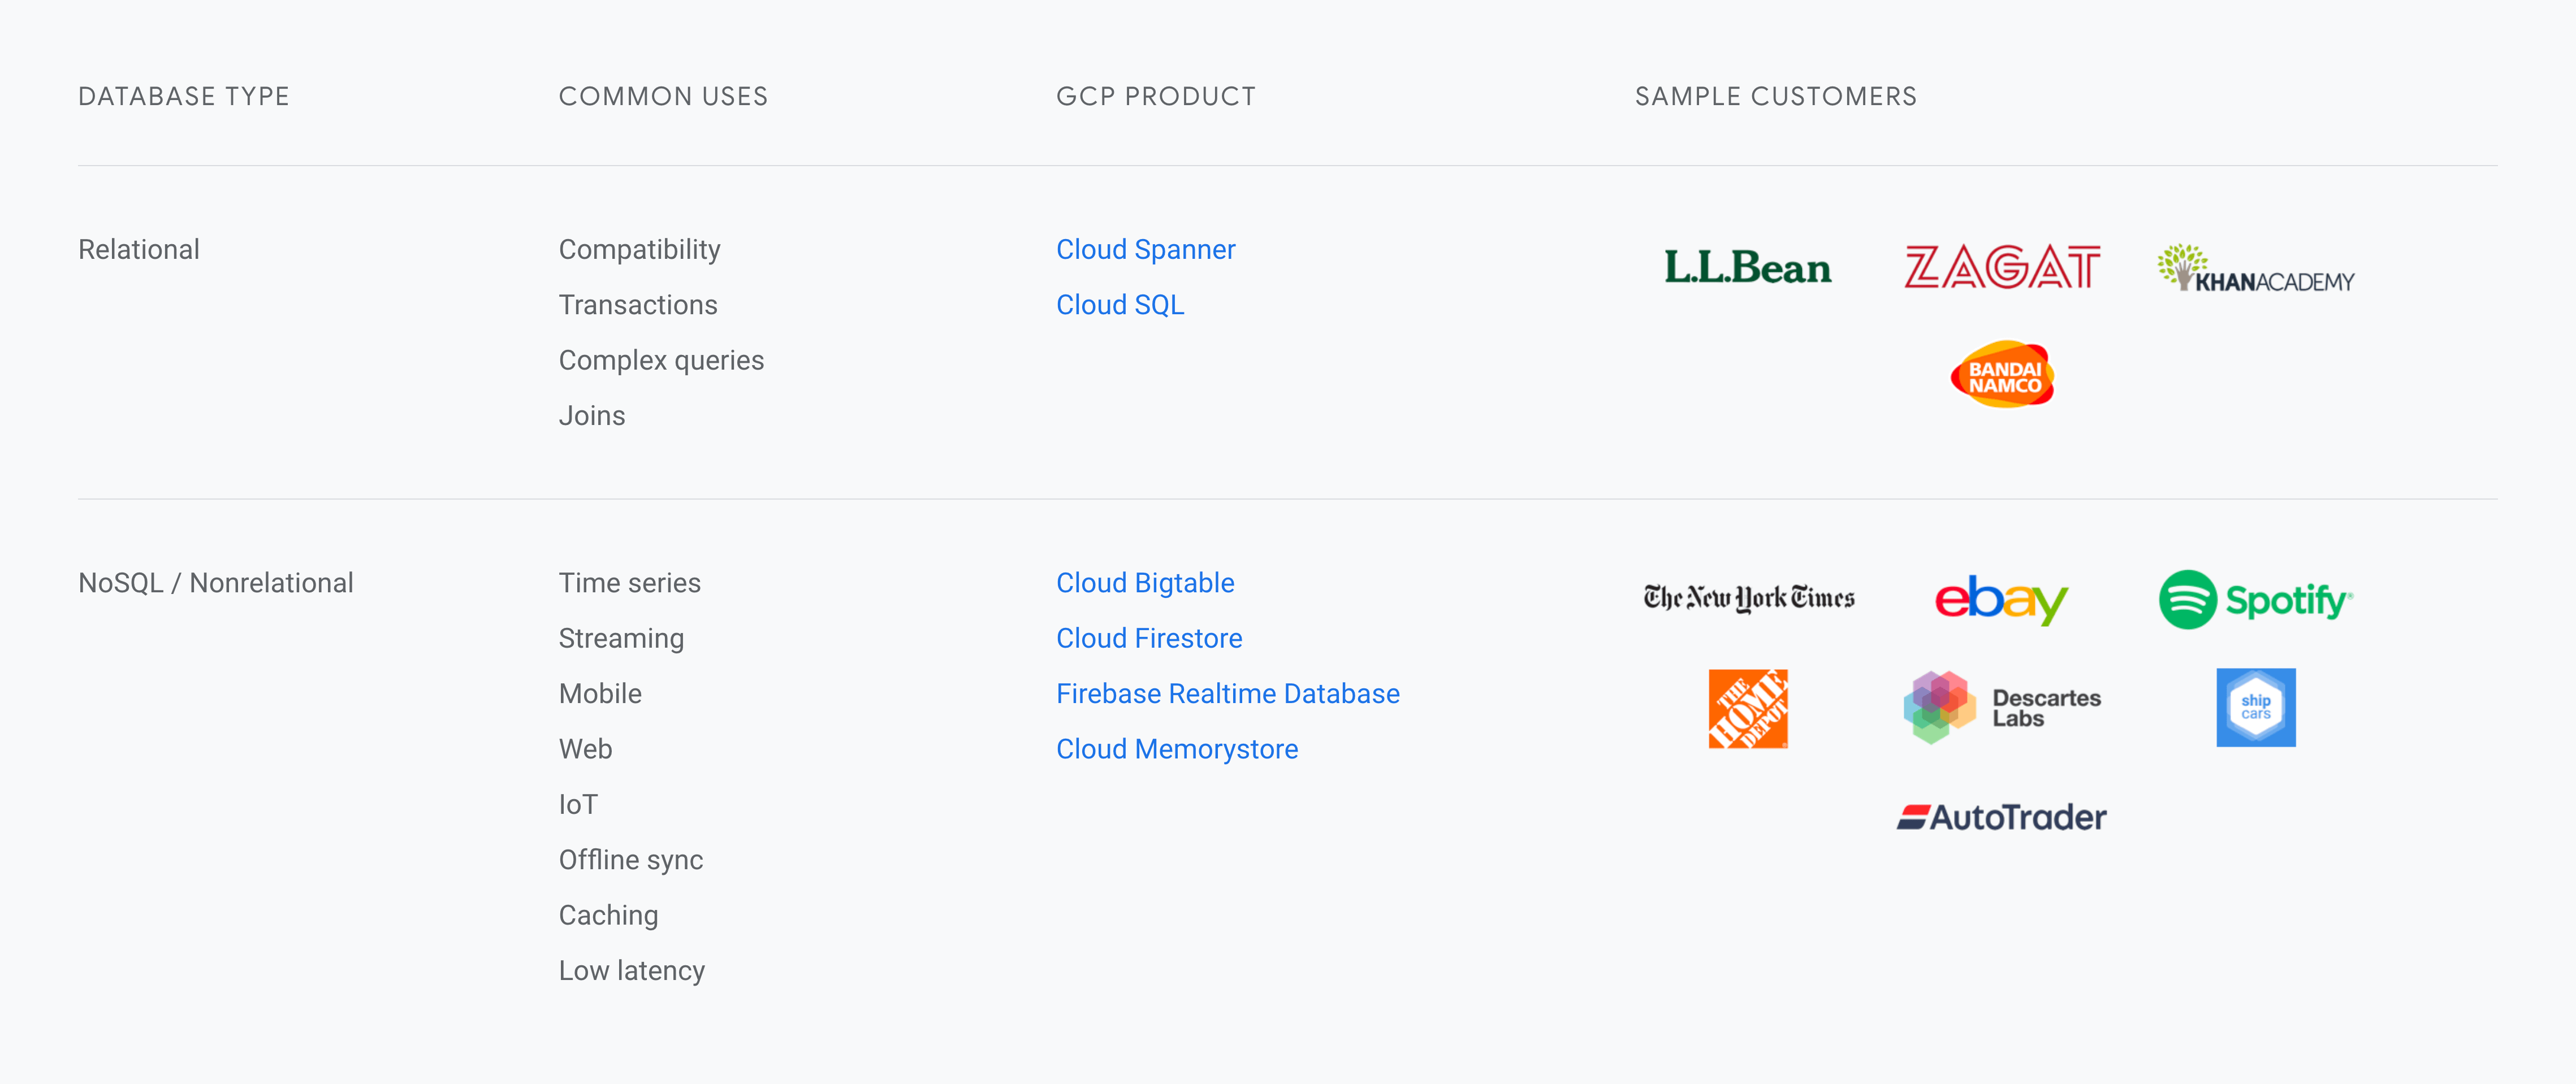
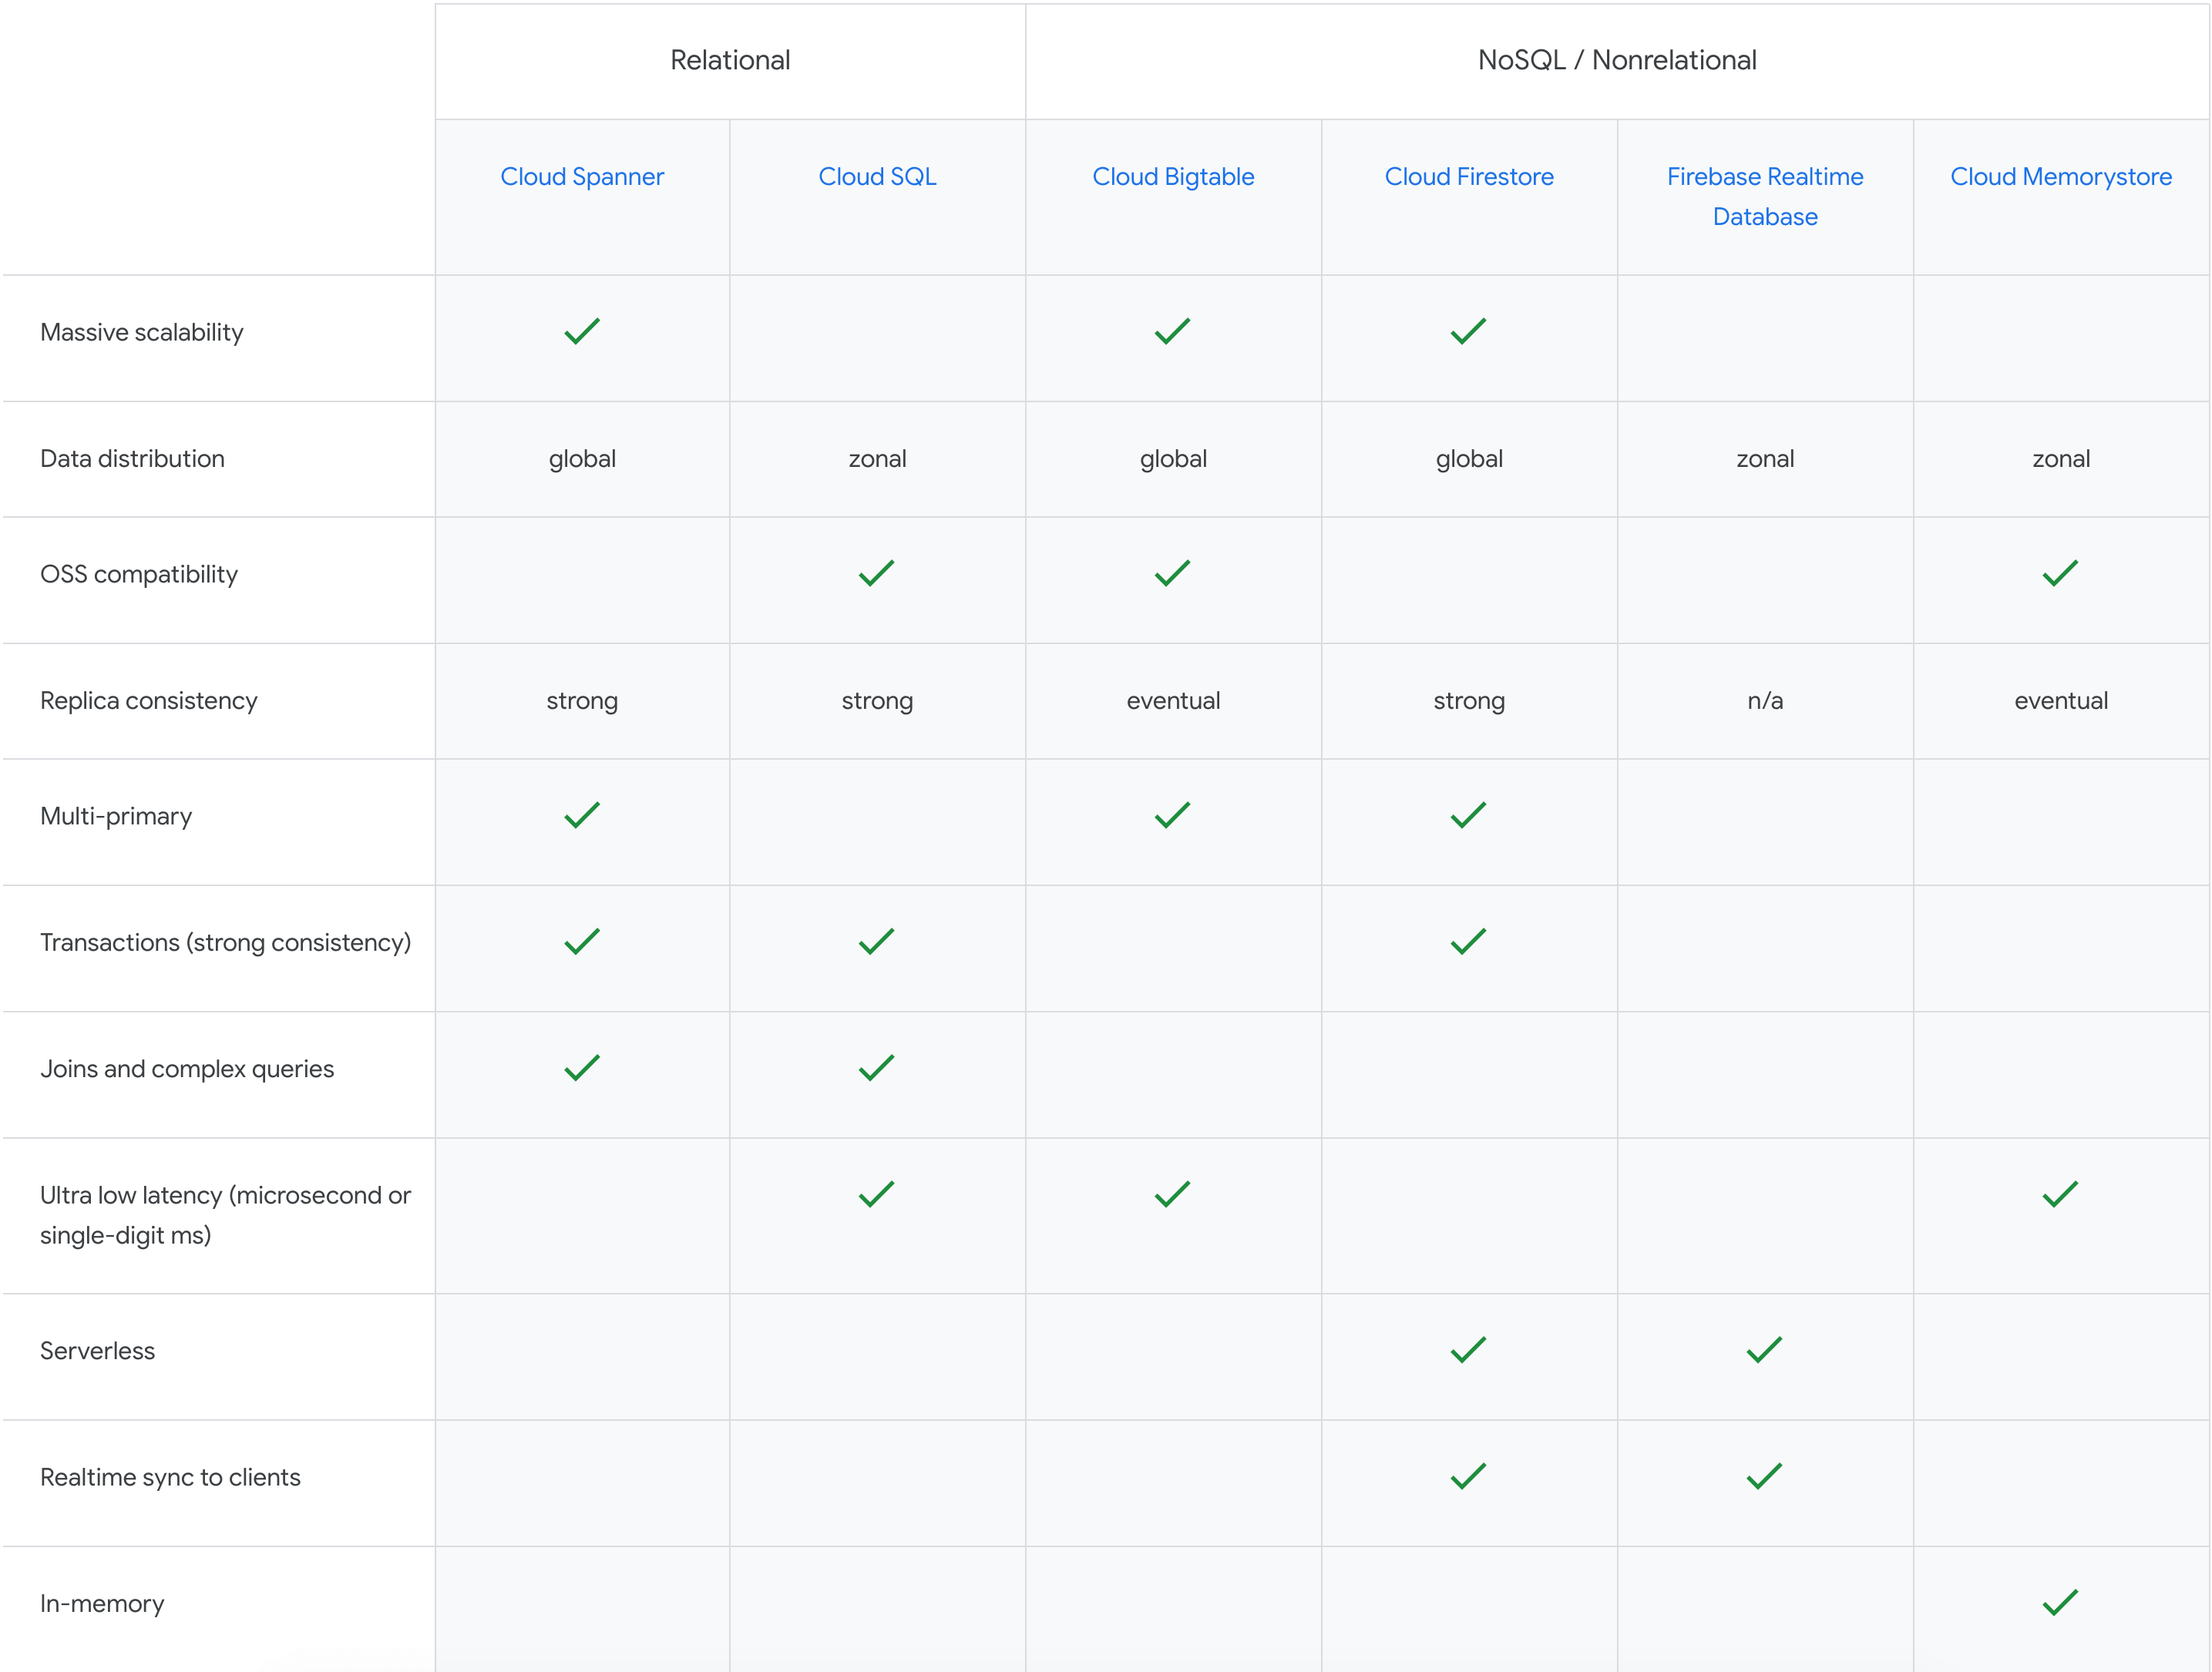
The first question many {$persona}s ask is: Which database type is best for my specific workload or use case? Here are two tables that will help you get that answer. Click on the images.
With Google Cloud database services, you can supercharge your applications, accelerate adoption with broad open-source database compatibility, and do more with your data through integrations with analytics and ML/AI.
More Relevant Stories for Your Company

Ahead of the Curve: 5 Data and AI Trends Set to Shape 2023
How will your organization manage this year's data growth and business requirements? Your actions and strategies involving data and AI will improve or undermine your organization's competitiveness in the months and years to come. Our teams at Google Cloud have an eye on the future as we evolve our strategies




Crux Accelerates Data Operations with Google BigQuery
Being in the constantly evolving and changing data business, Crux Informatics has integrated with Google Cloud and BigQuery to achieve the benefits of a data cloud, including fully managed global scale, load management, high performance, and genuinely good support. Watch this video to learn more about how this partnership will

Benefits of BigQuery for SAP Customers
IDC recently examined the benefits of implementing BigQuery for SAP data. The findings reveal massive improvements to the SAP customers' overall business results due to faster access to data insights, lower data warehouse operation cost, and increased productivity among the data warehouse and development teams. Download the report now!

Data to Business Outcomes with Google’s Data Analytics Design Pattern
Companies today are inundated with vast amounts of data from various sources. This overwhelming amount of data is meant to benefit the company, but often leaves data teams feeling overwhelmed, which can create data bottlenecks and result in a slow time to value. In fact, only twenty seven percent of
