





BigQuery Now Supports Multi-statement Transactions

3760
Of your peers have already read this article.
3:00 Minutes
The most insightful time you'll spend today!
Mercury, the Roman god of commerce, is often depicted carrying a purse, symbolic of business transactions, wearing winged sandals, illustrating his abilities to move at great speeds. Transactions power the world’s business systems today, ranging from millions of packages moving worldwide tracked in real time by logistics companies to global payments from personal loans to securities trading to intergovernmental transactions, keeping goods and services flowing worldwide. Today, we are very pleased to announce the public preview of multi-statement transactions in BigQuery.
BigQuery has long supported single-statement transactions through DML statements such as INSERT, UPDATE, DELETE, MERGE and TRUNCATE, applied to one table per transaction. Multi-statement transactions expand on this scope by supporting multiple SQL statements, including DML, spanning multiple tables in a single transaction. This means that the changes to data across multiple tables associated with all statements in a given transaction are committed atomically (all at once) if successful or all rolled back atomically in the event of a failure. These new multi-statement transaction capabilities now bridge the gap between online transaction processing (OLTP) systems and BigQuery through tighter and faster integration, just as Mercury’s speed enabled him to travel rapidly between the mortal and divine worlds.
Overview
A transaction is a set of tasks carried out against a database or a data warehouse representing a business unit of work. For example, an order expedite action may result in a series of changes to multiple tables, e.g., updating delivery dates on the order, adding new shipment lines on a shipment to create expedited delivery shipments and canceling (updating) prior normal delivery shipment lines. Correspondingly, when a batch job execute an ETL process in a data warehouse, it may perform data wrangling and data cleansing operations by transforming and saving the data in multiple tables. In both of these cases, if a failure occurs, then the entire transaction must be rolled back so that the system of record does not have partial data saved putting the dataset in an inconsistent state.
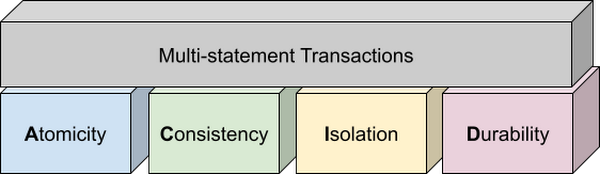
Transactions are known for their atomicity, consistency, isolation, and durability (ACID) properties. Atomicity indicates that all data changes (including metadata changes) are applied or reverted in a single operation, e.g. when a set of rows are added to a table with enrichment and the corresponding set of rows deleted, both operations happen together. Consistency refers to the consistency of data before and after the transaction has completed. When data is added to or updated in a table, the changes to data in tables are consistent with the constraints specified on the table or its columns, e.g. ensuring that the NOT NULL constraint is complied with when data gets added or modified in a table. Isolation indicates that multiple transactions can make changes to the table concurrently as long as the changes don’t conflict with each other, e.g. two transactions loading data into tables from different business units can proceed concurrently. Durability is the last and possibly the most important property of transactions which guarantees that in the event of a failure (after completing the transaction), all the changes committed by the transaction are saved for future transactions or queries.
Isolation level
All transactions in BigQuery including multi-statement transactions support snapshot isolation. At this isolation level, all statements in a transaction see a consistent snapshot of the database, as of the start of the transaction. BigQuery achieves this due to its multi-version property where it maintains the history of mutations to the database for a certain period. Transactions do not see any changes, committed or uncommitted, from other concurrent transactions while the transaction is in progress. BigQuery supports read-your-own-writes, where statements in a transaction can see all the changes applied by prior statements in the same transaction.
Example
Let’s run through an example to demonstrate how BigQuery supports the concept of multi-statement transactions with multiple sets of changes across multiple tables in one operation. In this example, we will set up this demo by creating 10 tables each with 100 partitions
Language: SQL
DECLARE num_tables DEFAULT 10;DECLARE x INT64 DEFAULT 0;# replace "demo" with your preferred dataset nameDECLARE ds STRING default "`00jathreya`";DECLARE prefix STRING DEFAULT "mst_demo";DECLARE table_name STRING;DECLARE pre_table_name STRING;/*Sets up 10 tables, with schema (partition_id:integer,value:timestamp).Each table has 100 partitions, with partition key 0, 10, 20, ..., 990.*/SET x = 0;WHILE x < num_tables DOSET table_name = format("%s.%s_%d", ds, prefix, x);EXECUTE IMMEDIATE format("""DROP TABLE IF EXISTS %s""", table_name);EXECUTE IMMEDIATE format("""CREATE OR REPLACE TABLE %s (partition_id INT64, value TIMESTAMP)PARTITION BY RANGE_BUCKET(partition_id, GENERATE_ARRAY(0, 1000, 10))AS SELECT partition_id, CURRENT_TIMESTAMP() AS value FROM UNNEST(GENERATE_ARRAY(0, 990, 10)) AS partition_id""", table_name);SET x = x + 1;END WHILE;# Verify the partitioned tables created and the timestampexecute immediate format("""select table_schema, table_name, count(partition_id), sum(total_rows), max(last_modified_time) from %s.INFORMATION_SCHEMA.PARTITIONSwhere starts_with(table_name,'%s')group by table_schema, table_name""", ds, prefix);# Verify data in table 9 based on the timestampEXECUTE IMMEDIATE format("""SELECT * FROM %s ORDER BY partition_id""", table_name);
Next, we will show how the new COMMIT and ROLLBACK commands in BigQuery allow you to save or reverse the changes in a transaction spanning multiple tables.
Language: SQL
DECLARE num_tables DEFAULT 10;DECLARE x INT64 DEFAULT 0;# Replace `mydataset` with your preferred dataset nameDECLARE ds STRING DEFAULT "`mydataset`";DECLARE prefix STRING DEFAULT "mst_demo";DECLARE table_name STRING;DECLARE pre_table_name STRING;/*Steps of the transaction:1. For table 0, updates the timestamp to CURRENT_TIMESTAMP.2. FOR table 1 to 9, merge table x using data from table x-1. All MERGE shouldsee the updated data in table x-1, so as a result the change in table 0 should bepropagated all the way to table 9.3. A total of 1000 partition changes on 10 tables.*/BEGIN TRANSACTION;SET x = 0;WHILE x < num_tables DOSET table_name = format("%s.%s_%d", ds, prefix, x);IF x = 0 THENEXECUTE IMMEDIATE format("""UPDATE %s SET value = CURRENT_TIMESTAMP WHERE true""", table_name);ELSESET pre_table_name = format("%s.%s_%d", ds, prefix, x-1);EXECUTE IMMEDIATE format("""MERGE %s t2 USING %s t1 ON t2.partition_id = t1.partition_idWHEN MATCHED THEN UPDATE SET value = t1.value""", table_name, pre_table_name);END IF;SET x = x + 1;END WHILE;# Verify data in table 9 inside transaction shows recently updated dataSET table_name = format("%s.%s_%d", ds, prefix, num_tables-1);EXECUTE IMMEDIATE format("""SELECT * FROM %s ORDER BY partition_id""", table_name);IF x = 9 THENCOMMIT TRANSACTION;ELSEROLLBACK TRANSACTION;END IF;# Verify data in table 9 outside transaction shows timestamp of original dataEXECUTE IMMEDIATE format("""SELECT * FROM %s ORDER BY partition_id""", table_name);
Monitoring and Management
Unlike single-statement transactions which map to a single DML command, multi-statement transactions are complex spanning multiple DML operations across multiple tables. To monitor these complex jobs, the BigQuery JOBS INFORMATION_SCHEMA views have been expanded to add a new column, TRANSACTION_ID, which contains a unique identifier for each transaction in BigQuery. You can query transactions that are in progress or the ones that have completed by querying these views.
Language: SQL
#Returns the list of transactions running under a parent job ID .;SELECTDISTINCT transaction_idFROM `region-us`.INFORMATION_SCHEMA.JOBS_BY_PROJECTWHERE parent_job_id = "job_id" AND state = "RUNNING";# Returns the active transactions and parent job id that are running and affect a named table.;WITHrunning_transactions AS (SELECT DISTINCT transaction_idFROM `region-us`.INFORMATION_SCHEMA.JOBS_BY_PROJECTWHERE state = "RUNNING")SELECTtransaction_id, parent_job_id, queryFROM `region-us`.INFORMATION_SCHEMA.JOBS_BY_PROJECT, running_transactionsWHERE destination_table = "mytable"AND transaction_id = running_transactions.transaction_id;# Returns all successfully committed transactionsSELECTtransaction_id, parent_job_id, queryFROM `region-us`.INFORMATION_SCHEMA.JOBS_BY_PROJECTWHERE statement_type = "COMMIT_TRANSACTION" AND error_result IS NULL;# Returns all rolled back transactionsSELECTtransaction_id, parent_job_id, queryFROM `region-us`.INFORMATION_SCHEMA.JOBS_BY_PROJECTWHERE statement_type = "ROLLBACK_TRANSACTION" AND error_result IS NULL;
To terminate a transaction, you will need to terminate the parent job under which the transaction is running by passing the parent job ID of the script containing the transaction to the BQ.JOBS.CANCEL system procedure.
Conclusion
As enterprises accelerate towards more real time insight-driven decisions, multi-statement transactions are a key enabler towards bringing transaction data into analytical data warehouses, such as BigQuery. With strong ACID properties, full transaction support for commit and rollback, and rich monitoring and management APIs built on proven transaction processing backbone, we are very pleased to help our BigQuery customers unlock the value of transactions through these new capabilities.
Google Data Cloud: The Catalyst for Modern App Development and Innovation

1382
Of your peers have already read this article.
3:30 Minutes
The most insightful time you'll spend today!
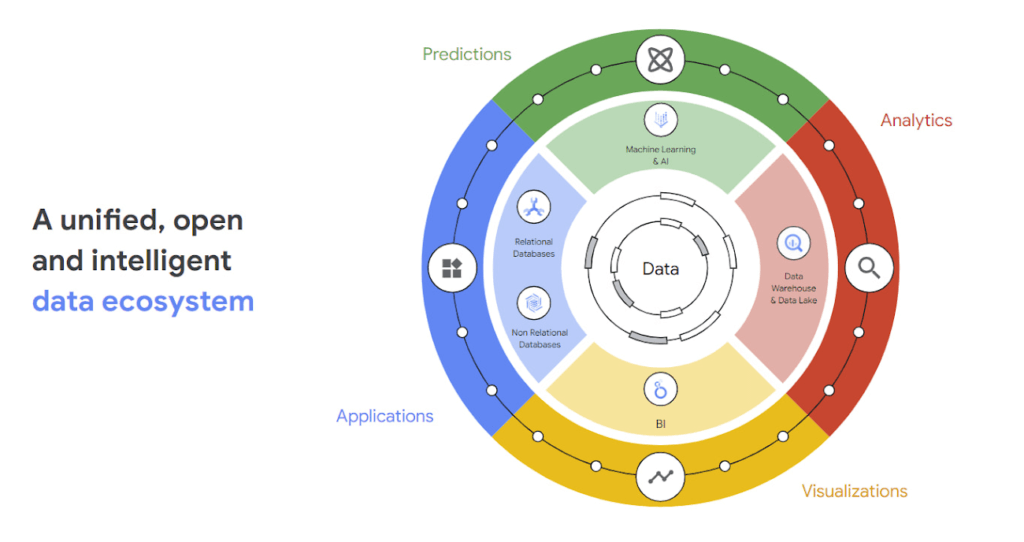
97 zettabytes was the estimated volume of data generated worldwide in 20221. This sort of explosion in data volume is happening in every enterprise. Now imagine being able to access all this data you own from anywhere, at any time, analyze it, and leverage its insights to innovate your products and services? One of the biggest barriers to fulfilling this vision is the complexity inherent in dealing with data trapped across silos in an enterprise. Google Data Cloud offers a unified, open, and intelligent platform for innovation, allowing you to integrate your data on a common architectural platform. Across industries, organizations are able to reimagine their data possibilities in entirely new ways and quickly build applications that delight their customers.
Siloed data: The barrier to speed and innovation
Digital technologies ranging from transaction processing to analytics and AI/ML use data to help enterprises understand their customers better. And the pace of innovation has naturally accelerated as organizations learn, adapt, and race to build the next generation of applications and services to compete for customers and meet their needs. At Next 2022, we made a prediction that the barriers between transactional and analytical workloads will mostly disappear.
Traditionally, data architectures have separated transactional and analytical systems—and that’s for good reason. Transactional databases are optimized for fast reads and writes, and analytical databases are optimized for analyzing and aggregating large data sets. This has siloed enterprise data systems, leaving many IT teams struggling to piece together solutions. The result has been time consuming, expensive, and complicated fixes to support intelligent, data-driven applications.
But, with the introduction of new technologies, a more time-efficient and cost-effective approach is possible. Customers now expect to see personalized recommendations and tailored experiences from their applications. With hybrid systems that support both transactional and analytical processing on the same data, without impacting performance, these systems now work together to generate timely, actionable insights that can be used to create better experiences and accelerate business outcomes.
According to a 2022 research paper from IDC, unifying data across silos via a data cloud is the foundational capability enterprises need to gain new insights on rapidly changing conditions and to enable operational intelligence. The modern data cloud provides unified, connected, scalable, secure, extensible, and open data, analytics, and AI/ML services. In this platform, everything is connected to everything else.
Why reducing data barriers delivers more value
The primary benefit of a unified data cloud is that it provides an intuitive and timely way to represent data and allows easy access to related data points. By unifying their data, enterprises are able to:
- Ingest data faster – for operational intelligence
- Unify data across silos – for new insights
- Share data with partners – for collaborative problem solving
- Change forecasting models – to understand and prepare for shifting markets
- Iterate with decision-making scenarios – to ensure agile responses
- Train models on historical data – to build smarter applications
As generative AI applications akin to Bard, an early experiment by Google, become available in the workplace, it will be more important than ever for organizations to have a unified data landscape to holistically train and validate their proprietary large language models.
With these benefits enterprises can accelerate their digital transformation in order to thrive in our increasingly complex digital environment. A survey of more than 800 IT leaders indicated that using a data cloud enabled them to significantly improve employee productivity, operational efficiency, innovation, and customer experience, among others.
Build modern apps with a unified and integrated data cloud
Google Cloud technologies and capabilities reduce the friction between transactional and analytical workloads and make it easier for developers to build applications, and to glean real-time insights. Here are a few examples.
- AlloyDB for PostgreSQL, a fully managed PostgreSQL-compatible database, and AlloyDB Omni, the recently launched downloadable edition of AlloyDB, can analyze transactional data in real time. AlloyDB is more than four times faster for transactional workloads and up to a 100 times faster for analytical queries compared to standard PostgreSQL, according to our performance tests. This kind of performance makes AlloyDB the ideal database for hybrid transactional and analytical processing (HTAP) workloads.
- Datastream for BigQuery, a serverless change data capture and replication service, provides simple and easy real time data replication from transactional databases like AlloyDB, PostgreSQL, MySQL and Oracle directly into BigQuery, Google Cloud’s enterprise data warehouse.
- And, query federation with Cloud Spanner, Cloud SQL, and Cloud Bigtable, make data available right from the BigQuery console allowing customers to analyze data in real-time in transactional databases.
Speed up deployments and lower costs
By reducing data barriers, we’re taking a fundamentally different approach that allows organizations to be more innovative, efficient, and customer-focused by providing:
- Built-in industry leading AI and ML that helps organizations not only build improved insights, but also automate core business processes and enable deep ML-driven product innovation.
- Best-in-class flexibility. Integration with open source standards and APIs ensures portability and extensibility to prevent lock-in. Plus, choice of deployment options means easy interoperability with existing solutions and investments.
- The most unified data platform with the ability to manage every stage of the data lifecycle, from running operational databases to managing analytics applications across data warehouses and lakes to rich data-driven experiences.
- Fully managed database services that free up DBA/DevOps time to focus on high-value work that is more profitable to the business. Organizations that switch from self-managed databases eliminate manual work, realize significant cost savings, reduce risk from security breaches and downtime and increase productivity and innovation. In an IDC survey, for example, Cloud SQL customers achieve an average three-year ROI of 246% because of the value and efficiencies this fully managed service delivers.
Google Data Cloud improves the efficiency and productivity of your teams, resulting in increased innovation across your organization. This is the unified, open approach to data-driven transformation bringing unmatched speed, scale, security, and with AI built in.
In case you missed it: Check out our Data Cloud and AI Summit that happened on March 29th, to learn more about the latest innovations across databases, data analytics, BI and AI. In addition, learn more about the value of managed database services like Cloud SQL in this IDC study.
Held Back by Database Scalability, This Financial Services Company Switches to Google Cloud and Cloud Spanner

11567
Of your peers have already read this article.
4:30 Minutes
The most insightful time you'll spend today!
Azimut Group operates an international network of companies handling investment and asset management, mutual funds, hedge funds, and insurance. Founded in Milan, Italy in 1988, Azimut Group today has branches in fifteen countries, including Brazil, China, and the USA.
“We have subsidiaries and manage funds all over the world,” explains Simone Bertolotti, IT Manager at Azimut Holding S.p.a. “That means that any technology that we put in place has to cover needs from many different countries.”
“When complicated analysis has to be executed, we have to increase our table space in a couple of minutes so that the AI can drill down into the data and deliver the information we need.”
—Simone Bertolotti, IT Manager, Azimut Holding S.p.a.
Azimut manages its funds with investment advisors who use information sourced from Bloomberg, Reuters and others. “They use a huge amount of data,” says Simone. “They work with spreadsheets, algorithms, formulae and they analyse data in minutes.” In finance, every second is crucial, which is why Azimut decided to develop a risk management dashboard that can process information even more quickly, then distribute it worldwide.
“When an advisor manages data, that data is used to make immediate decisions on funds, capital movements or whether to sell stock,” says Simone. “They have to be ready to make recommendations for any amount of data that comes to them. For our dashboard, that means that when additional information arrives or complicated analysis has to be executed, we have to increase our table space in a couple of minutes so that the AI can drill down into the data and deliver the information we need.”
Generating insights at speed
Investors and investment managers make decisions based on the most accurate, up-to-date information possible. For Azimut Group, information sourced through financial data vendors such as Bloomberg and Reuters provided only part of the data that the group required.
“We looked to collect information from a range of different providers,” explains Simone, “then analyse it to develop a predictive algorithm that could work faster than an advisor stationed at the terminal. We set ourselves the challenge to try to manipulate that data to add new insights into our matrix, so that every one of our branches across the world can see risk information about the funds in real-time.”
“We compared Google Cloud Platform’s performance with our previous cloud provider, and saw huge benefits of switching to Google. For me, the key performance issue is scaling. With Google Cloud Platform I know that I can increase and decrease my infrastructure quickly, when I need it.
—Simone Bertolotti, IT Manager, Azimut Holding S.p.a.
The first cloud provider Azimut used to build its system struggled to scale quickly to meet different kinds of data challenges. “If we wanted to add more cores, that was fine,” says Simone. “But the previous cloud provider made it complicated to raise the amount of space in a database infrastructure and scale up to demand. Scaling up for more in-depth analysis would take a day, and our need was immediate.”
That’s why Azimut switched one year ago to Google Cloud Platform to run the 150 VMs on its risk analysis platform. “We compared Google Cloud Platform’s performance with our previous cloud provider, and saw huge benefits of switching to Google. For me, the key performance issue is scaling,” says Simone. “With Google Cloud Platform I know that I can increase and decrease my infrastructure quickly, when I need it. Instead of waiting a day to scale up infrastructure, we can request and add space to our database in a couple of minutes.”
The infrastructure of Azimut’s solution handles around 800TB of data per month, and Google’s global network of servers and high-speed connections ensure that it gets to where it’s most needed by the most direct route. Impressed by the speed, security and availability of Google Cloud Platform, Azimut has moved its intranet on to Google Cloud Platform, too, eliminating the need for staff to login with VPNs.
“Instead of waiting a day to scale up infrastructure, we can request and add space to our database in a couple of minutes.”
—Simone Bertolotti, IT Manager, Azimut Holding S.p.a.
Driving ahead with Noovle
For Azimut, migrating the risk management dashboard is the latest of many Google product collaborations with cloud consultancy Noovle. “Everything started five years ago,” says Simone, “when Noovle assisted us in migrating to Gmail from our on-premise email solution. From G Suite to Google Cloud Platform, we’ve had a great relationship. Noovle provides consultancy services, support for mobility, and external advisors who work on our premises, such as when they trained us how to broadcast our meetings on Google Hangouts. As an independent company, we know we can trust them for transparent advice. All they care about is the best way to get a job done and to help us reach our goals.”
New app, new customers
In a business case comparison, Google Cloud Platform cost Azimut 35% less to run than the previous cloud provider. Now the group is building a major new mobile application on Google App Engine to be released in 2018.
“The new mobile application will allow customers to trade directly, without human advisors, by proposing different investment solutions depending on targets the customers set,” says Simone. “So if a customer aims to make money with investments, they enter their relevant personal information and we carry out the necessary regulatory checks and suggest what they could buy. The entire project will be based on Google Cloud Platform, so customers can control their investments through the app while we manage the fund, using Google Cloud Spanner on the backend.”
Real-time analytics for on-time delivery: Mercado Libre

3043
Of your peers have already read this article.
1:30 Minutes
The most insightful time you'll spend today!
Iteration and innovation fuel the data-driven culture at Mercado Libre. In our first post, we presented our continuous intelligence approach, which leverages BigQuery and Looker to create a data ecosystem on which people can build their own models and processes.
Using this framework, the Shipping Operations team was able to build a new solution that provided near real-time data monitoring and analytics for our transportation network and enabled data analysts to create, embed, and deliver valuable insights.
The challenge
Shipping operations are critical to success in e-commerce, and Mercado Libre’s process is very complex since our organization spans multiple countries, time zones, and warehouses, and includes both internal and external carriers. In addition, the onset of the pandemic drove exponential order growth, which increased pressure on our shipping team to deliver more while still meeting the 48-hour delivery timelines that customers have come to expect.
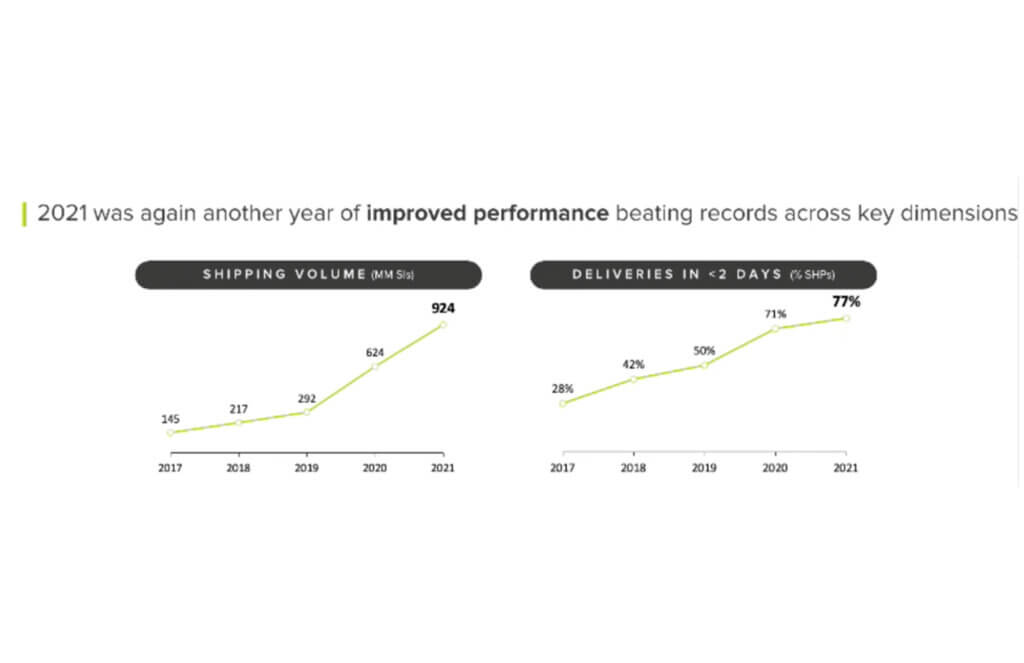
This increased demand led to the expansion of fulfillment centers and cross-docking centers, doubling and tripling the nodes of our network (a.k.a. meli-net) in the leading countries where we operate. We also now have the largest electric vehicle fleet in Latin America and operate domestic flights in Brazil and Mexico.
We previously worked with data coming in from multiple sources, and we used APIs to bring it into different platforms based on the use case. For real-time data consumption and monitoring, we had Kibana, while historical data for business analysis was piped into Teradata. Consequently, the real-time Kibana data and the historical data in Teradata were growing in parallel, without working together. On one hand, we had the operations team using real-time streams of data for monitoring, while on the other, business analysts were building visualizations based on the historical data in our data warehouse.
This approach resulted in a number of problems:
- The operations team lacked visibility and required support to build their visualizations. Specialized BI teams became bottlenecks.
- Maintenance was needed, which led to system downtime.
- Parallel solutions were ungoverned (the ops team used an Elastic database to store and work with attributes and metrics) with unfriendly backups and data bounded for a period of time.
- We couldn’t relate data entities as we do with SQL.
Striking a balance: real-time vs. historical data
We needed to be able to seamlessly navigate between real-time and historical data. To address this need, we decided to migrate the data to BigQuery, knowing we would leverage many use cases at once with Google Cloud.
Once we had our real-time and historical data consolidated within BigQuery, we had the power to make choices about which datasets needed to be made available in near real-time and which didn’t. We evaluated the use of analytics with different time windows tables from the data streams instead of the real-time logs visualization approach. This enabled us to serve near real-time and historical data utilizing the same origin.
We then modeled the data using LookML, Looker’s reusable modeling language based on SQL, and consumed the data through Looker dashboards and Explores. Because Looker queries the database directly, our reporting mirrored the near real-time data stored in BigQuery. Finally, in order to balance near real-time availability with overall consumption costs, we analyzed key use cases on a case-by-case basis to optimize our resource usage.
This solution prevented us from having to maintain two different tools and featured a more scalable architecture. Thanks to the services of GCP and the use of BigQuery, we were able to design a robust data architecture that ensures the availability of data in near real-time.
Streaming data with our own Data Producer Model: from APIs to BigQuery
To make new data streams available, we designed a process which we call the “Data Producer Model” (“Modelo Productor de Datos” or MPD) where functional business teams can serve as data creators in charge of generating data streams and publishing them as related information assets we call “data domains”. Using this process, the new data comes in via JSON format, which is streamed into BigQuery. We then use a 3-tiered transformation process to convert that JSON into a partitioned, columnar structure.
To make these new data sets available in Looker for exploration, we developed a Java utility app to accelerate the development of LookML and make it even more fun for developers to create pipelines.
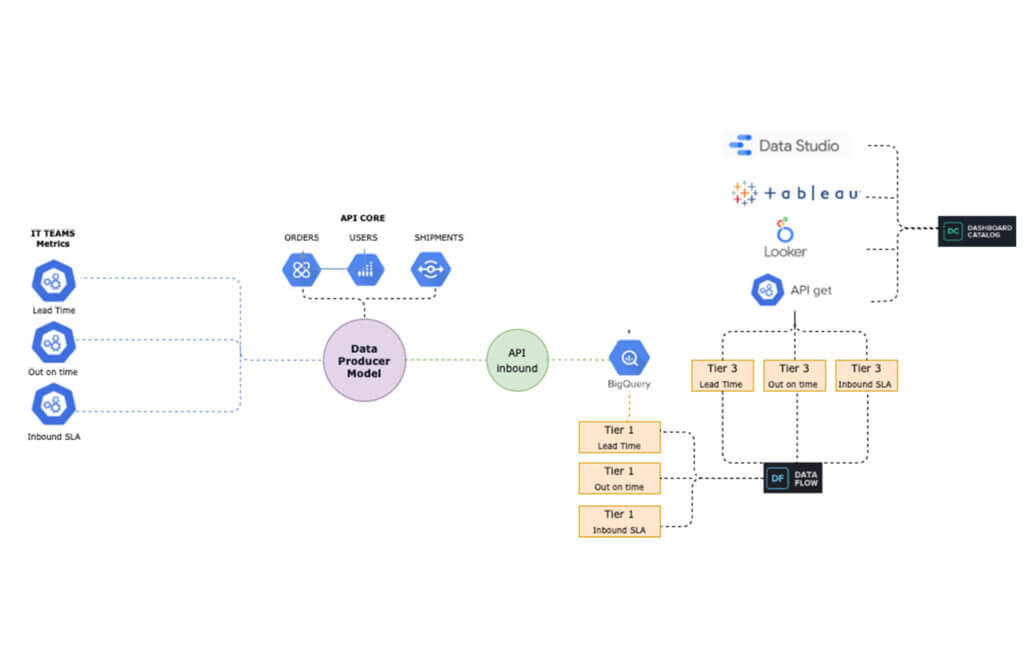
The complete “MPD” solution results in different entities being created in BigQuery with minimal manual intervention. Using this process, we have been able to automate the following:
- The creation of partitioned, columnar tables in BigQuery from JSON samples
- The creation of authorized views in a different GCP BigQuery project (for governance purposes)
- LookML code generation for Looker views
- Job orchestration in a chosen time window
By using this code-based incremental approach with LookML, we were able to incorporate techniques that are traditionally used in DevOps for software development, such as using Lams to validate LookML syntax as a part of the CI process and testing all our definitions and data with Spectacles before they hit production. Applying these principles to our data and business intelligence pipelines has strengthened our continuous intelligence ecosystem. Enabling exploration of that data through Looker and empowering users to easily build their own visualizations has helped us to better engage with stakeholders across the business.
The new data architecture and processes that we have implemented have enabled us to keep up with the growing and ever-changing data from our continuously expanding shipping operations. We have been able to empower a variety of teams to seamlessly develop solutions and manage third party technologies, ensuring that we always know what’s happening – and more critically – enabling us to react in a timely manner when needed.
Outcomes from improving shipping operations:
Today, data is being used to support decision-making in key processes, including:
- Carrier Capacity Optimization
- Outbound Monitoring
- Air Capacity Monitoring
This data-driven approach helps us to better serve you -and everyone- who expects to receive their packages on-time according to our delivery promise. We can proudly say that we have improved both our coverage and speed, delivering 79% of our shipments in less than 48 hours in the first quarter of 2022.
Here is a sneak peek into the data assets that we use to support our day-to-day decision making:
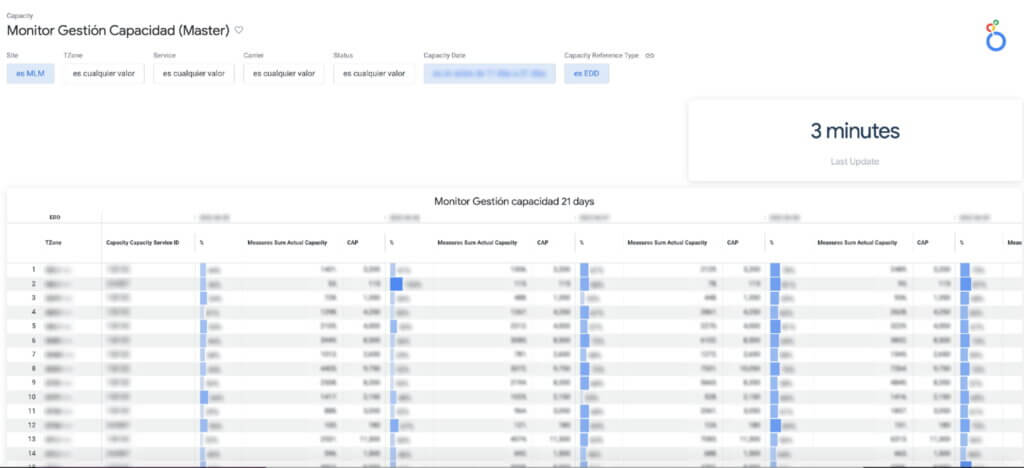
a. Carrier Capacity: Allows us to monitor the percentage of network capacity utilized across every delivery zone and identify where delivery targets are at risk in almost real time.
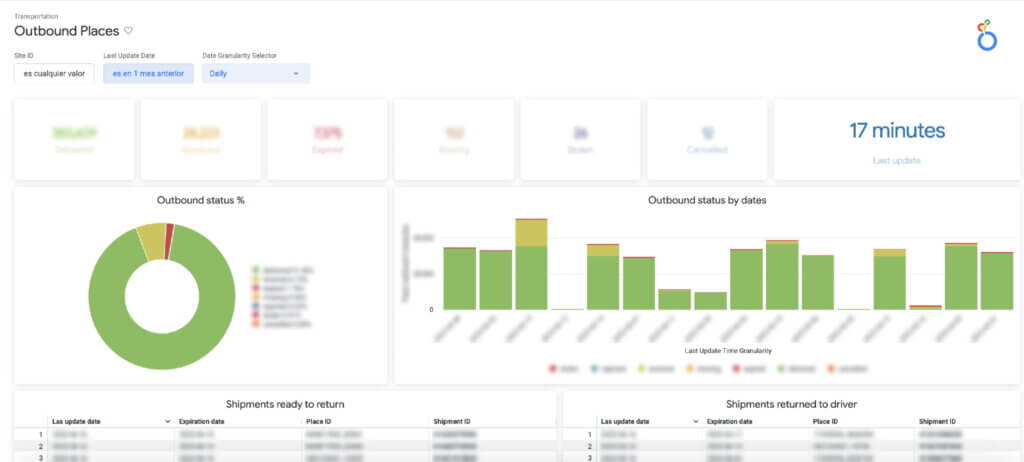
b. Outbound Places Monitoring: Consolidates the number of shipments that are destined for a place (the physical points where a seller picks up a package), enabling us to both identify places with lower delivery efficiency and drill into the status of individual shipments.
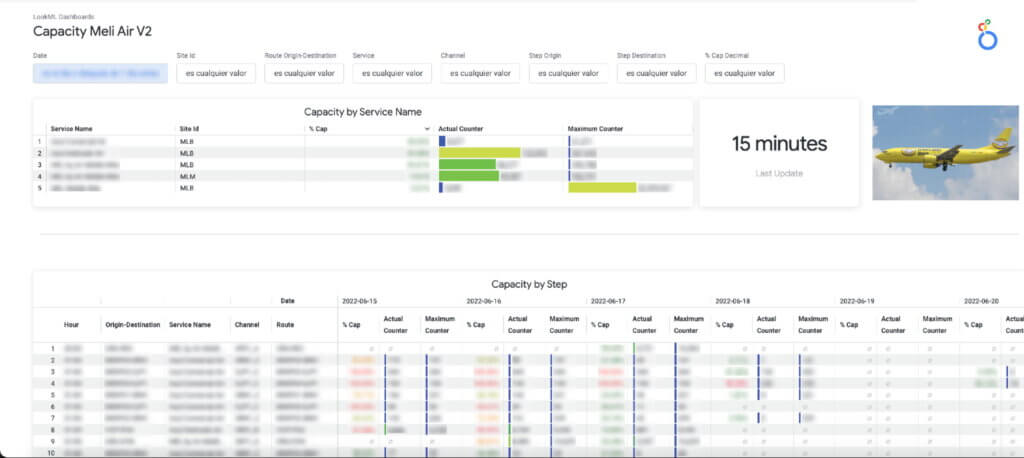
c. The Air Capacity Monitoring: Provides capacity usage monitoring for our aircrafts running each of our shipping routes.
Costs into the equation
The combination of BigQuery and Looker also showed us something we hadn’t seen before: overall cost and performance of the system. Traditionally, developers maintained focus on metrics like reliability and uptime without factoring in associated costs.
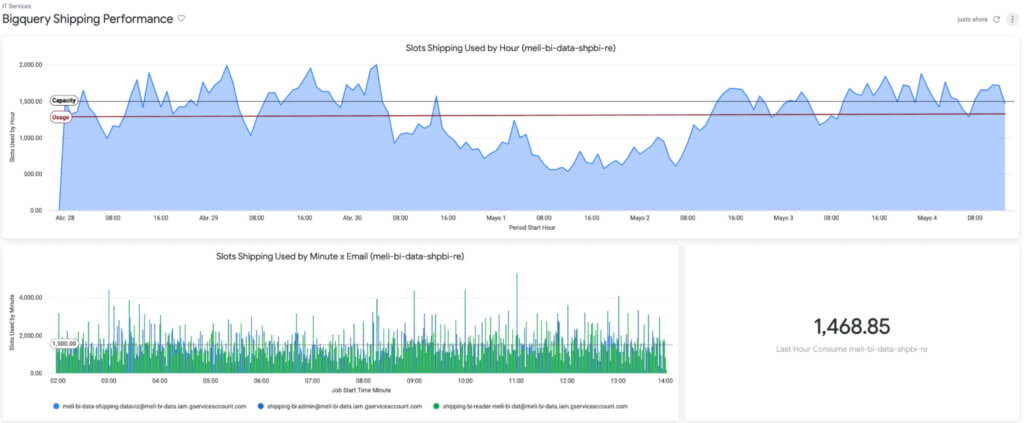
By using BigQuery’s information schema, Looker Blocks, and the export of BigQuery logs, we have been able to closely track data consumption, quickly detect underperforming SQL and errors, and make adjustments to optimize our usage and spend.
Based on that, we know the Looker Shipping Ops dashboards generate a concurrency of more than 150 queries, which we have been able to optimize by taking advantage of BigQuery and Looker caching policies.
The challenges ahead
Using BigQuery and Looker has enabled us to solve numerous data availability and data governance challenges: single point access to near real-time data and to historical information, self-service analytics & exploration for operations and stakeholders across different countries & time zones, horizontal scalability (with no maintenance), and guaranteed reliability and uptime (while accounting for costs), among other benefits.
However, in addition to having the right technology stack and processes in place, we also need to enable every user to make decisions using this governed, trusted data. To continue achieving our business goals, we need to democratize access not just to the data but also to the definitions that give the data meaning. This means incorporating our data definitions with our internal data catalog and serving our LookML definitions to other data visualizations tools like Data Studio, Tableau or even Google Sheets and Slides so that users can work with this data through whatever tools they feel most comfortable using.
If you would like a more indepth look at how we made new data streams available from a process we designed called the “Data Producer Model” (“Modelo Productor de Datos” or MPD) register to attend our webcast on August 31.
While learning and adopting new technologies can be a challenge, we are excited to tackle this next phase, and we expect our users will be too, thanks to a curious and entrepreneurial culture. Are our teams ready to face new changes? Are they able to roll out new processes and designs? We’ll go deep on this in our next post.
Meesho’s Zero Downtime Success: Cloud CDN Migration Made Easy

1985
Of your peers have already read this article.
4:30 Minutes
The most insightful time you'll spend today!
Meesho is an Indian online marketplace that serves millions of customers every day. Recently, the company decided to adopt a multi-cloud strategy, leveraging Google Cloud’s scalable and reliable infrastructure to drive operational efficiency, modernize and scale for growth. To do so, they needed to migrate billions of static files and images to Google Cloud, to render the static content that serves their web and mobile applications. But with over a petabyte of data in their object storage system, and 10 billion requests per day, Meesho needed to perform this gigantic migration gradually, with zero downtime — a huge challenge.
In this blog post, we look at how Meesho did this using Storage Transfer Service, Cloud Storage and Cloud CDN. We also look at how it saved on storage capacity by resizing static images as needed on the fly, using Cloud Run.
CDN migration requirements
Migrating from one cloud to another isn’t easy. To pull it off, Meesho identified the following requirements:
- Petabyte-scale data transfer: Meesho needed to migrate billions of image files from their existing object storage server to Cloud Storage.
- Dynamic image resizing: To save on storage costs, Meesho wanted the ability to dynamically resize the images based on the end user platform and store the smaller images in the Cloud CDN cache.
- High-throughput data transfer: To support consumer demand, Meesho needed images to be served at a throughput of thousands of requests per second.
- Zero downtime: Since any downtime involves potential loss of revenue, Meesho needed to perform the migration without taking any systems offline.
Migration architecture
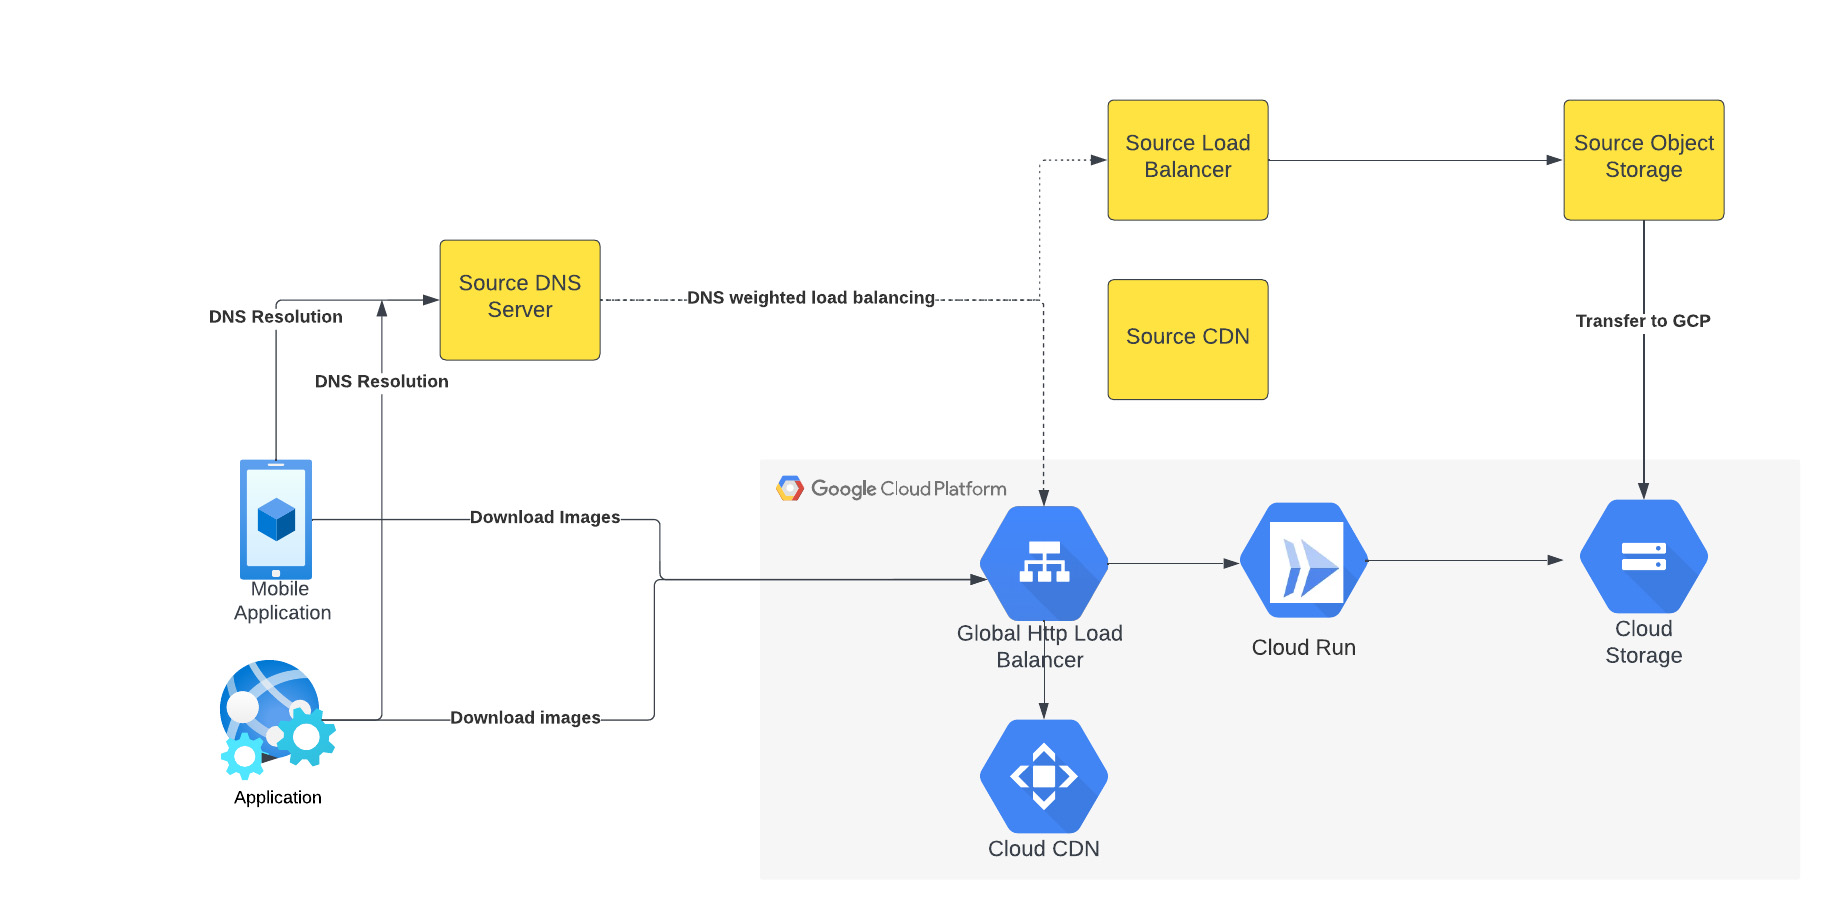
The above figure depicts the CDN migration architecture implemented in Meesho. The existing DNS server points to both the source load balancer as well as Google External HTTP Load Balancer with weighted distribution. The source load balancer points to the source object storage. Images were transferred from the source object storage to Google Cloud Storage.
The Google External HTTP Load Balancer was deployed with Cloud CDN to serve static images that are stored in the CDN cache to users. The Google Load Balancer public IP is configured as an end point on their existing DNS server. The Load Balancer is connected to Cloud Run, which talks to the Cloud Storage bucket. When a request reaches the Load Balancer in the edge, it first checks if the content is available in Cloud CDN, and returns the object from the closest edge network. If the image is not available in the Cloud CDN cache, the request is sent to Cloud Run which obtains the image from the Cloud Storage bucket and performs dynamic resizing of the image if necessary.
Data transfer
Meesho used Google Cloud’s Storage Transfer Service to transfer data from their current object storage to Cloud storage bucket over the internet. Since the number of files and total size of the data to be transferred was huge, Meesho executed multiple parallel transfers by specifying folders and subfolders as prefixes in a Storage Transfer Service job.
Dynamic image resizing
Meesho delivers static images to multiple end user platforms — mobile, laptop — at multiple resolutions. Rather than store each image at multiple image resolutions, Meesho opted to store a single high-resolution mezzanine image. It then attached Cloud Run as a serverless network endpoint group to a Cloud Load Balancer. Application requests for images specify the name of the object, the format of the image, and its resolution (for example, abc.jpeg with 750*450 resolution). If the specific image exists for the requested resolution, then it is returned from the Cloud Storage bucket to the end user and stored in the Cloud CDN cache. If an image for a specified resolution and/or format is not found, the mezzanine image (in our example, abc.jpeg) is resized to the specified resolution and format, then stored in Cloud Storage bucket and returned to the end user. The dynamic resizing and formatting is only performed the first time for a specific resolution.
In this architecture, it is important to configure Cloud Run to scale appropriately as it handles a bulk of “CDN cache-miss” requests. Meesho performed the following configuration steps:
- Configured the number of concurrent requests that a single instance of Cloud Run can handle
- Ensured a sufficient minimum of Cloud Run instances were available to serve user traffic to avoid cold-start latency
- Reviewed limits of Cloud Run maximum instance size for the region and increased the limits if necessary to handle peak load
- Set up smaller start-up times for Cloud Run containers, so that the application could quickly autoscale to handle a surge in traffic
- Optimized the memory and CPU configuration to handle processing requirements
CDN configuration
Cloud CDN was configured to ensure a high cache hit ratio > 99 %. This not only sped up the rendering of the images, but also reduced the load on Cloud Run, saving cost and improving performance.
Achieving zero downtime
Meesho followed well-established DevOps principles to achieve a zero-downtime migration:
- Metrics and alerts were configured in Cloud Monitoring to oversee the load balancer.
- The DNS server was configured to point to Cloud Load Balancer IP addresses in addition to their current load balancer, which served status assets.
- Weight-based DNS load balancing was employed to gradually shift the traffic to Google Cloud, while monitoring application performance and HTTP response codes.
- The initial migration process distributed .1% of traffic during non-peak hours. The metrics, end user performance and response codes were continuously monitored.
- Traffic was gradually incremented over a two-week period by increasing the weight of the Google Cloud Load balancer in DNS. By gradually shifting traffic, Meesho ensured a healthy cache-hit ratio, allowing Cloud Run to learn traffic patterns gradually and scale seamlessly.
Meesho learned a lot through this experience, and has the following advice for anyone undertaking a similar migration:
- While transferring data using Storage Transfer Service of Google Cloud, split the transfer process into multiple transfers.
- Ensure that applications do not pin certificates, which could create problems while migrating to the newer certificates in Google Cloud.
- Plan a gradual migration process to gradually increase the traffic to Google Cloud.
Summary
When all is said and done, Meesho considers its migration to Google Cloud a big success. After migrating the static images to Cloud CDN, Meesho held two major sales that each had three times the normal peak traffic, all with no issues. The CDN migration helped Meesho reduce its costs, improve performance and reduce load balancer errors when fetching static images. To learn more about Cloud CDN and how you can use it in your environment, check out the documentation.
Making Mothers’ Day Special: How Google Cloud Migration for 1-800-FLOWERS.COM, Inc Impacts CX

6827
Of your peers have already read this article.
2:30 Minutes
The most insightful time you'll spend today!
Editor’s note: In honor of Mother’s Day, we look at how 1-800-FLOWERS.COM, Inc. migrated to Google Cloud as part of its digital transformation to quickly deploy seamless and convenient customer experiences across multiple brands on Mother’s Day and every day.
As a leading provider of gifts designed to help customers express, connect, and celebrate, 1-800-FLOWERS.COM, Inc. has embraced cloud technologies to grow and transform its business through constant innovation. As part of our digital transformation, we recently completed the migration of our ecommerce platform and other services to Google Cloud. We’ve transitioned from a monolithic to a microservices platform, moved many workloads from our on-premises data centers to our Google Cloud environment, and scaled both horizontally and vertically.
Since our migration, we’ve developed efficient processes to launch new brands, improved the customer experience across all brands, and seen significantly increased site traffic.
Nurturing a more delightful customer journey
Customer delight is at the core of everything we do. Whether it be with a flower bouquet, a sweet treat, or a personalized keepsake, our mission is to deliver smiles. With the rise of the COVID-19 pandemic, we’ve all been challenged to find unique and safe ways to continue honoring the special connections in our lives and celebrating occasions with loved ones. Our customers have adapted by doing things such as sending gifts to isolated loved ones, sharing the same meal together virtually, or using video to engage with others through group activities like flower arranging and building charcuterie boards.
The customer experience is a top priority for us, and we constantly look for innovative ways to enhance the customer journey across our ecommerce platform of more than a dozen brands. As a result, we’ve continued to see a rise in demand as customers enjoy the ease and convenience of our site and discover our full family of brands.
Migrating to a cloud-first mindset
As we’ve continued to innovate and iterate on the customer experience, we knew we wanted to evolve our platform. We wanted to shift to a microservices platform, which would allow our team the opportunity to release updates to our site more often and set up the right continuous integration/continuous deployment (CI/CD) practices.
Working with Google Cloud, we were able to move our ecommerce platform to the cloud and standardize our site and brand deployment by building one release that could then be repeated across all of our brands. We built everything in a modular fashion, including microservices and code libraries, so that sites could be easily constructed and replicated for each brand. And because of this, we were able to launch Shari’s Berries extremely quickly after we acquired the brand in 2019.
Moving our platform to a completely homegrown solution of microservices was a daunting task. But our team handled it beautifully through load-testing, stress-testing, and building new monitoring tools. And with Google Cloud supporting us all along the way, managing the migration process was simple and easy from start to finish.
Arranging a better bouquet of services
Currently, we’ve migrated every customer-facing touchpoint for all of our brands to Google Cloud—whether it’s on the web or mobile, our AI bots, or our chat interfaces.
- We run on Google Kubernetes Engine and Istio.
- We have nearly 200 microservices built to help power our entire ecommerce stack across several cloud services running on Google Cloud.
- We’re utilizing BigQuery for our offline intelligence.
Results are coming up roses
Our new stack on Google Cloud has benefits for both us and our customers. We moved from a session-based to a token-based system, which provides enhanced security as well as a consistent, convenient experience across all our brands. Using service workers and a single-page app, we are able to download all the relevant site content to the browser in under two seconds to create an instant-click experience for each and every customer. We also use Google Analytics to measure our user interactions and provide personalized results to each customer. Our hope is that with this new system, we can learn from customer behavior to offer gift givers a more personalized shopping experience during each visit.
The benefits of our new tech stack have not only helped us enhance the solutions we offer to customers today, they’ve also enabled us to offer new ones at lightning speed. With our legacy system, we used to release new code once a week or once a month. Now, even during our peak periods, we’re able to release 10 to 15 times a day and can deploy and pivot quickly to create new microservices and microsites on the fly—often without having to touch any code.
Efficiencies abound
The benefits of moving our platform to Google Cloud have extended to our internal teams as well. Before the migration, we had only two environments for developing and testing, which made it time-consuming to test updates before they went into production. Now with Google Cloud, we have several different journey teams—which are made up of developers, product owners, and technical owners—all working in several different environments, solving problems, and creating new solutions together.
Everyone is now empowered to be self-sufficient, developing and releasing microservices on their own when they’re ready. This has given our developers more time to take part in continued development and learning opportunities. For example, we offer lunch-and-learn sessions as well as other resources for everyone to take advantage of so they can continue to learn and refine their skills.
Planting the seeds for future growth
As we look to the future and think about how we help our customers express, connect, and celebrate, we’ll continue to collaborate across teams to deliver solutions that spread smiles. Specifically, we’re exploring additional use of AI to help us better serve our customers across all our brands.
We’ve enjoyed the ongoing support we’ve received from the Google Cloud team as they help us build new solutions and design a road map for the future. Their support has helped the 1-800-FLOWERS.COM, Inc. team to realize the power of the cloud and bring the very best experience to our customers.
Learn more about 1-800-FLOWERS.COM, Inc., or check out our recent blog about cloud migration for the real world.
More Relevant Stories for Your Company

Spot Slow MySQL Queries Fast with Stackdriver Monitoring
When you’re serving customers online, speed is essential for a good experience. As the amount of data in a database grows, queries that used to be fast can slow down. For example, if a query has to scan every row because a table is missing an index, response times that

BigQuery Omni: Your Solution for Multi-Cloud Geospatial Analytics
As we become increasingly reliant on technology to make decisions, geospatial data is becoming more critical than ever. It is a powerful resource that can be used to solve a variety of problems, from tracking the movement of goods, identifying interest areas and potential areas of disaster. Geospatial data incorporates

Analytics Hub for Secure Data Sharing and Analytics Unlocks True Data Value and Insights
Customers tell us that sharing and exchanging data with other organizations is a critical element of their analytics strategy, but it’s hamstrung by unreliable data and processes, and only getting harder with security threats and privacy regulations on the rise. Furthermore, traditional data sharing techniques use batch data pipelines that are

Cloud Bigtable brings database stability and performance to Precognitive
At Precognitive, we were able to start with a blank technology slate to support our fraud detection software products. When we started building the initial version of our platform in 2017, we had some decisions to make: What coding language to use? What cloud infrastructure provider to choose? What database
