





6544
Of your peers have already watched this video.
24:00 Minutes
The most insightful time you'll spend today!
Swarovski’s Journey towards Online and Offline Conversion with Predictive Analytics
Luxury brand and leader in crystals and glass production, Swarovski has charmed customers with its exquisite collections for over 125 years. To understand their customers better and map their online behaviors, Swarovski had to overcome prediction hurdles as majority of the purchases are not frequent or habitual. They are mostly impulse buys or have no rational behind the purchase in order for the brand to accurately map customers’ interest and delight them with relevant personalization or website customization strategy.
Swarovski used a machine learning (ML) model to predict the most performing SKUs and list of products based on both online and offline indicators to target buyers. A score was assigned to each product in the list and was personalized at the country level that delivered relevant insights. Swarovski is aiming to expand the product listing page to personalize at customer level. Watch the video to dive deep into Swarovski’s data analytics efforts to answer complex questions, reporting and prediction using both online and offline data.
Predictive Model Built on Google Cloud Helps You Get a 7-day Mosquito Forecast Report!

4773
Of your peers have already read this article.
3:00 Minutes
The most insightful time you'll spend today!
Mosquitoes aren’t just the peskiest creatures on Earth; they infect more than 700 million people a year with dangerous diseases like Zika, Malaria, Dengue Fever, and Yellow Fever. Prevention is the best protection, and stopping mosquito bites before they happen is a critical step.
SC Johnson—a leading developer and manufacturer of pest control products, consumer packaged goods, and other professional products—has an outsized impact in reducing the transmission of mosquito-borne diseases. That’s why Google Cloud was honored to team up with one of the company’s leading pest control brands, OFF!®, to develop a new publicly available, predictive model of when and where mosquito populations are emerging nationwide.
As the planet warms and weather changes, OFF! noticed month-to-month and year-to-year fluctuations in consumer habits at a regional level, due to changes in mosquito populations. Because of these rapid changes, it’s difficult for people to know when to protect themselves. The OFF!Cast Mosquito Forecast™, built on Google Cloud and available today, will predict mosquito outbreaks across the United States, helping communities protect themselves from both the nuisance of mosquitoes and the dangers of mosquito-borne diseases—with the goal of expanding to other markets, like Brazil and Mexico, in the near future.
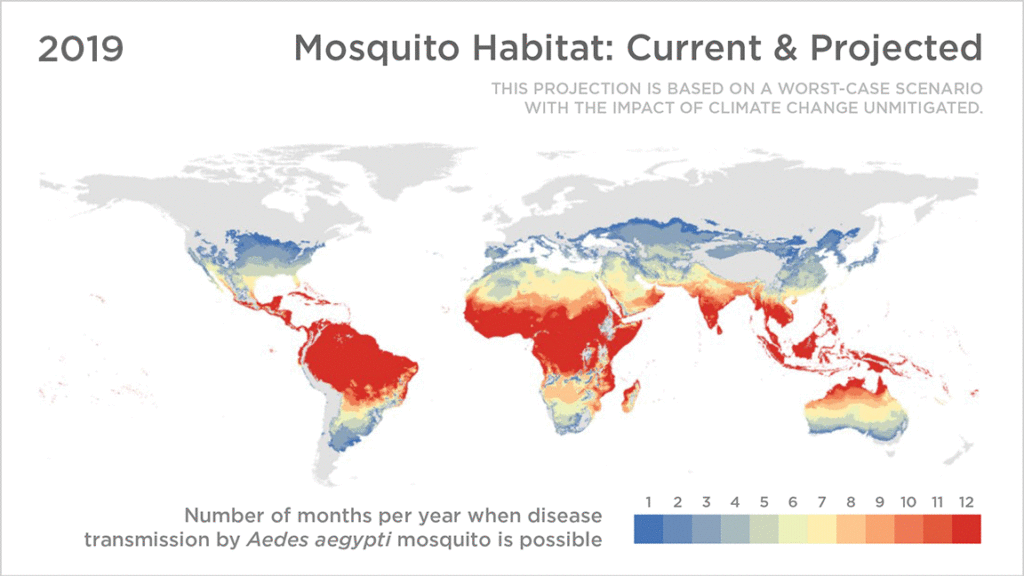
With the OFF!Cast Mosquito Forecast™, anyone can get their local mosquito prediction as easily as a daily weather update. Powered by Google Cloud’s geospatial and data analytics technologies, OFF!Cast Mosquito Forecast is the world’s first public technology platform that predicts and shares mosquito abundance information. By applying data that is informed by the science of mosquito biology, OFF!Cast accurately predicts mosquito behavior and mosquito populations in specific geographical locations.
Starting today, anyone can easily explore OFF!Cast on a desktop or mobile device and get their local seven-day mosquito forecast for any zip code in the continental United States. People can also sign up to receive a weekly forecast. To make this forecasting tool as helpful as possible, OFF! modeled its user interface after popular weather apps, a familiar frame of reference for consumers.

The technology behind the OFF!Cast Mosquito Forecast
To create this first-of-its-kind forecast, OFF! stood up a secure and production-scale Google Cloud Platform environment and tapped into Google Earth Engine, our cloud-based geospatial analysis platform that combines satellite imagery and geospatial data with powerful computing to help people and organizations understand how the planet is changing.
The OFF!Cast Mosquito Forecast is the result of multiple data sources coming together to provide consumers with an accurate view of mosquito activity. First, Google Earth Engine extracts billions of individual weather data points. Then, a scientific algorithm co-developed by the SC Johnson Center for Insect Science and Family Health and Climate Engine experts translates that weather data into relevant mosquito information. Finally, the collected information is put into the model and distilled into a color-coded, seven-day forecast of mosquito populations. The model is applied to the lifecycle of a mosquito, starting from when it lays eggs to when it could bite a human.
The SC Johnson Center for Insect Science and Family Health is one the world’s leading entomology research centers, studying advanced science of insect biology, insect-borne disease prevention and effective product solutions for consumer use. The science behind brands like OFF! is grounded in knowledge from world-class entomologists who have devoted their careers to SC Johnson’s mission of eradicating diseases like Malaria and Zika.
“We are putting the power in consumers’ hands in providing them with a tool to help predict their exposure and prevent mosquito bites,” said Maude Meier, SC Johnson entomologist. “It’s an exciting time to be working in the field of insect science as we find new opportunities to combine science and technology, like Google Earth Engine, to be a force for good in our mission to prevent the spread of insect-borne diseases.”
It takes an ecosystem to battle mosquitos
Over the past decade, academics, scientists and NGOs have used Google Earth Engine and its earth observation data to make meaningful progress on climate research, natural resource protection, carbon emissions reduction and other sustainability goals. It has made it possible for organizations to monitor global forest loss in near real-time and has helped more than 160 countries map and protect freshwater ecosystems. Google Earth Engine is now available in preview with Google Cloud for commercial use.
Our partner, Climate Engine, was a key player in helping make the OFF!Cast Mosquito Forecast a reality. Climate Engine is a scientist-led company that works with Google Cloud and our customers to accelerate and scale the use of Google Earth Engine, in addition to those of Google Cloud Storage and BigQuery, among other tools. With Climate Engine, OFF! integrated insect data from VectorBase, an organization that collects and counts mosquitoes and is funded by the U.S. National Institute of Allergy and Infectious Diseases.
The model powering the OFF!Cast Mosquito Forecast combines three inputs—knowledge of a mosquito’s lifecycle, detailed climate data inputs, and mosquito population counts from more than 5,000 locations provided by VectorBase. The model’s accuracy was validated against precise mosquito population data collected over six years from more than 33 million mosquitoes across 141 different species at more than 5,000 unique trapping locations.
A better understanding of entomology, especially things like degree days and how they affect mosquito populations, and helping communities take action is critically important to improving public health. Learn more about OFF!Cast Mosquito Forecast and see here to learn more about Google Earth Engine on Google Cloud.
How TeamSnap Improved Return on Ad Spend Significantly

5615
Of your peers have already read this article.
3:30 Minutes
The most insightful time you'll spend today!
Anyone who has ever coached or played on a sports team, or had a child involved in sports, knows how difficult scheduling and logistics can be. From game and practice schedules, to uniforms and who’s bringing the snacks, it can be a lot for coaches, administrators, parents, and players to manage.
It’s no wonder that TeamSnap, a sports team, club, and tournament management app, has exploded in popularity worldwide. By syncing events to everyone’s personal calendars and providing messaging and payment tracking, TeamSnap makes communication and organization easy.
TeamSnap markets its app to coaches, players, and clubs via targeted YouTube ads. It also uses Google AdWords and DoubleClick to advertise on search results and run programmatic campaigns. These methods have been highly effective, helping TeamSnap grow to millions of users worldwide and become one of the most popular apps in the iOS app store.
As its business and data grew, TeamSnap was challenged to track ROI and measure the customer journey across channels and devices over time. The company’s marketing budget grew quickly, making it even more important to spend wisely. With data in Google Analytics 360, DoubleClick Campaign Manager, Google AdWords, and Salesforce, TeamSnap needed a way to link and correlate those data sources in a scalable, timely, and cost-effective way to understand the true impact of its digital marketing across websites and mobile apps.
To avoid the painstaking manual process of pulling data from multiple sources, TeamSnap began using Google Analytics 360, which integrates with Google BigQuery, to provide a fully managed big data analysis service. TeamSnap analyzes the data using Tableau, which connects directly to Google BigQuery for fast analytics and helps the company share and collaborate on that information with self-service ease.
The combination allows TeamSnap to easily track the activity of millions of users with self-service ease, without worrying about the scalability or availability of the big data platform.
“Before Google Analytics 360, Google BigQuery, and Tableau, tracking our return on ad spend was difficult because we had so much data,” says Ken McDonald, Chief Growth Officer at TeamSnap. “We didn’t always have insights to make the best choices. We don’t have that problem anymore because we’ve moved to real-time reporting. We find additional revenue growth opportunities almost daily.”
Making Ad Dollars Work Harder
TeamSnap now automatically imports unsampled Google Analytics 360 logs into the Google BigQuery data warehouse. To import data from other sources such as Google AdWords, DoubleClick, and YouTube, TeamSnap uses Google BigQuery Data Transfer Service. With all relevant data consolidated in Google BigQuery, TeamSnap can use Tableau to perform advanced analytics on its digital marketing, executing ad-hoc analyses in seconds, while eliminating data sampling issues, to improve accuracy. These analyses can also be reused and shared with internal and external stakeholders via Tableau Online, promoting governed reuse and consistency.
“Using Google Analytics 360 and Google BigQuery with Tableau to track our return on ad spend is ideal,” says Ken. “It’s easy to use SQL to query the data or explore it with drag-and-drop ease.”
With Google BigQuery, Ken and his team can bring all the data from the TeamSnap billing systems, internal CRM, and other Google services into one straightforward dataset that everyone uses. With Tableau, users are able to perform self-service analytics on this data and provision analyses via shared dashboards that communicate the same consistent truth across the company. These dashboards provide a single view of the business to discover new patterns and questions worth analyzing.
All of this results in enormous time savings because no one is re-inventing the wheel. “Using these tools, we immediately reallocated $300,000 of ad spend that was performing poorly, generating 200% ROI in the first two days,” says Ken.
Ken now spends his time analyzing data instead of trying to pull it all together, identifying pockets of inefficient spend in real time and reallocating those marketing dollars toward better performing campaigns.
“Before, we could only focus on the largest campaign-level datasets because it was so time consuming to pull the data,” he says. “With Google BigQuery and Tableau, we can examine our advertising ROI much more granularly and reallocate more than $10 million in ad spend annually to grow the company faster and more efficiently.”
More Effective A/B Testing
To make sure it is delivering the best customer experiences, TeamSnap uses Google Optimize to run A/B tests on its website. It uses Google BigQuery and Tableau to verify and supplement these findings by measuring longer-term customer behavior across devices, spanning both web and mobile apps.
By pulling in data from Google Optimize, Google Analytics 360, Salesforce, and in-house billing and CRM systems, and understanding it with Tableau, TeamSnap has increased the accuracy and effectiveness of its A/B testing, gaining a more complete picture of customer onboarding and activity. In some cases, it found that short-term indicators it previously trusted were actually poor predictors of long-term behavior.
“Integration between Google Analytics 360 and Google BigQuery is seamless, giving us much more confidence in our A/B testing,” says Ken. “We’re constantly finding new and interesting ways to use our digital marketing data. Often, making a simple change can increase revenue by hundreds of thousands of dollars a year.”
Improving Product Quality
TeamSnap also uses Google BigQuery and Tableau to improve its own product, tracking customer activity at such a granular level that usability and functionality issues can be exposed and addressed faster. It’s also increasing customer engagement by verifying that potential customers are coming in through the right onboarding path—for example, a coach versus a player, or a consumer versus a club or other sports business. Using A/B testing to make sure customers are routed to the appropriate flow, TeamSnap drove $4 million in additional customer value each year.
“We initially chose Google BigQuery and Tableau to help with marketing, but we realized quickly that they could help us on the product side as well,” says Ken. “Most of the testing we do is about making things better and easier for our customers, and we’re accelerating that process with Google BigQuery and Tableau.”
Vector Search: The Tech Powering Billions of Search Results for Google Users

4552
Of your peers have already read this article.
1:30 Minutes
The most insightful time you'll spend today!
Recently, Google Cloud partner Groovenauts, Inc. published a live demo of MatchIt Fast. As the demo shows, you can find images and text similar to a selected sample from a collection of millions in a matter of milliseconds:

Give it a try — and either select a preset image or upload one of your own. Once you make your choice, you will get the top 25 similar images from two million images on Wikimedia images in an instant, as you can see in the video above. No caching involved.
The demo also lets you perform the similarity search with news articles. Just copy and paste some paragraphs from any news article, and get similar articles from 2.7 million articles on the GDELT project within a second.

Vector Search: the technology behind Google Search, YouTube, Play, and more
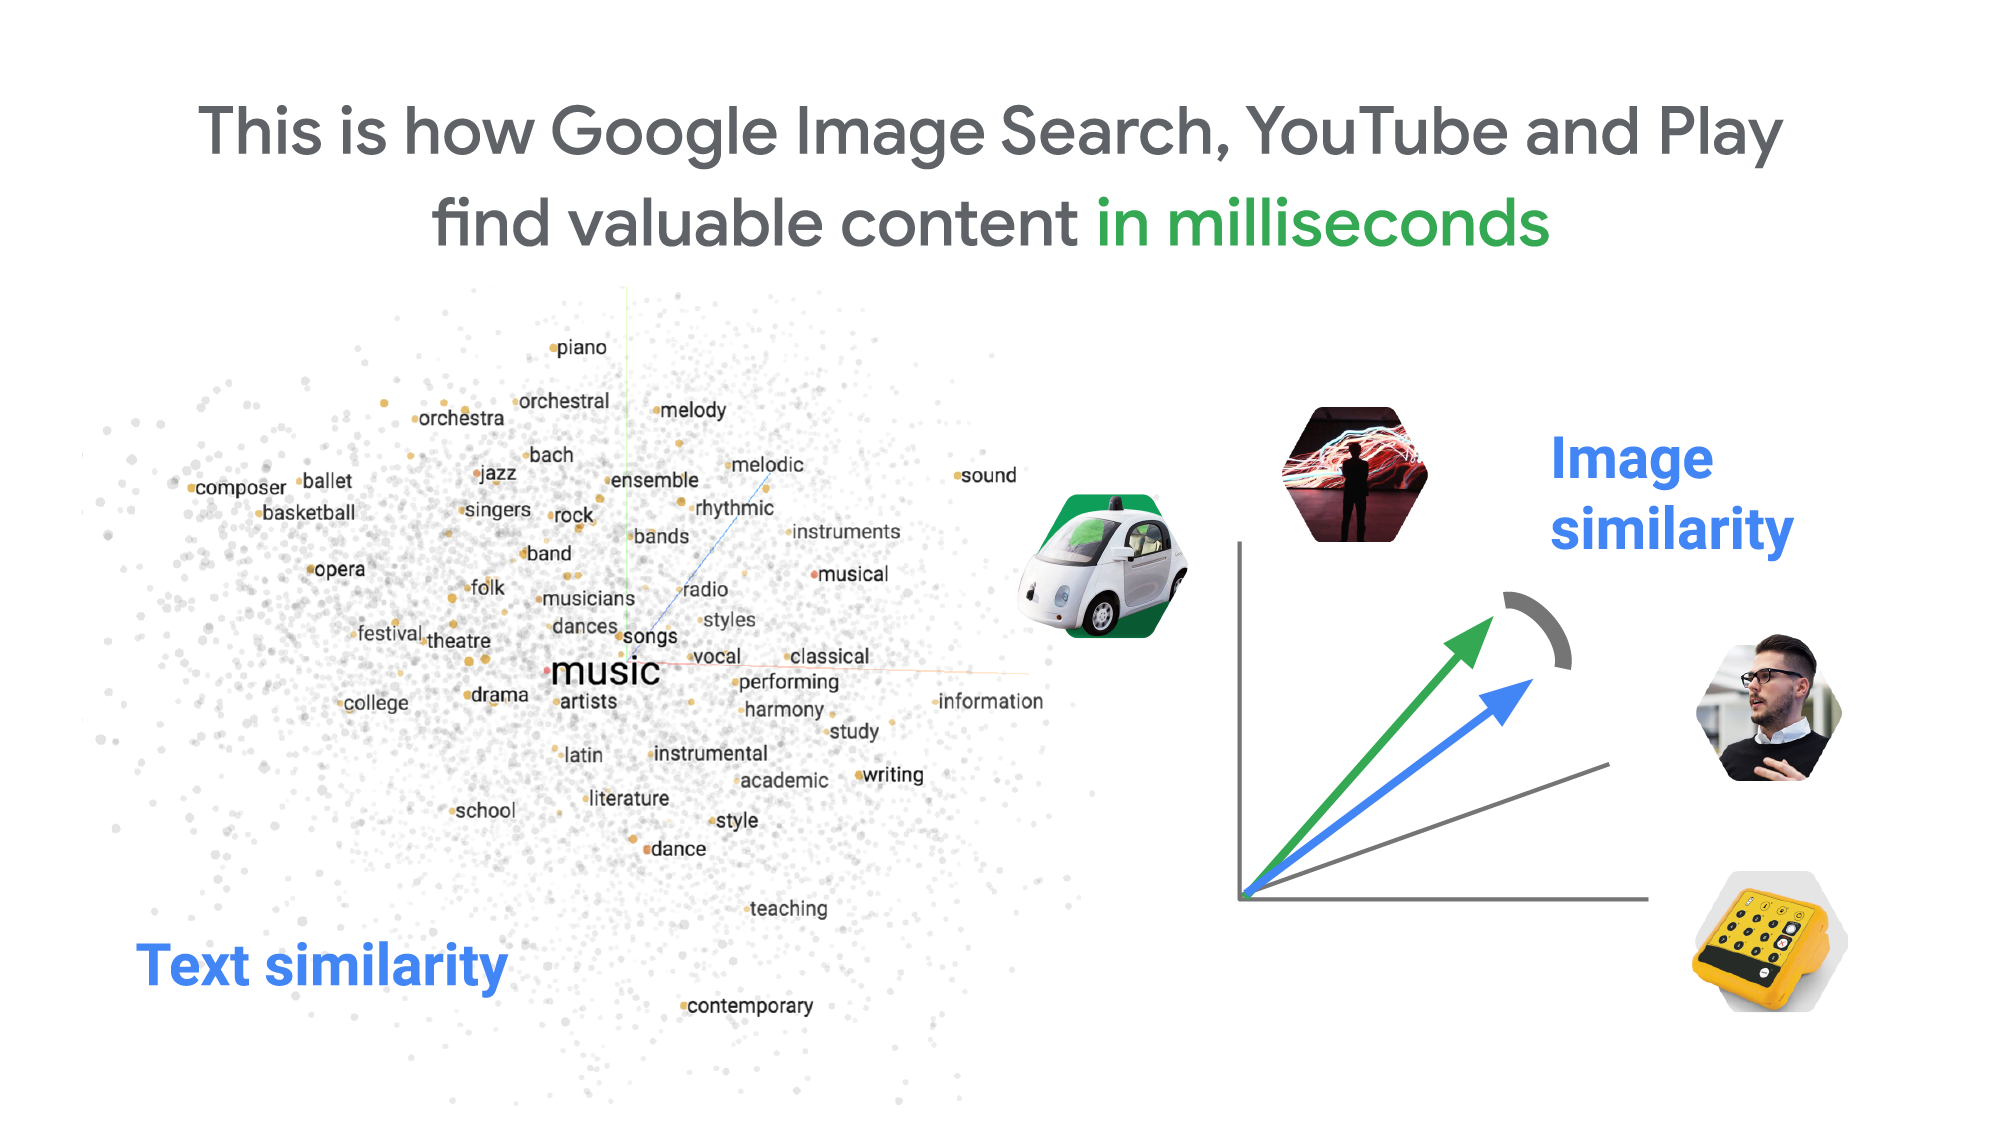
How can it find matches that fast? The trick is that the MatchIt Fast demo uses the vector similarity search (or nearest neighbor search or simply vector search) capabilities of the Vertex AI Matching Engine, which shares the same backend as Google Image Search, YouTube, Google Play, and more, for billions of recommendations and information retrievals for Google users worldwide. The technology is one of the most important components of Google’s core services, and not just for Google: it is becoming a vital component of many popular web services that rely on content search and information retrieval accelerated by the power of deep neural networks.
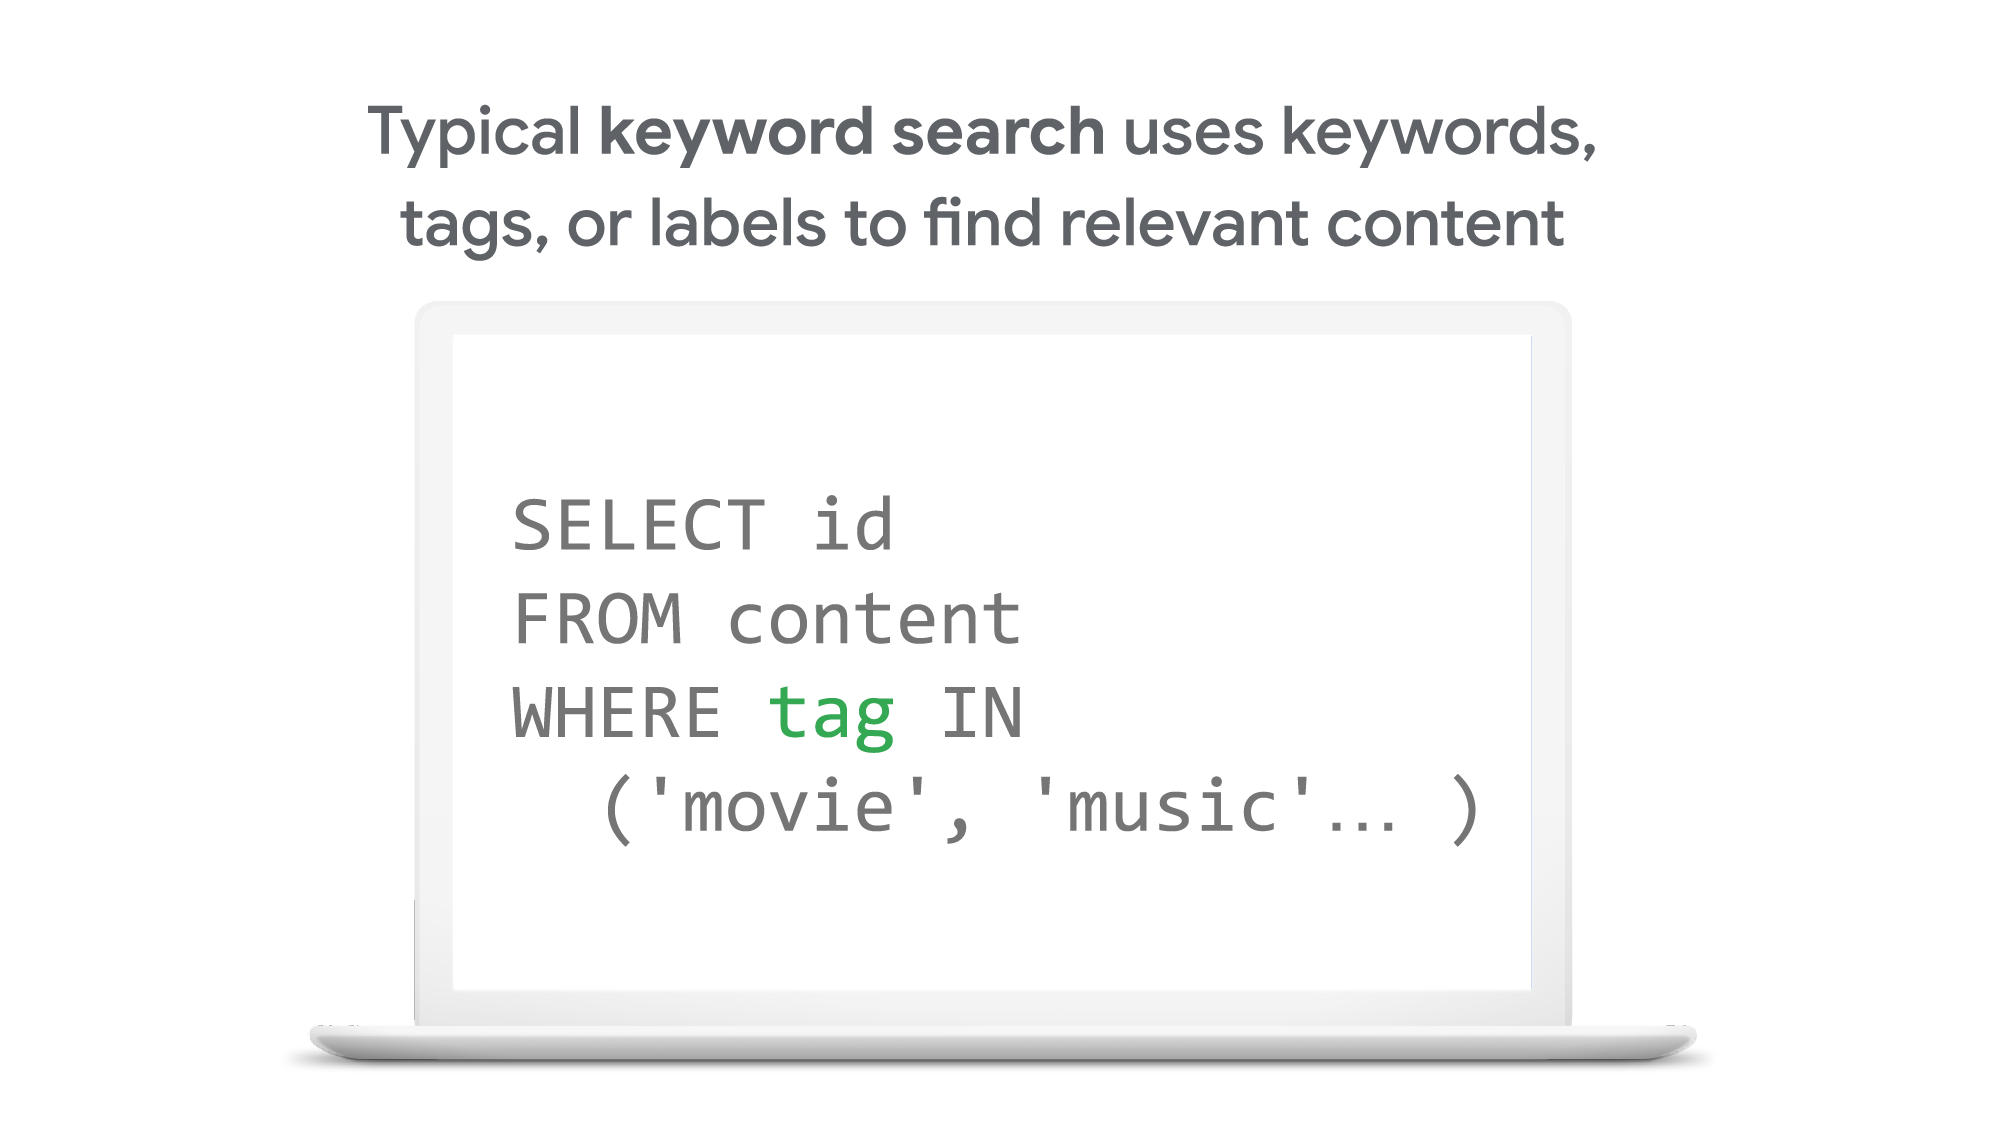
So what’s the difference between traditional keyword-based search and vector similarity search? For many years, relational databases and full-text search engines have been the foundation of information retrieval in modern IT systems. For example, you would add tags or category keywords such as “movie”, “music”, or “actor” to each piece of content (image or text) or each entity (a product, user, IoT device, or anything really). You’d then add those records to a database, so you could perform searches with those tags or keywords.
In contrast, vector search uses vectors (where each vector is a list of numbers) for representing and searching content. The combination of the numbers defines similarity to specific topics. For example, if an image (or any content) includes 10% of “movie”, 2% of “music”, and 30% of “actor”-related content, then you could define a vector [0.1, 0.02, 0.3] to represent it. (Note: this is an overly simplified explanation of the concept; the actual vectors have much more complex vector spaces). You can find similar content by comparing the distances and similarities between vectors. This is how Google services find valuable content for a wide variety of users worldwide in milliseconds.
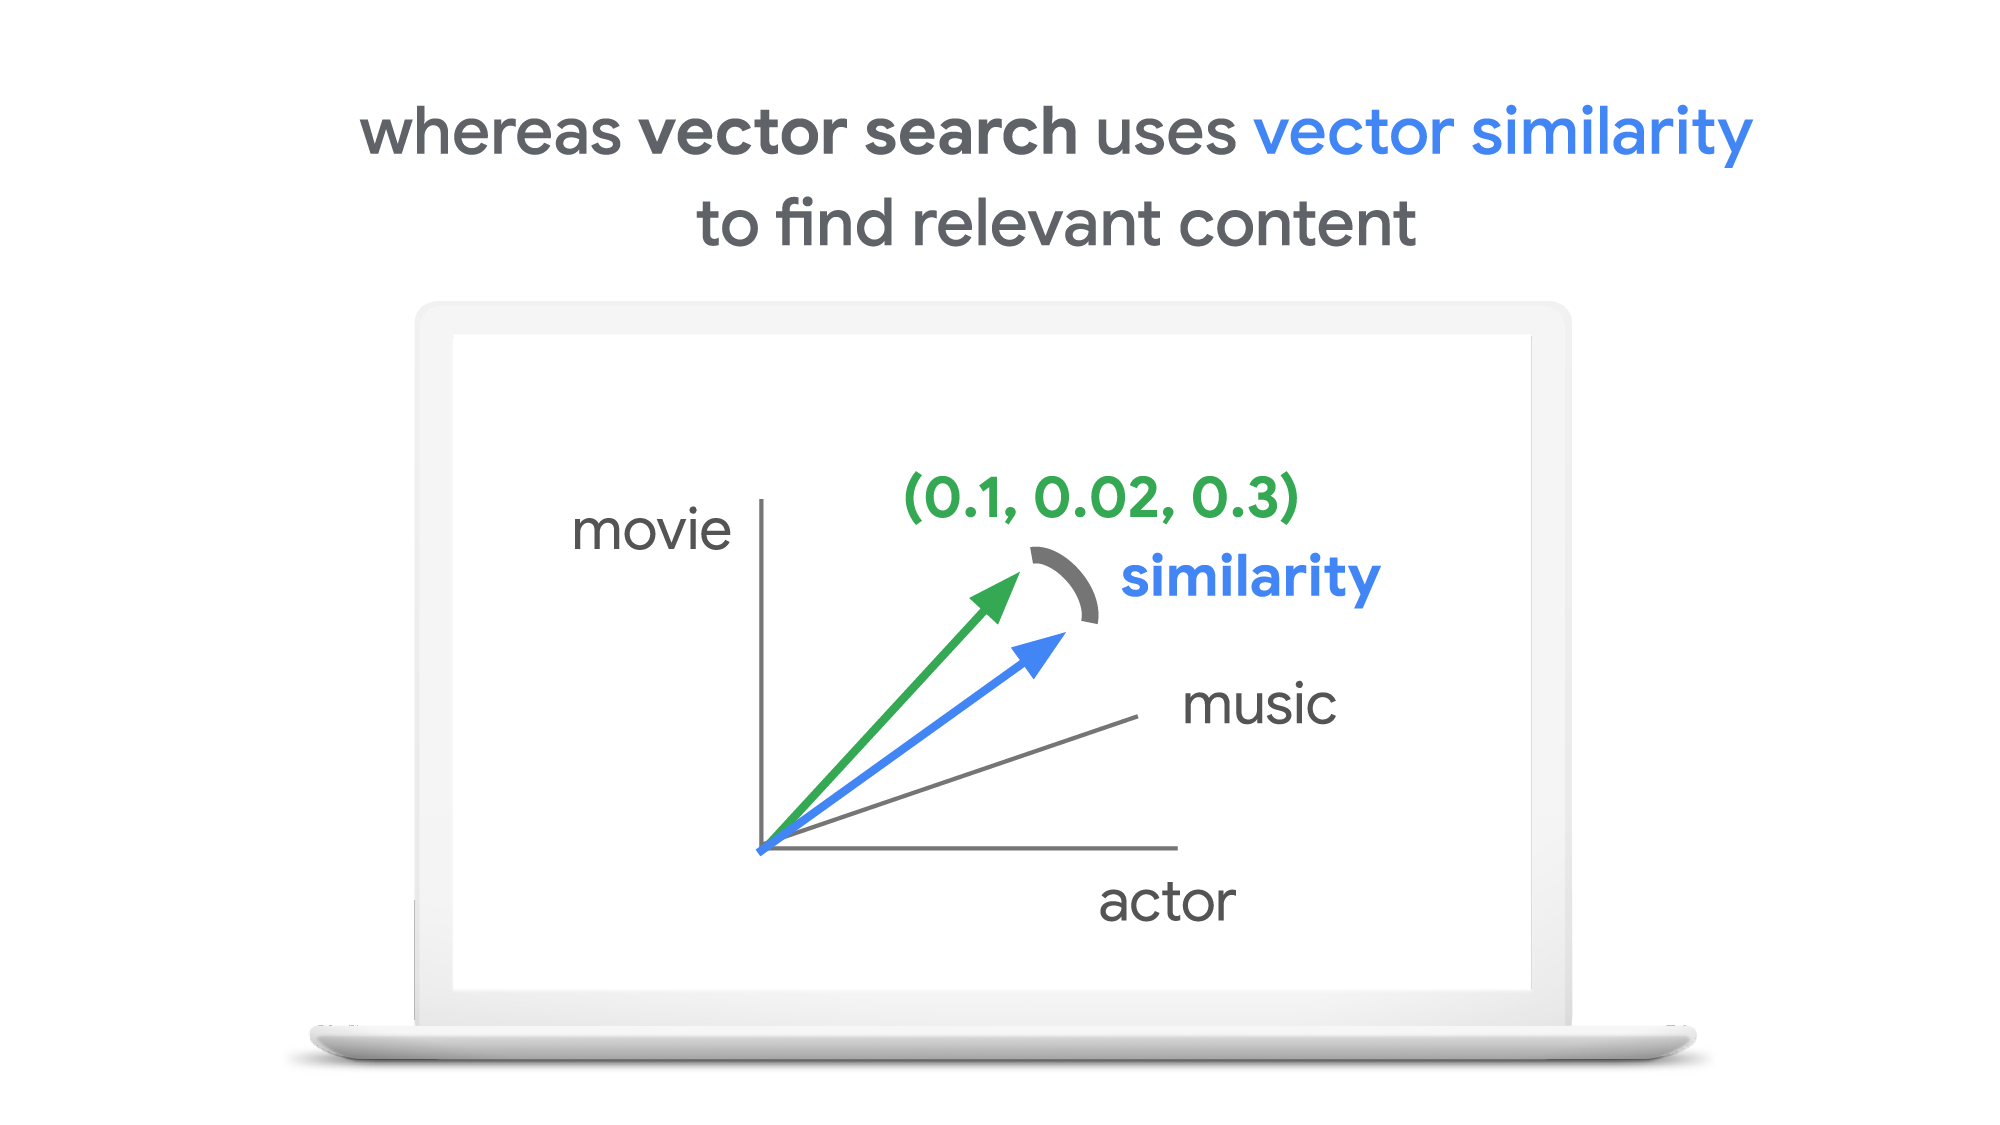
With keyword search, you can only specify a binary choice as an attribute of each piece of content; it’s either about a movie or not, either music or not, and so on. Also, you cannot express the actual “meaning” of the content to search. If you specify a keyword “films”, for example, you would not see any content related to “movies” unless there was a synonyms dictionary that explicitly linked these two terms in the database or search engine.
Vector search provides a much more refined way to find content, with subtle nuances and meanings. Vectors can represent a subset of content that contains “much about actors, some about movies, and a little about music”. Vectors can represent the meaning of content where “films”, “movies”, and “cinema” are all collected together. Also, vectors have the flexibility to represent categories previously unknown to or undefined by service providers. For example, emerging categories of content primarily attractive to kids, such as ASMR or slime, are really hard for adults or marketing professionals to predict beforehand, and going back through vast databases to manually update content with these new labels would be all but impossible to do quickly. But vectors can capture and represent never-before-seen categories instantly.
Vector search changes business
Vector search is not only applicable to image and text content. It can also be used for information retrieval for anything you have in your business when you can define a vector to represent each thing. Here are a few examples:
- Finding similar users: If you define a vector to represent each user in your business by combining the user’s activities, past purchase history, and other user attributes, then you can find all users similar to a specified user. You can then see, for example, users who are purchasing similar products, users that are likely bots, or users who are potential premium customers and who should be targeted with digital marketing.
- Finding similar products or items: With a vector generated from product features such as description, price, sales location, and so on, you can find similar products to answer any number of questions; for example, “What other products do we have that are similar to this one and may work for the same use case?” or “What products sold in the last 24 hours in this area?” (based on time and proximity)
- Finding defective IoT devices: With a vector that captures the features of defective devices from their signals, vector search enables you to instantly find potentially defective devices for proactive maintenance.
- Finding ads: Well-defined vectors let you find the most relevant or appropriate ads for viewers in milliseconds at high throughput.
- Finding security threats: You can identify security threats by vectorizing the signatures of computer virus binaries or malicious attack behaviors against web services or network equipment.
- …and many more: Thousands of different applications of vector search in all industries will likely emerge in the next few years, making the technology as important as relational databases.
OK, vector search sounds cool. But what are the major challenges to applying the technology to real business use cases? Actually there are two:
- Creating vectors that are meaningful for business use cases
- Building a fast and scalable vector search service
Embeddings: meaningful vectors for business use cases
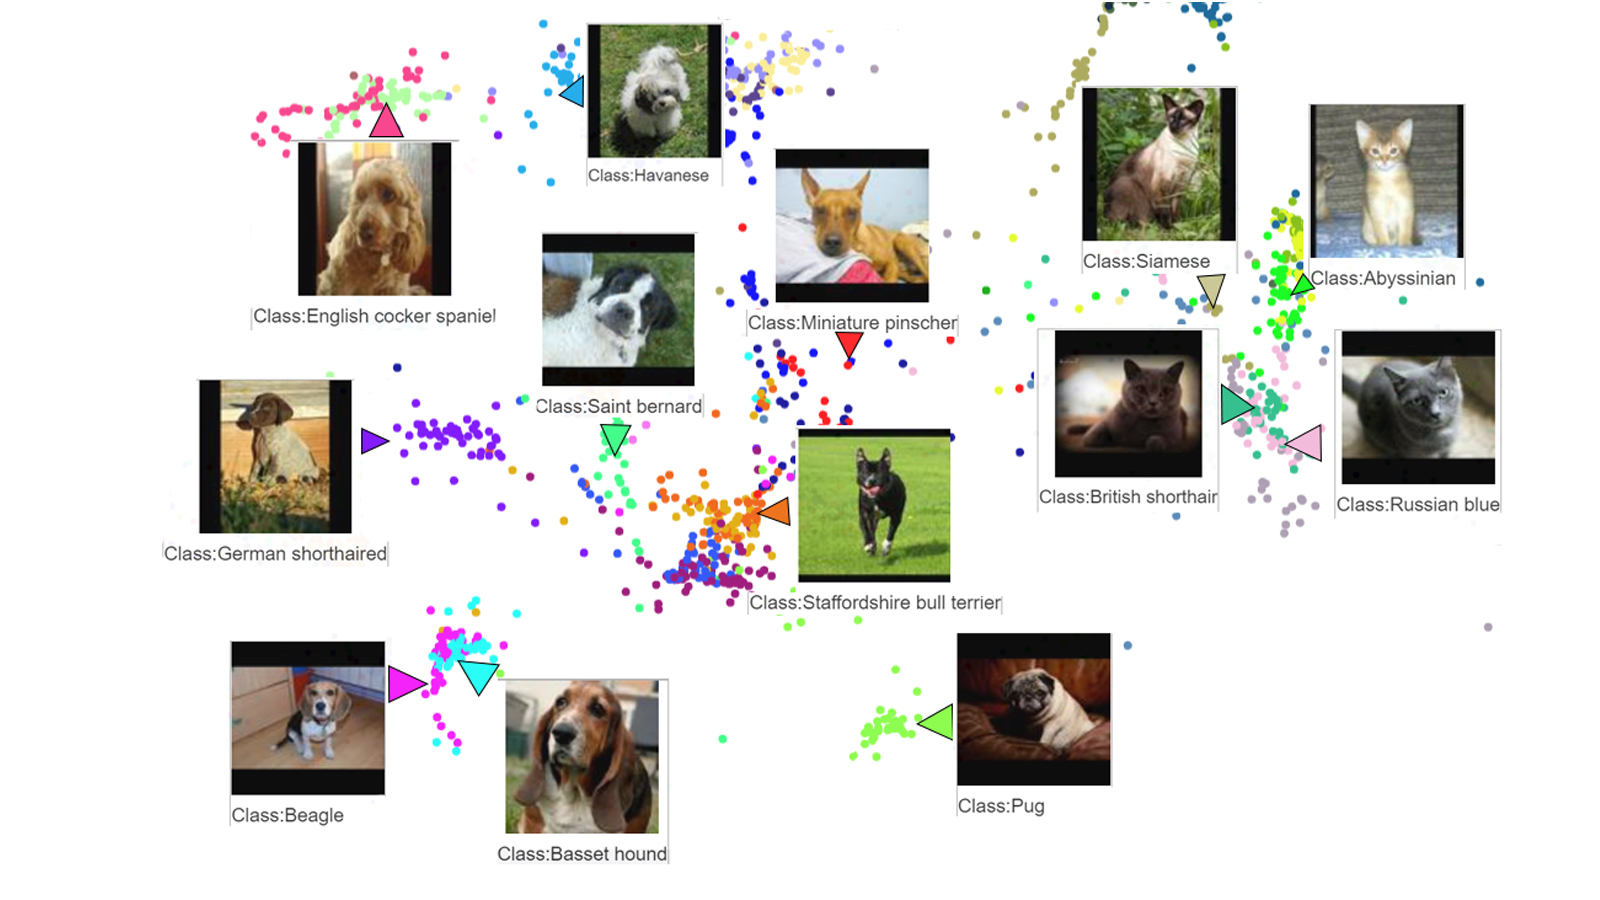
The first challenge is creating vectors for representing various entities that are meaningful and useful for business use cases. This is where deep learning technology can really shine. In the case of the MatchIt Fast demo, the application simply uses a pre-trained MobileNet v2 model for extracting vectors from images, and the Universal Sentence Encoder (USE) for text. By applying such models to raw data, you can extract “embeddings” – vectors that map each row of data in a space of their “meanings”. MobileNet puts images that have similar patterns and textures closer to one another in the embedding space, and USE puts texts that have similar topics closer.
For example, a carefully designed and trained machine learning model could map movies into an embedding space like the following:
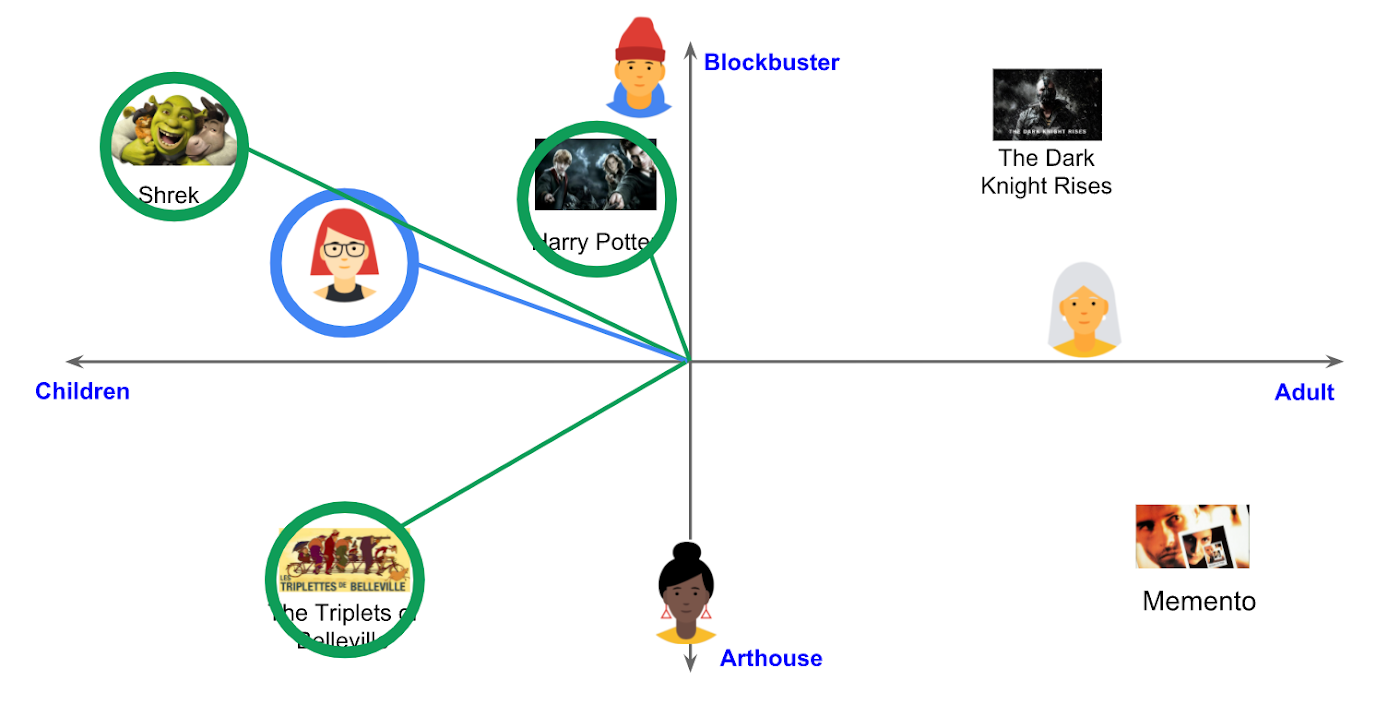
With the embedding space shown here, users could find recommended movies based on the two dimensions: is the movie for children or adults, and is it a blockbuster or arthouse movie? This is a very simple example, of course, but with an embedding space like this that fits your business requirements, you can deliver a better user experience on recommendation and information retrieval services with insights extracted from the model.
For more about creating embeddings, the Machine Learning Crash Course on Recommendation Systems is a great way to get started. We will also discuss how to extract better embeddings from business data later in this post.
Building a fast and scalable vector search service
Suppose that you have successfully extracted useful vectors (embeddings) from your business data. Now the only thing you have to do is search for similar vectors. That sounds simple, but in practice it is not. Let’s see how the vector search works when you implement it with BigQuery in a naive way:https://www.youtube.com/embed/wHNJspvxj2w?enablejsapi=1&
It takes about 20 seconds to find similar items (fish images in this case) from a pool of one million items. That level of performance is not so impressive, especially when compared to the MatchIt Fast demo. BigQuery is one of the fastest data warehouse services in the industry, so why does the vector search take so long?
This illustrates the second challenge: building a fast and scalable vector search engine isn’t an easy task. The most widely used metrics for calculating the similarity between vectors are L2 distance (Euclidean distance), cosine similarity, and inner product (dot product).
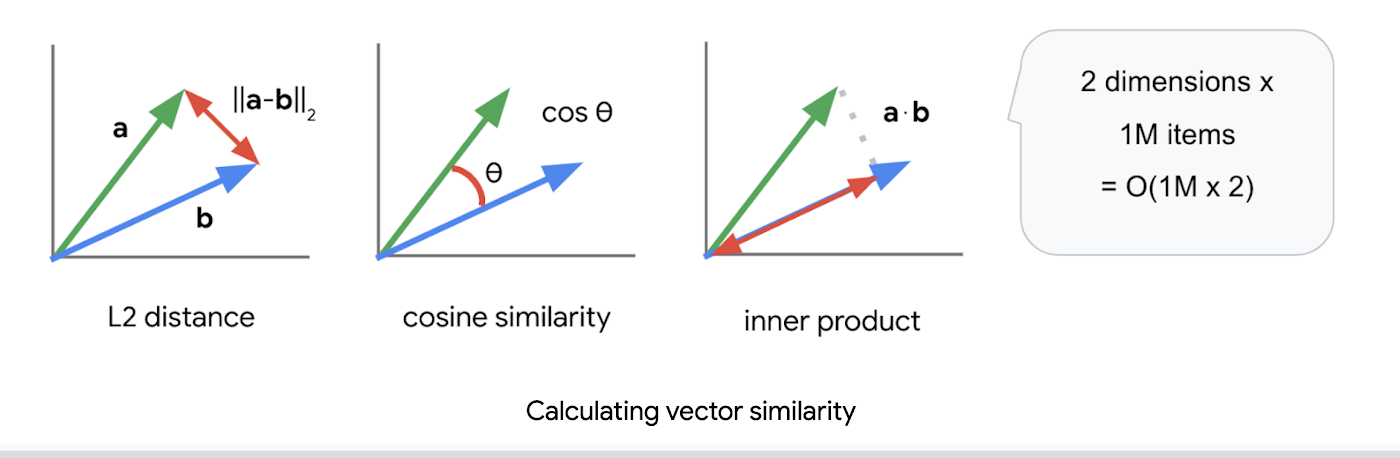
But all require calculations proportional to the number of vectors multiplied by the number of dimensions if you implement them in a naive way. For example, if you compare a vector with 1024 elements to 1M vectors, the number of calculations will be proportional to 1024 x 1M = 1.02B. This is the computation required to look through all the entities for a single search, and the reason why the BigQuery demo above takes so long.
Instead of comparing vectors one by one, you could use the approximate nearest neighbor (ANN) approach to improve search times. Many ANN algorithms use vector quantization (VQ), in which you split the vector space into multiple groups, define “codewords” to represent each group, and search only for those codewords. This VQ technique dramatically enhances query speeds and is the essential part of many ANN algorithms, just like indexing is the essential part of relational databases and full-text search engines.
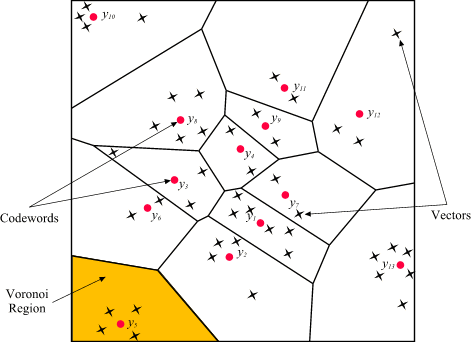
As you may be able to conclude from the diagram above, as the number of groups in the space increases the speed of the search decreases and the accuracy increases. Managing this trade-off — getting higher accuracy at shorter latency — has been a key challenge with ANN algorithms.
Last year, Google Research announced ScaNN, a new solution that provides state-of-the-art results for this challenge. With ScaNN, they introduced a new VQ algorithm called anisotropic vector quantization:
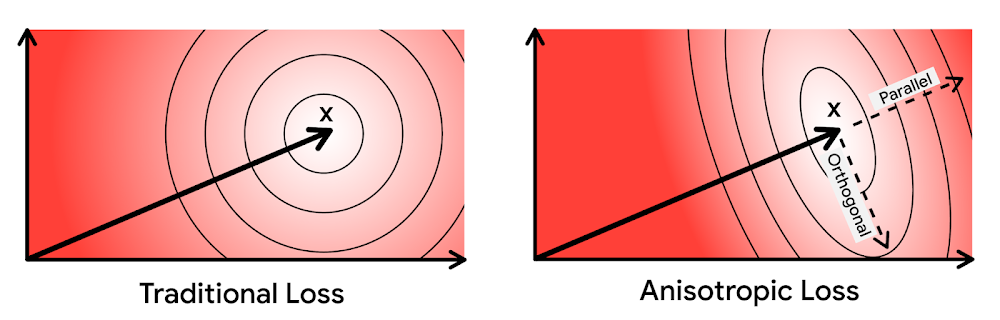
Anisotropic vector quantization uses a new loss function to train a model for VQ for an optimal grouping to capture farther data points (i.e. higher inner product) in a single group. With this idea, the new algorithm gives you higher accuracy at lower latency, as you can see in the benchmark result below (the violet line):
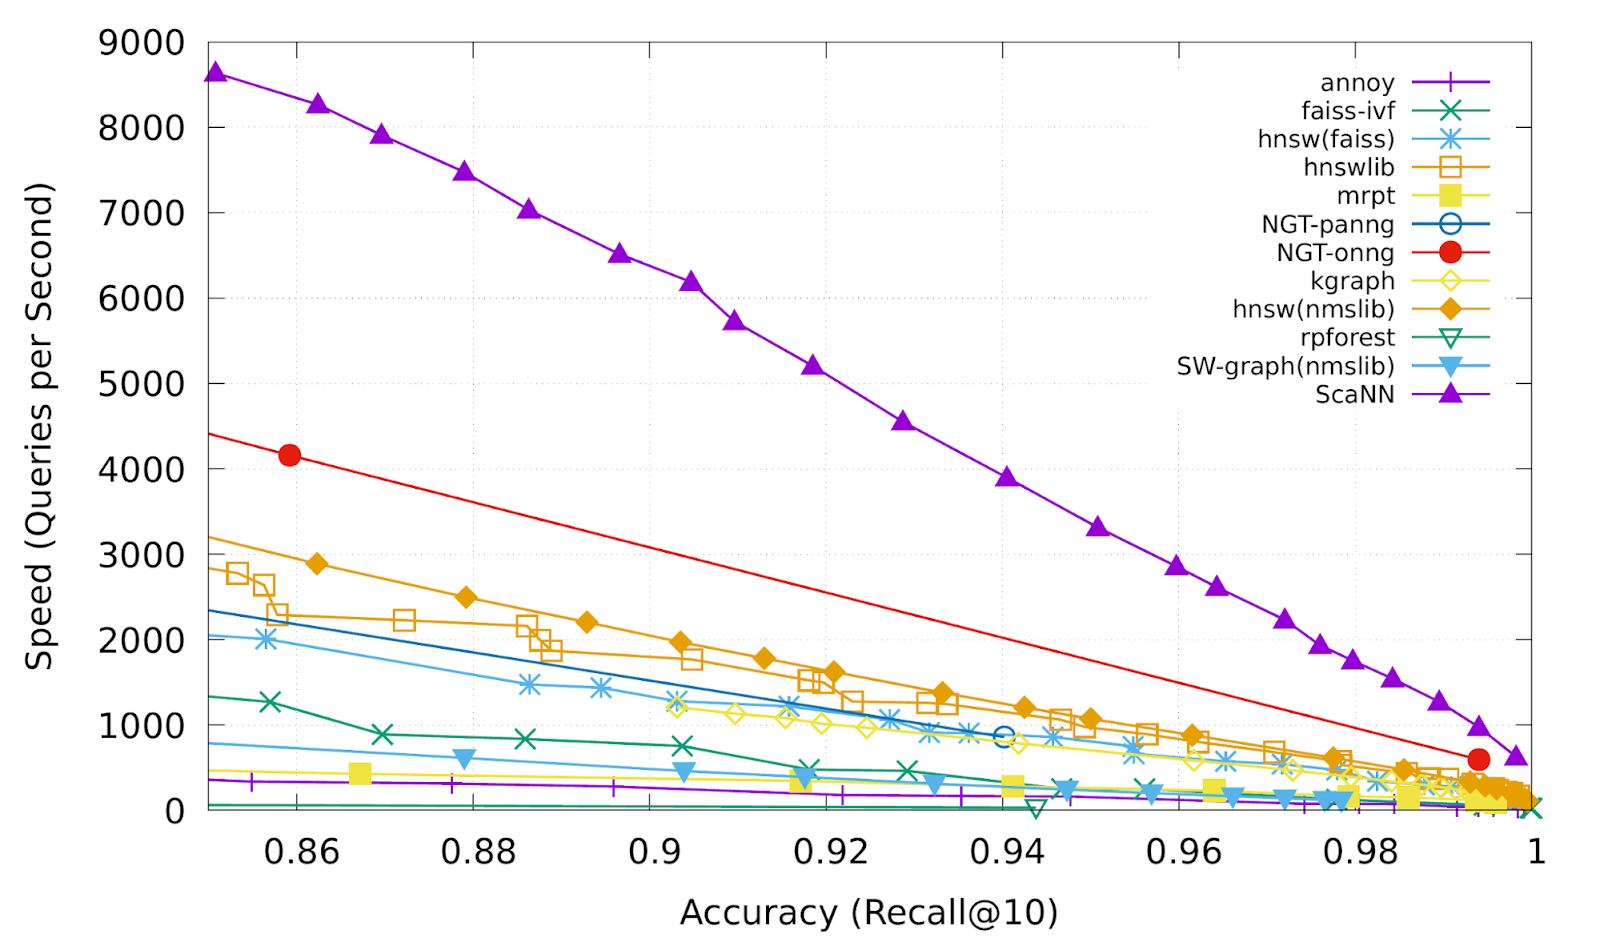
This is the magic ingredient in the user experience you feel when you are using Google Image Search, YouTube, Google Play, and many other services that rely on recommendations and search. In short, Google’s ANN technology enables users to find valuable information in milliseconds, in the vast sea of web content.
How to use Vertex AI Matching Engine
Now you can use the same search technology that powers Google services with your own business data. Vertex AI Matching Engine is the product that shares the same ScaNN based backend with Google services for fast and scalable vector search, and recently it became GA and ready for production use. In addition to ScaNN, Matching Engine gives you additional features as a commercial product, including:
- Scalability and availability: The open source version of ScaNN is a good choice for evaluation purposes, but as with most new and advanced technologies, you can expect challenges when putting it into production on your own. For example, how do you operate it on multiple nodes with high scalability, availability, and maintainability? Matching Engine uses Google’s production backend for ScaNN, which provides auto-scaling and auto-failover with a large worker pool. It is capable of handling tens of thousands of requests per second, and returns search results in less than 10 ms for the 90th percentile with a recall rate of 95 – 98%.
- Fully managed: You don’t have to worry about building and maintaining the search service. Just create or update an index with your vectors, and you will have a production-ready ANN service deployed. No need to think about rebuilding and optimizing indexes, or other maintenance tasks.
- Filtering: Matching Engine provides filtering functionality that enables you to filter search results based on tags you specify on each vector. For example, you can assign “country” and “stocked” tags to each fashion item vector, and specify filters like “(US OR Canada) AND stocked” or “not Japan AND stocked” on your searches.
Let’s see how to use Matching Engine with code examples from the MatchIt Fast demo.
Generating embeddings
Before starting the search, you need to generate embeddings for each item like this one:
{"Id":"b5c65fea9b0b8a57bfa574ea","Embedding": [0.16329009830951691,0.92436742782592773,0.00095699273515492678,0.011479727923870087,0.0089491046965122223,0.019959751516580582,0.031516745686531067,0.0066015380434691906,0.46404418349266052,...
This is an embedding with 1280 dimensions for a single image, generated with a MobileNet v2 model. The MatchIt Fast demo generates embeddings for two million images with the following code:
class Vectorizer:def __init__(self):self._model = tf.keras.Sequential([hub.KerasLayer("https://tfhub.dev/google/imagenet/mobilenet_v2_100_224/feature_vector/5", trainable=False)])self._model.build([None, 224, 224, 3]) # Batch input shape.def vectorize(self, jpeg_file):...snip...embedding = self._model.predict({"inputs": input_tensor})[0].tolist()return embedding
After you generate the embeddings, you store them in a Google Cloud Storage bucket.
Configuring an index
Then, define a JSON file for the index configuration:
{"contentsDeltaUri": "gs://match-it-fast-us-central1/wikimedia_images/index-1","config": {"dimensions": 1280,"approximateNeighborsCount": 150,"distanceMeasureType": "SQUARED_L2_DISTANCE","algorithm_config": {"treeAhConfig": {"leafNodeEmbeddingCount": 1000,"leafNodesToSearchPercent": 5}}}}
You can find a detailed description for each field in the documentation, but here are some important fields:
contentsDeltaUri: the place where you have stored the embeddingsdimensions: how many dimensions in the embeddingsapproximateNeighborsCount: the default number of neighbors to find via approximate searchdistanceMeasureType: how the similarity between embeddings should be measured, either L1, L2, cosine or dot product (this page explains which one to choose for different embeddings)
To create an index on the Matching Engine, run the following gcloud command where the metadata-file option takes the JSON file name defined above.
gcloud --project=gn-match-it-fast beta ai indexes create \--display-name=wikimedia-images \--description="Wikimedia Image Demo" \--metadata-file=metadata/wikimedia_images_index_metadata.json \--region=us-central1
Run the search
Now the Matching Engine is ready to run. The demo processes each search request in the following order:
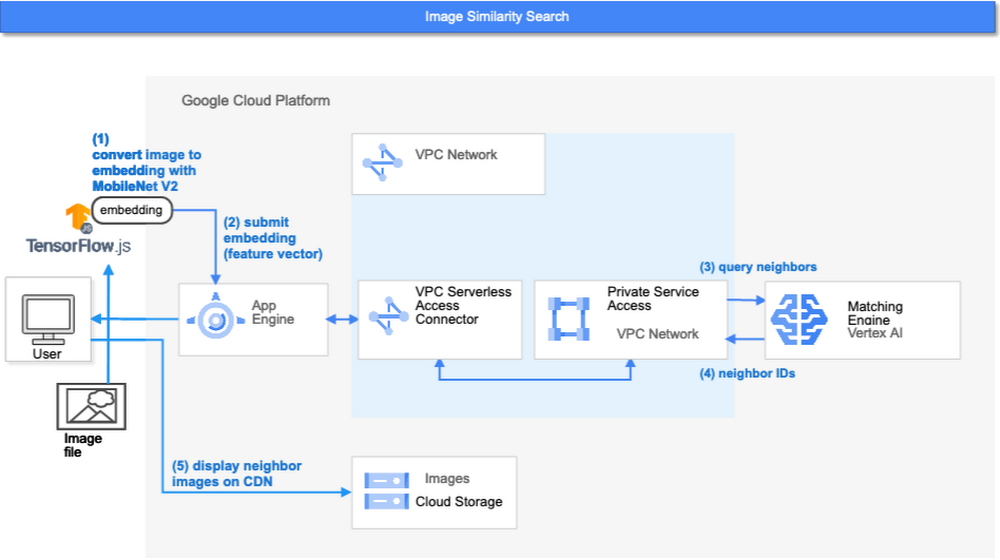
- First, the web UI takes an image (the one chosen or uploaded by the user) and encodes it into an embedding using the TensorFlow.js MobileNet v2 model running inside the browser. Note: this “client-side encoding” is an interesting option for reducing network traffic when you can run the encoding at the client. In many other cases, you would encode contents to embeddings with a server-side prediction service such as Vertex AI Prediction, or just retrieve pre-generated embeddings from a repository like Vertex AI Feature Store.
- The App Engine frontend receives the embedding and submits a query to the Matching Engine. Note that you can also use any other compute services in Google Cloud for submitting queries to Matching Engine, such as Cloud Run, Compute Engine, or Kubernetes Engine, or whatever is most suitable for your applications.
- Matching Engine executes its search. The connection between App Engine and Matching Engine is provided via a VPC private network for optimal latency.
- Matching Engine returns the IDs of similar vectors in its index.
Step 3 is implemented with the following code:
class MatchingQueryClient:...snip...def query_embedding(self, embedding, num_neighbors=30):request = match_service_pb2.MatchRequest()request.deployed_index_id = self._deployed_index_idfor v in embedding:request.float_val.append(v)request.num_neighbors = num_neighborsresponse = self._stub.Match(request)return response
The request to the Matching Engine is sent via gRPC as you can see in the code above. After it gets the request object, it specifies the index id, appends elements of the embedding, specifies the number of neighbors (similar embeddings) to retrieve, and calls the Match function to send the request. The response is received within milliseconds.
Next steps: Making changes for various use cases and better search quality
As we noted earlier, the major challenges in applying vector search on production use cases are:
- Creating vectors that are meaningful for business use cases
- Building a fast and scalable vector search service
From the example above, you can see that Vertex AI Matching Engine solves the second challenge. What about the first one? Matching Engine is a vector search service; it doesn’t include the creating vectors part.
The MatchIt Fast demo uses a simple way of extracting embeddings from images and contents; specifically it uses an existing pre-trained model (either MobileNet v2 or Universal Sentence Encoder). While those are easy to get started with, you may want to explore other options to generate embeddings for other use cases and better search quality, based on your business and user experience requirements.
For example, how do you generate embeddings for product recommendations? The Recommendation Systems section of the Machine Learning Crash Course is a great resource for learning how to use collaborative filtering and DNN models (the two-tower model) to generate embeddings for recommendation. Also, TensorFlow Recommenders provides useful guides and tutorials for the topic, especially on the two-tower model and advanced topics. For integration with Matching Engine, you may also want to check out the Train embeddings by using the two-tower built-in algorithm page.
Another interesting solution is the Swivel model. Swivel is a method for generating item embeddings from an item co-occurrence matrix. For structured data, such as purchase orders, the co-occurrence matrix of items can be computed by counting the number of purchase orders that contain both product A and product B, for all products you want to generate embeddings for. To learn more, take a look at this tutorial on how to use the model with Matching Engine.
If you are looking for more ways to achieve better search quality, consider metric learning, which enables you to train a model for discrimination between entities in the embedding space, not only classification:
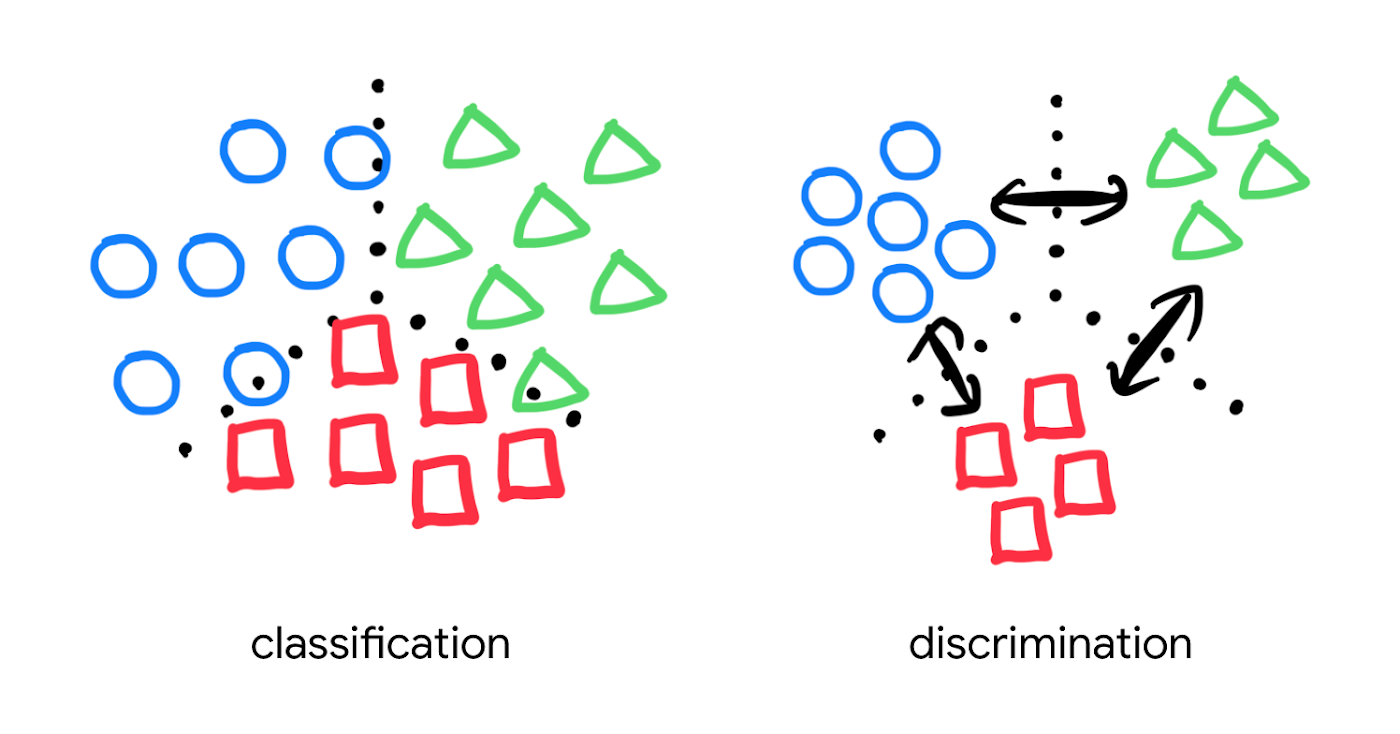
Popular pre-trained models such as the MobileNet v2 can classify each object in an image, but they are not explicitly trained to discriminate the objects from each other with a defined distance metric. With metric learning, you can expect better search quality by designing the embedding space optimized for various business use cases. TensorFlow Similarity could be an option for integrating metric learning with Matching Engine.
Interested? Today, we’re just beginning the migration from traditional search technology to new vector search. Over the next 5 to 10 years, many more best practices and tools will be developed in the industry and community. These tools and best practices will help answer many questions, like… How do you design your own embedding space for a specific business use case? How do you measure search quality? How do you debug and troubleshoot the vector search? How do you build a hybrid setup with existing search engines for meeting sophisticated requirements? There are many new challenges and opportunities ahead for introducing the technology to production. Now’s the time to get started delivering better user experiences and seizing new business opportunities with Matching Engine powered by vector search.
Acknowledgements
We would like to thank Anand Iyer, Phillip Sun, and Jeremy Wortz for their invaluable feedback to this post.
An Expert’s Opinion on What Early-stage Startups Must Know

6467
Of your peers have already read this article.
3:00 Minutes
The most insightful time you'll spend today!
As lead for analytics and AI solutions at Google Cloud, my team works with startups building on Google Cloud. This puts us in the fortunate position to learn from founders and engineers about how early-stage startups’ investments can either constrain them or position them for success, even at the seed level. In this post, I want to share a few of the best practices to keep in mind as you’re building.
Understand your value proposition before diving into a technology stack
If you’re launching a startup in the cloud, you’re no doubt thinking about a technology stack, but it’s important to step back a bit and think carefully about the major value proposition that your startup offers to your customers. That value proposition is going to fundamentally drive the kind of technology that you should pick.
For example, does your system need processing in real time, or can it be done in a batch mode? Can you rely on once-a-day insights or do the insights have to come in as events happen?
Additionally, what kind of latency will your customers face? That latency makes your value proposition either usable or unusable. Early on in Google’s development, leaders realized that no one was going to wait more than a few hundred milliseconds for a web page to show them their results, and that realization drove the technology decisions that have allowed Google to scale from being a startup in a garage to being a trillion dollar company. Your startup needs to define its value to customers with this level of specificity before it can build a technology stack suited to its needs.
Focus on customer interactions
A few companies have gracefully pulled off big IT pivots that reshaped their value proposition. Netflix, for example, moved from mostly sending DVDs through the mail to becoming a streaming service and major content producer. That’s a huge shift in the user experience and the technology stack necessary to support it, even if the underlying value proposition (i.e., get content to customers) was broadly the same. But it’s also an outlier. If you’re planning for potential changes of this magnitude, rather than focused on getting your value proposition to users, you probably need to sharpen what that value proposition is.
Specifically, you need a clear vision of how customers will access and interact with your business. Typically, they’ll do so over a website or a mobile app, but there are still so many variables.
Are customers going to transmit documents? If so, in what format? Is handwriting supported or is input limited to typing? Can they use images for optical character recognition? Will it mostly be forms? Will the data be structured or unstructured? If all that sounds a little overwhelming, don’t worry, it’ll seem simpler by the end of this article—but also be aware: we’re just getting warmed up.
Imagine that most of your customers will access your business via voice, so you know you’ll want to prioritize conversational workflows. That’s a start—but dig deeper. Even if we suppose you’re usingDialogflow, a Google Cloud conversational AI platform that lets you build and deploy virtual agents, we’re still not really seeing the value proposition. How will all this work, from the beginning of a typical full customer interaction to the resolution? How many interactions will have to be facilitated over low-bandwidth connections, for example? When it comes to user interactions, make sure you can see an end-to-end use case.
Another example: you’re building a retail website, and one of your end-to-end use cases involves the customer asking if a certain amount of a given product is in stock, whether it’s one unit of the product, ten or hundreds. If the product is not sufficiently stocked, you want your app to offer similar items that are. Will your technology stack support this end-to-end use case?
These considerations are not an argument for premature optimization. There’s value in moving fast, getting minimum viable products to users, and then iterating. But in the early stages, you only get one chance to start on the right foot—and how you navigate that chance will influence a lot of dollars and effort down the road. You need to make sure you have business use cases, not just an idea, before you can start designing a technology stack.
Here’s how to get in the right frame of mind. Pick three use cases: two that are “bread and butter” and one that is technologically complex. Make sure your proposed technology stack can support all three, end to end.
Default toward higher levels of abstraction
Now that we’re in the right frame of mind, we’re ready to think about the technology stack more directly.
As a startup, you’ll need to conserve resources, and to do that, you’ll want to build at the highest level of abstraction possible for your value proposition. For example, you probably don’t want your people setting up clusters. You don’t want them configuring things if they can use a fully managed service. You want them focused on building your prototype, not managing infrastructure.
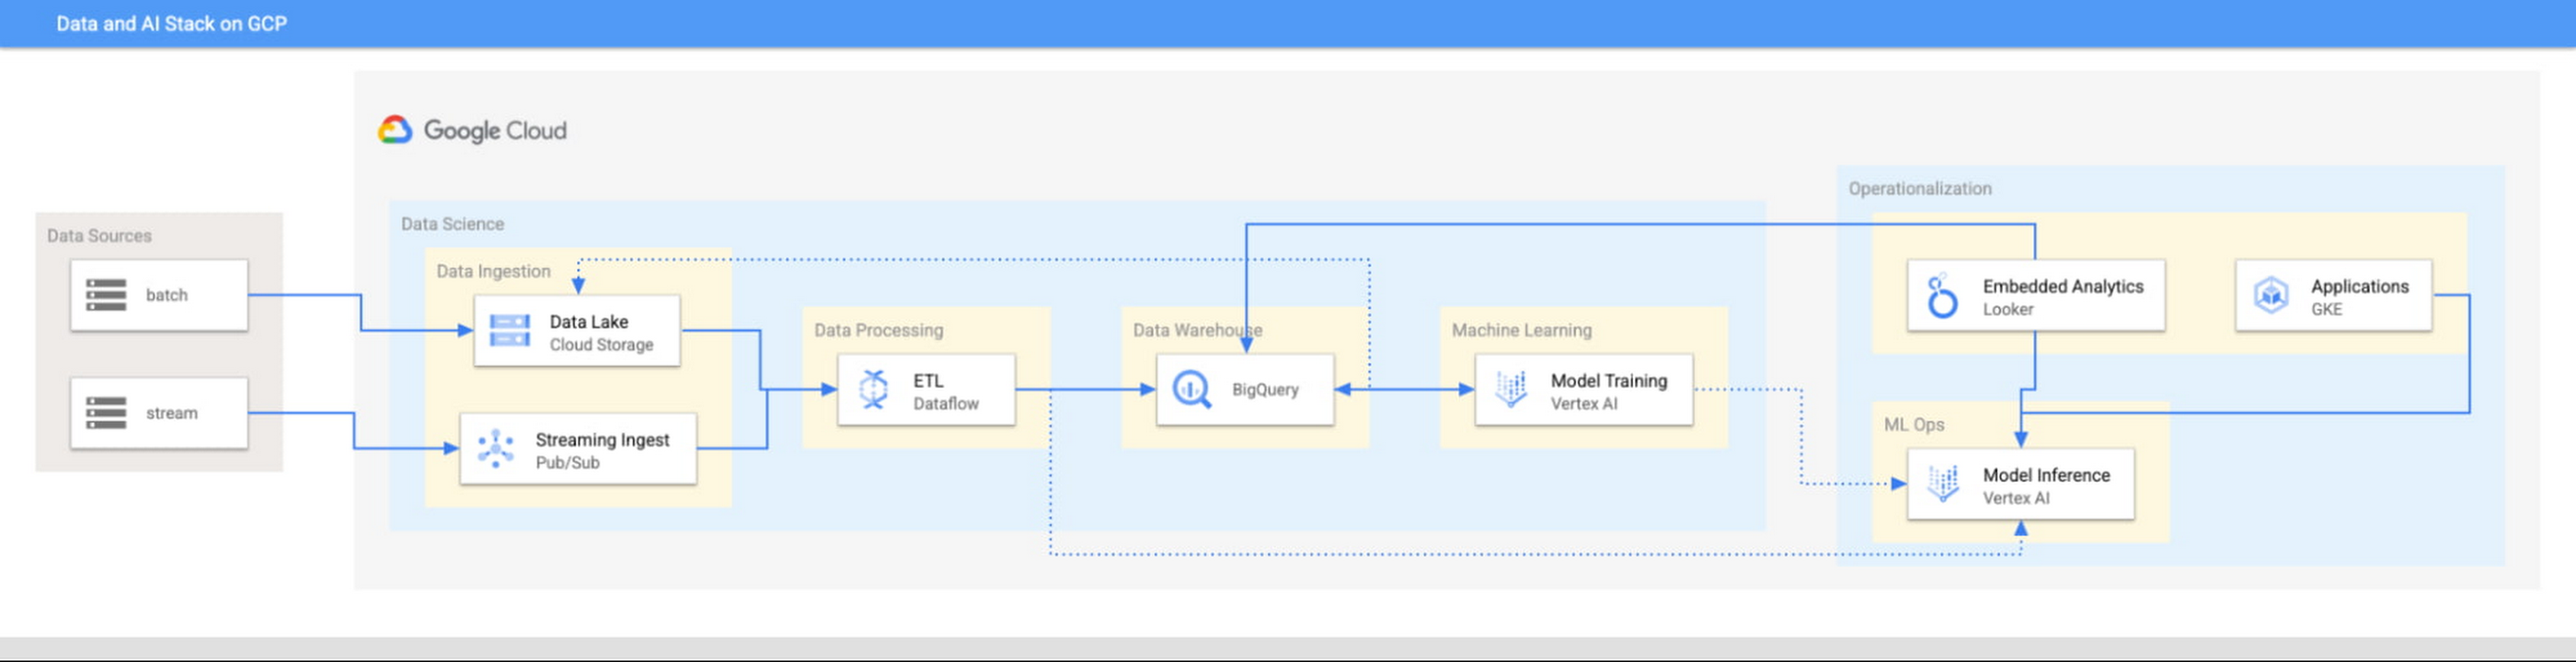
This focus has definitely informed how we create products at Google Cloud, as our canonical data stack—Pub/Sub, Dataflow, BigQuery, and Vertex AI—consists of auto-scaling and serverless products.
But management of infrastructure is not the only place where you should err toward a less-is-more philosophy.
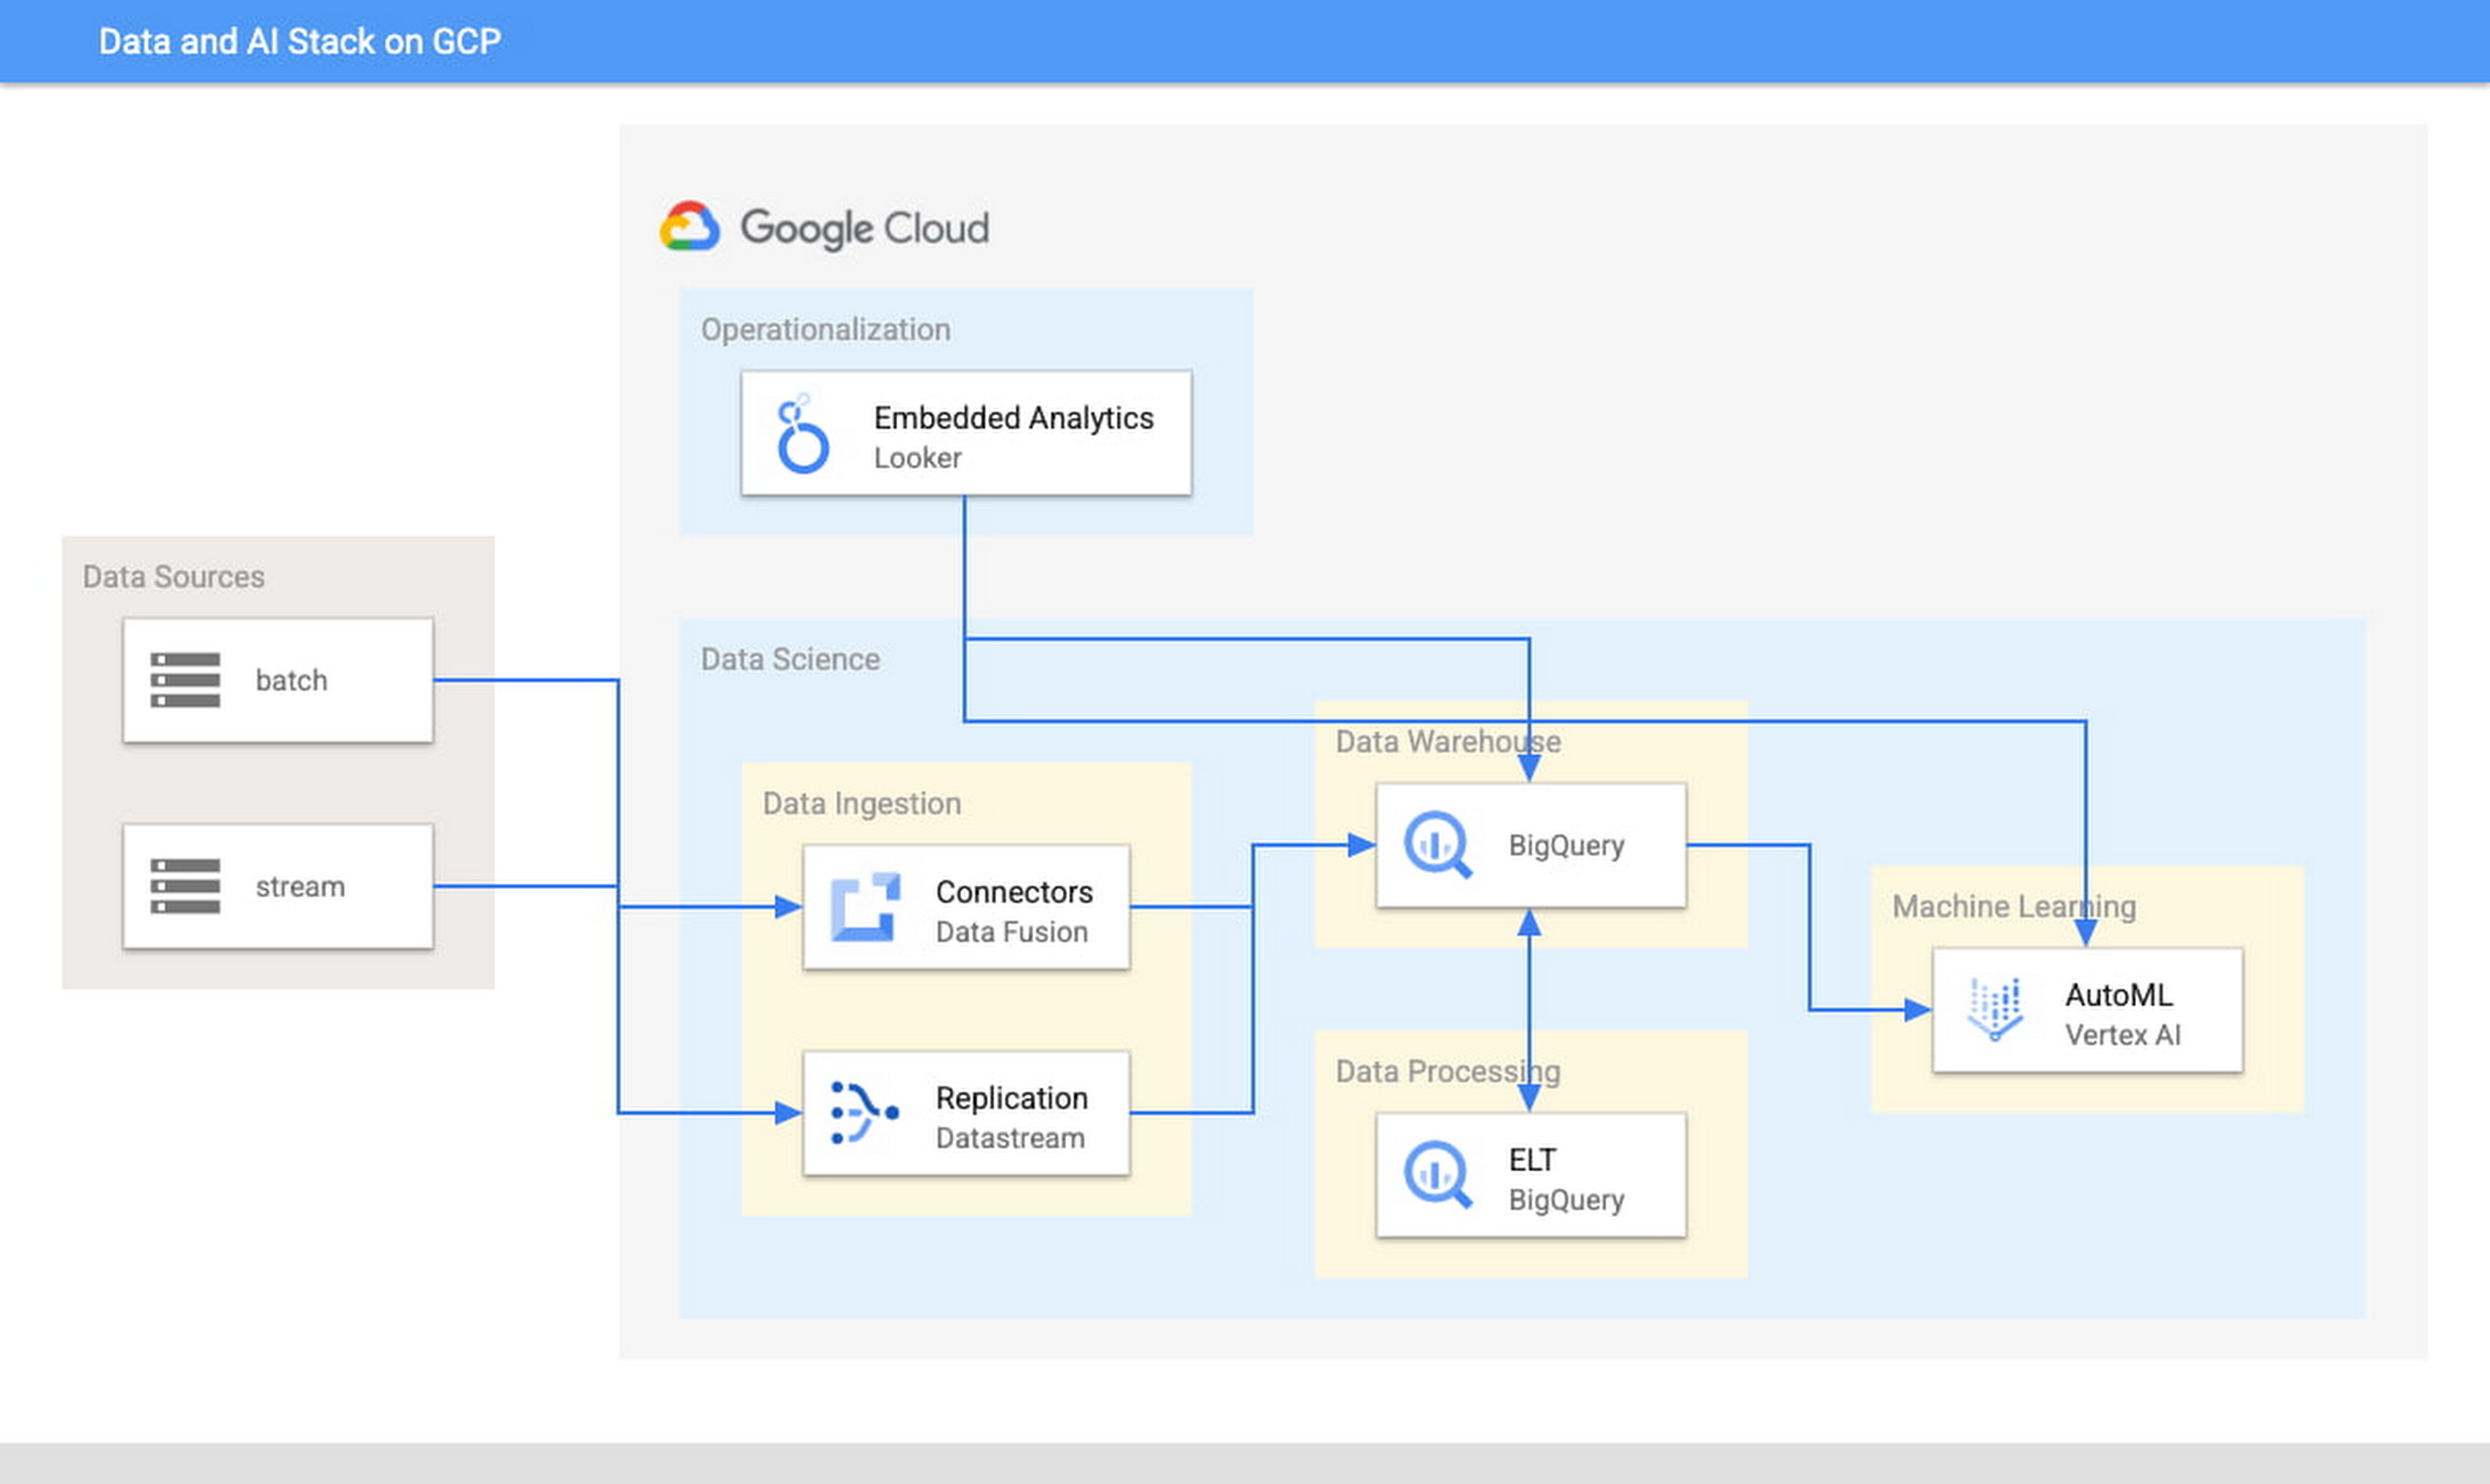
When it comes to architecture, choose no-code over low-code and low-code over writing custom code. For example, rather than writing ETL pipelines to transform the data you need before you land it into BigQuery, you could use pre-built connectors to directly land the raw data into BigQuery. That’s no code right there. Then, transform the data into the form you need using SQL views directly in the data warehouse. This is called ELT, and it is low code. You will be a lot more agile if you choose an ELT approach over an ETL approach.
Another place is when you choose your ML modeling framework. Don’t start with custom TensorFlow models. Start with AutoML. That’s no-code. You can invoke AutoML directly from BigQuery, avoiding the need to build complex data and ML pipelines. If necessary, move on to pre-built models from TensorFlow Hub, HuggingFace, etc. That’s low-code. Build your own custom ML models only as a last resort.
Focus on getting your vision to market, not chasing technology hype
The goal is to pick the right technology stack for bringing your vision to market, generating value for customers, conserving resources, and maintaining flexibility for growth. Early IT investments should usually gravitate toward things that preserve flexibility, such as managed services built on standard protocols or open APIs, but they needn’t always rush to the flashiest technologies. The answer isn’t always ML, for example. The answer might be heuristics to start, with a path to ML once you have collected enough data. You want to make sure that your intelligence layer has enough abstraction so you can mark it up with simple rules at first, but then replace it with a more robust system as you go along.
Launch and iterate fast with these principles
The preceding discussion is a reminder that your most expensive resource is your people—and that you really want them to be focused on building your prototype, minimum viable product or production app You want to launch fast and iterate fast, and the only way you can do that is by focusing on the things that differentiate you.
But regardless of the technologies you use, the bottom line is the same: follow these four principles.
- Figure out your major value proposition and design your tech stack around it.
- Be very careful about user interactions. User experience is super important; you need to make sure you deliver the kind of experience that your customers have grown to expect.
- When you’re building, pick the highest possible level of abstraction possible—the most fully managed tools and no-code/low-code frameworks that give you the functionality that you need.
- Instead of choosing new or flashy technologies, consider if you can build a “good enough” minimum viable product quickly and come back to a better implementation later.
To learn more about why startups are choosing Google Cloud, click here.
Skyscanner Supercharges Ability to Turn Raw Data into Deep Understanding of Consumer Behaviour, Conversion Jumps 40%

3810
Of your peers have already read this article.
2:30 Minutes
The most insightful time you'll spend today!
Skyscanner is a leading global travel search company covering flights, hotels, and car hire around the world. Founded in 2003, the company helps over 40 million people each month find the best travel options across its portfolio of websites and mobile apps.
Skyscanner wanted to understand the anonymized behaviour of consumers on a more granular level than was possible via standard reports in the Google Analytics Premium web interface or even using the reporting APIs.
“These methods work well for high-level analysis and standard marketing reporting, but we were keen to dig deeper into the data to get more insight and further optimise our products,” explains Mark Shilton, Principal Analyst in the Skyscanner Data Team.
For example, the company wanted to create detailed cohorts to understand how users interacted with Skyscanner over time. Also, different teams in the business were keen to understand the performance of individual pieces of functionality that fell within their remit.
To do this, they needed to understand not just the overall conversion rate, but how users who interact with a given piece of functionality convert compared to those who do not. Skyscanner also wanted drill down into specific markets, devices types, and marketing channels.
Mapping a plan for deeper insights
Skyscanner opted to address all of these needs by integrating Google Analytics Premium with BigQuery. The integration has become the starting point for many detailed investigations across the business.
For example, analysts and engineers now run cohort analyses to understand how frequently users return to Skyscanner and which channels are most effective at which part of the customer journey.
“This type of analysis is allowing a much deeper understanding of our marketing activity and is informing our future strategy and spend,” Mark says.
He reveals that using BigQuery in conjunction with other tools such as Tableau and Python also helps Skyscanner execute analysis much more quickly and efficiently than before.
“While in the past it was tricky to get a fully unsampled report based on specific segments of users flowing directly from Google Analytics Premium into a Tableau dashboard, now it is simply a matter of writing the query, creating a connection in Tableau to automatically refresh the data daily, and publishing this dashboard to the rest of the company.”
Another key benefit of using a flexible combination of tools is the ability to keep an eye on costs.
“Where the aggregations and segments of data are required on a regular basis, we have to consider the potential cost of querying the entire BigQuery dataset multiple times for the same data,” Mark explains. “To minimise this, we use Python scripts to automate these aggregations into new, smaller tables that are much more cost efficient to query.”
Excellent visibility and a clear path ahead
Combining Google Analytics Premium with BigQuery has supercharged Skyscanner’s ability to turn raw data into deep understanding of consumer behaviour.
“We have been using BigQuery for various pieces of analysis, from one-off investigations to powering daily dashboards,” Mark affirms. “In all cases it has speeded up our workflow and enabled us to gain greater insight more quickly. In a fast moving internet economy, this is key. Instead of setting up and scheduling one or more unsampled API reports, analysts can now write a query against BigQuery and have results almost instantly.”
“BigQuery has also allowed us to more easily isolate the effects of marketing from the effects of site changes,” Mark says. “By writing queries that focus on the conversion rate from specific pages in the funnel, we can better segment our traffic. We can separate traffic from various sources, including: specific marketing campaigns, users who make it to specific parts of the funnel, or users who interact with new functionality. This greater understanding has played a key role in improving overall conversion rates on our websites, particularly on mobile where we’ve achieved conversion rate improvements of 30 to 40% on smartphone and tablet devices in the last six months.”
Looking to the future, Skyscanner’s next steps include exploring how this data can be used to segment, cluster, and classify users for machine learning analyses, which would not have been possible using standard reporting functionality.
More Relevant Stories for Your Company

How to Build a BI Dashboard With Google Data Studio and BigQuery
For as long as business intelligence (BI) has been around, visualization tools have played an important role in helping analysts and decision-makers quickly get insights from data. In our current era of big data analytics, that premise still holds. To provide an integrated platform for building BI dashboards on top

Wayfair Writes its Success Story with BigQuery for Internal Analytics
Editor’s note: Home-goods and furniture giant Wayfair first partnered up with Google Cloud to transform and scale its storefront—work that proved its value many times over during the unprecedented surge in ecommerce traffic during 2020. Today, we hear how BigQuery’s performance and cost optimization have transformed the company’s internal analytics


Best Practices for ML Engineering: 43 Rules from the World’s Best
To make great products: do machine learning like the great engineer you are, not like the great machine learning expert you aren’t. Most of the problems you will face are, in fact, engineering problems. Even with all the resources of a great machine learning expert, most of the gains come
