





2919
Of your peers have already watched this video.
14:00 Minutes
The most insightful time you'll spend today!
Productionizing TensorFlow on Google Cloud with TensorFlow Enterprise
Machine learning is transforming every aspect of our lives and developers and enterprises are using ML to build impactful solutions that drive business value.
TensorFlow is one of the most widely used production-ready frameworks for machine learning and it’s open-sourced by Google so that everyone can take advantage of these powerful tools.
But if you are an enterprise trying to use ML there are some challenges you may face.
To address the needs of AI-enabled businesses, Google recently introduced TensorFlow Enterprise. It incorporates enterprise-grade support, cloud scale performance, and Google Cloud-managed services.
Watch Sandeep Gupta, Product Manager, TensorFlow, to learn how to get started and why the best way for businesses to experience TensorFlow is with TensorFlow Enterprise.
Global Communication Made Easy with Translation Hub

2505
Of your peers have already read this article.
3:30 Minutes
The most insightful time you'll spend today!
Hello! ¡Hola! 你好! नमस्ते! Bonjour! Being greeted in your own language can instantly put a smile on your face, and organizations around the world recognize that messages become more inclusive and powerful when translated into many languages.
As the Head of Product Management for Translation AI at Google Cloud, I am always looking to make our user’s lives easier when it comes to language tools—like Google Cloud’s Document Translation API, which has been used to translate over 2.5 billion documents across Google Translate and our Cloud customers.
But during my time working on translation products, I have seen enterprise users making compromises, like sacrificing cost and speed of translation for quality, or paying much more for high-quality translations and making peace with the slow turnaround times and high costs. That’s why we are excited to see momentum building behind Translation Hub, which launched earlier this year. Built to address organizations’ localization and translation challenges and delight users with an incredibly intuitive and administratively simple offering, Translation Hub makes it easy to translate content at scale—users just need to select the files to be translated, choose the output languages, and then they’re off and running.
In this article, we’ll take a closer look at Translation Hub’s powerful features, and the ways it is helping customers do more with their content.
Enterprise translation, reimagined: fast, lean, and intuitive
Translation Hub is a fully-managed, self-serve translation offering, powered by Google AI and built for the enterprise. With Translation Hub, businesses can instantaneously translate content into 135 languages with a single click, via an intuitive interface that integrates human reviews (i.e., a “human in the loop”) where required.
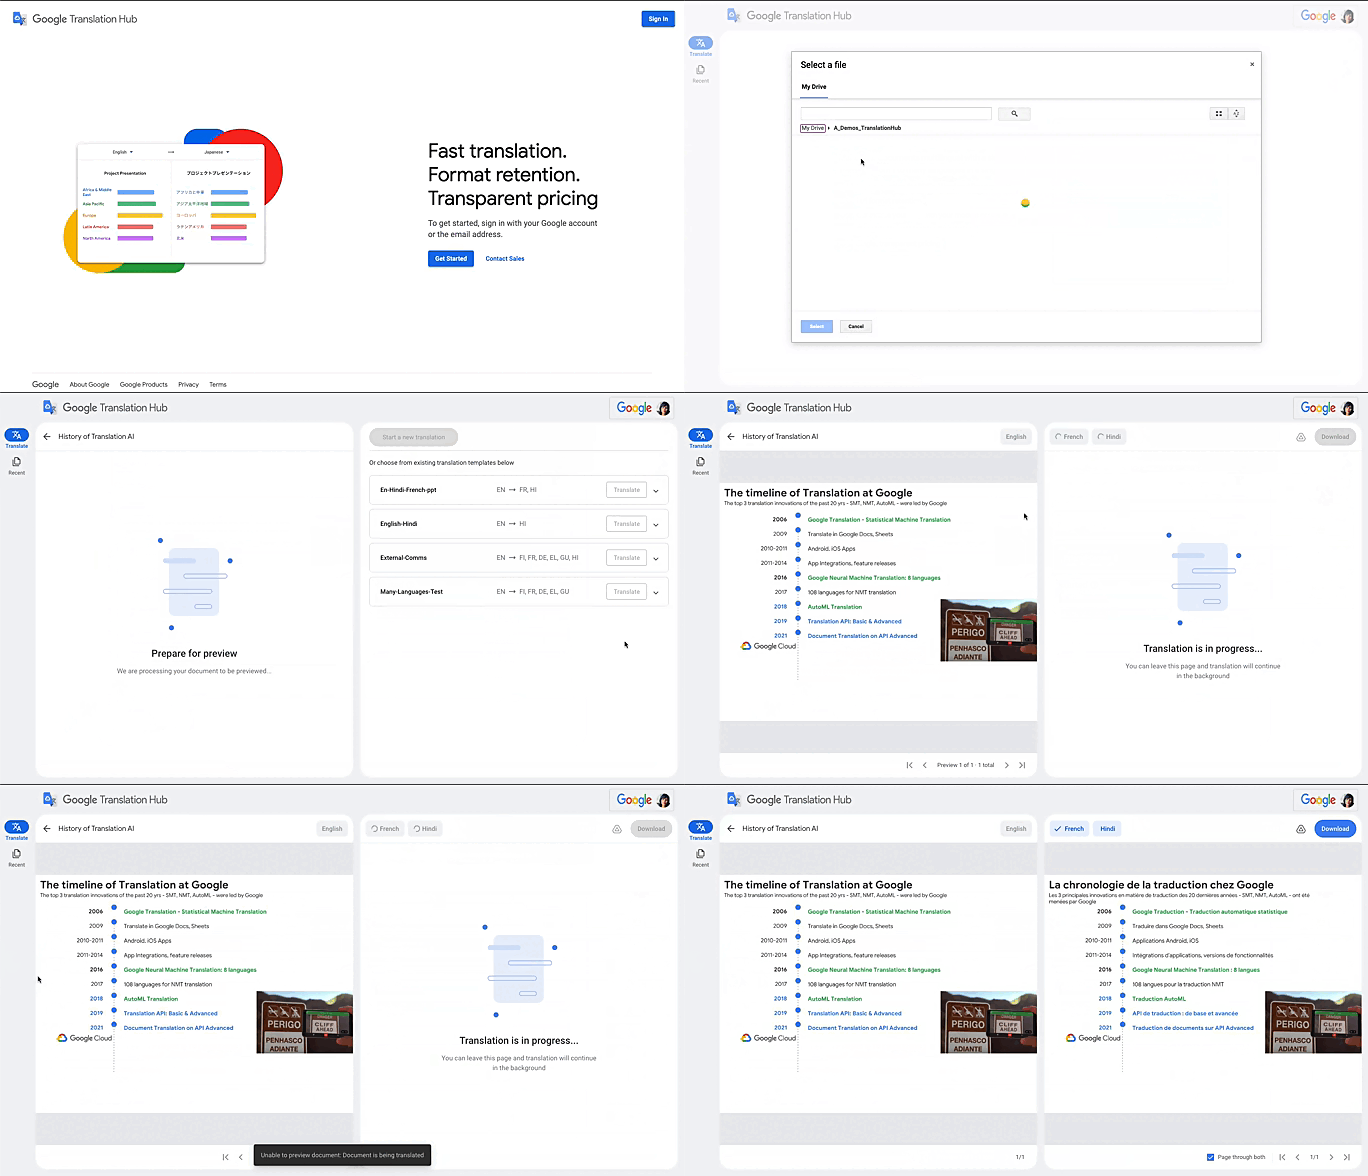
Translation Hub is designed to be both easy to manage and use. Each organization’s Translation Hub administrator uses the Google Cloud console to onboard and manage business users, typically by adding their email, which triggers an invite to the business user. Once a business user is added, they can sign in and start requesting translations and post-editing reviews.
With advanced features like “Glossary” and “Custom Translation Models (AutoML Translation),” Translation Hub makes it easy for enterprises to control the terminology and inject domain-specific context to meet their unique needs. Furthermore, Translation Hub ensures that organizations own their Translation Memory, for use in future translations or to leverage as a rich, human-validated source of training data for custom translation models (e.g., AutoML Translation). For example, when a user edits a phrase or segment through Translation Hub, this is immediately captured and used in the next translation for all future users who initiate translation where the same content or segment appears.
One of my favorite features is that Translation Hub preserves the layout and format of documents, saving both time and money. And while Translation Hub works with Google Drive (you can ingest and export documents to Drive) and is compatible with all our Google Workspace content sources (e.g., Slides, Docs etc.), it also supports many of the most commonly used formats, like documents and presentations created in Microsoft Office, and scanned and native PDFs.
Organizations need to be able to share the output of AI-powered translation with localization teams or agencies, for review. They need to save time by leveraging glossaries or customer machine learning (ML) models. They need these capabilities in one cohesive platform—and they need all of this to be user-friendly for all kinds of business users. It’s the difference between being able to automate translations in a few scenarios and being able to translate at scale. Google Cloud’s mission is to accelerate every organization’s ability to digitally transform, and with Translation Hub, our customers can leverage the best of AI for their content translations without sacrificing speed, quality or cost.
All of Google’s Translation Innovations within a single product
Translation Hub uses Google Cloud’s Translation API, AutoML Translation, and innovations in Neural Machine Translation Quality Prediction and Translation Memory—all technologies we’ve put to good use inside Google. For example, our localization teams have realized more than $80 million in cost avoidance and savings since 2021, using Google Cloud AutoML Translation and localization expertise.
“In just three months of using Translation Hub and AutoML translation models, we saw our translated page count go up by 700% and translation cost reduced by 90%,” said Murali Nathan, digital innovation and employee experience lead, at materials science company Avery Dennison. “Beyond numbers, Google’s enterprise translation technology is driving a feeling of inclusion among our employees. Every Avery Dennison employee has access to on-demand, general purpose, and company-specific translations. English language fluency is no longer a barrier, and our employees are beginning to broadly express themselves right in their native language.”
To get started with Translation Hub, visit our solution page, and for a deep dive, check out this Google Next ‘22 session, including more details about Avery Dennison’s use case.
UKG Ready: Meeting the Needs of Complex Machine Learning Models and Distributed Data Sets

3983
Of your peers have already read this article.
2:30 Minutes
The most insightful time you'll spend today!
Business Problem
UKG Ready primarily operates in the Small and Medium Business (SMB) space, so inherently many customers are forced to operate and make key business decisions with less Workforce Management (WFM) / Human Capital Management (HCM) data. In addition to volume, SMB lacks the variety of data needed to create a dynamic and agile organization. This puts SMB at a major disadvantage compared to larger segments.
Project Goals
People Insights module is committed to surfacing insights to customers in the context of their day-to-day duties and aid in decision making. With the SMB customer data limitations mentioned above, the goal of this project was to create a global dataset that augments individual customer data to bring light to less obvious, yet important information.
Challenges
UKG Ready is a highly configurable application that gives customers the opportunity to build solutions on a platform that meets their specific business needs. High configurability gives high flexibility to customers in their usage of the software. However, it becomes nearly impossible to create a global dataset for machine learning and data insights. UKG Ready manages just under 4 million of the US workforce and some 30,000+ customers. Despite the large employee dataset size, machine learning models that are specific to customers are starved for data because the individual customers have a relatively small employee population. Does that mean we cannot support our SMB customers’ decision making with ML?
Result
Partnering with Google, we were able to develop an approach that allowed us to standardize various domain entities (pay categories, time off codes, job titles, etc.) so that we could build a global dataset to augment SMB customer data. Using machine learning we were able to build a common vocabulary across our customer base. This common vocabulary encapsulates the nuances of how our customers manage their business and yet is generalized and standardized such that the data can be aggregated over the variety of customer configurations. This allows us to serve up practical insights to customers through various use cases. Our partnership allowed us to leverage Google Cloud Services to meet the needs of our complex machine learning models, distributed data sets and CI/CD processes.
How
UKG Ready decided to partner with Google for an end-to-end solution for the analytics offering. This allowed us to focus on our core business logic without having to worry about the platform, environment configurations, performance and scalability of the entire solution. We make use of various Google Cloud services such as Cloud Triggers, Cloud Storage, Cloud Functions, Cloud Composer, Cloud Dataflow, Big Query, Vertex AI, Cloud Pub/Sub… to host our analytics solution. Jenkins manages the entire CI/CD pipelines and cloud environments are configured and deployed using Terraform.
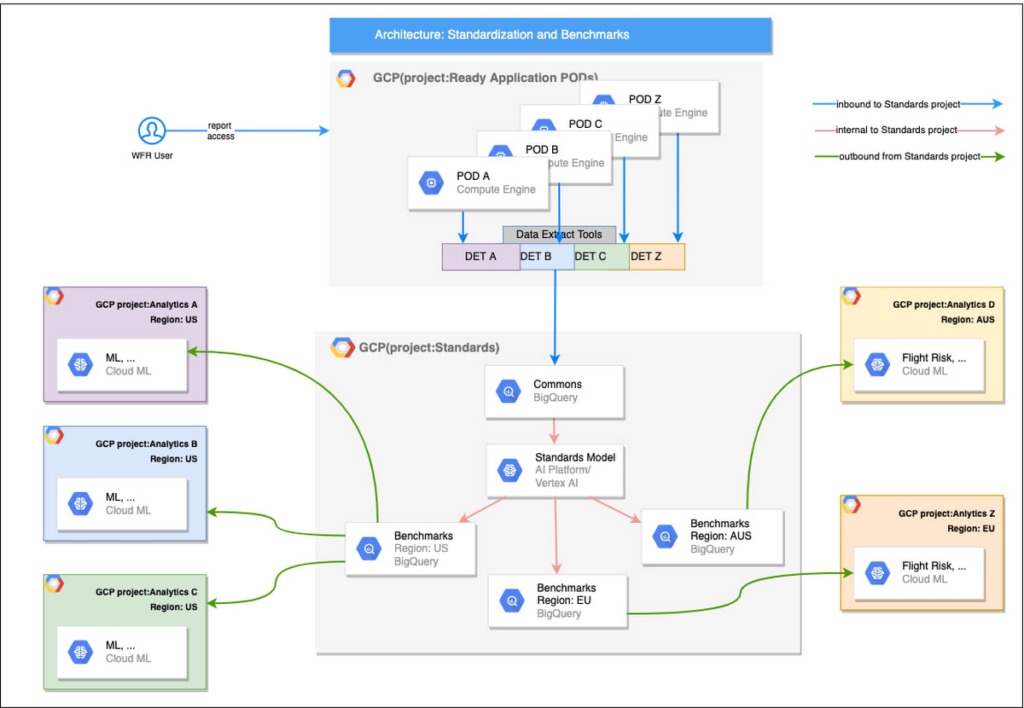
The standardization of business entities problem was solved in three distinct steps:
Step 1: Collecting aggregated data
We needed an approach to collect aggregated data from our highly distributed, sharded, multi-tenant data sources. We developed a custom solution that allows us to extract data aggregated at source for PII and GDPR considerations and transfer to Google Cloud Storage in the fastest manner possible. Data is then transformed and stored in Big Query. Services used: GCS, Cloud Functions, DataFlow, Cloud Composer and Big Query. All processes are orchestrated using Cloud Composer and detailed logging is available in Cloud Logging (Stackdriver).
Step 2: Applying NLP (Natural Language Processing)
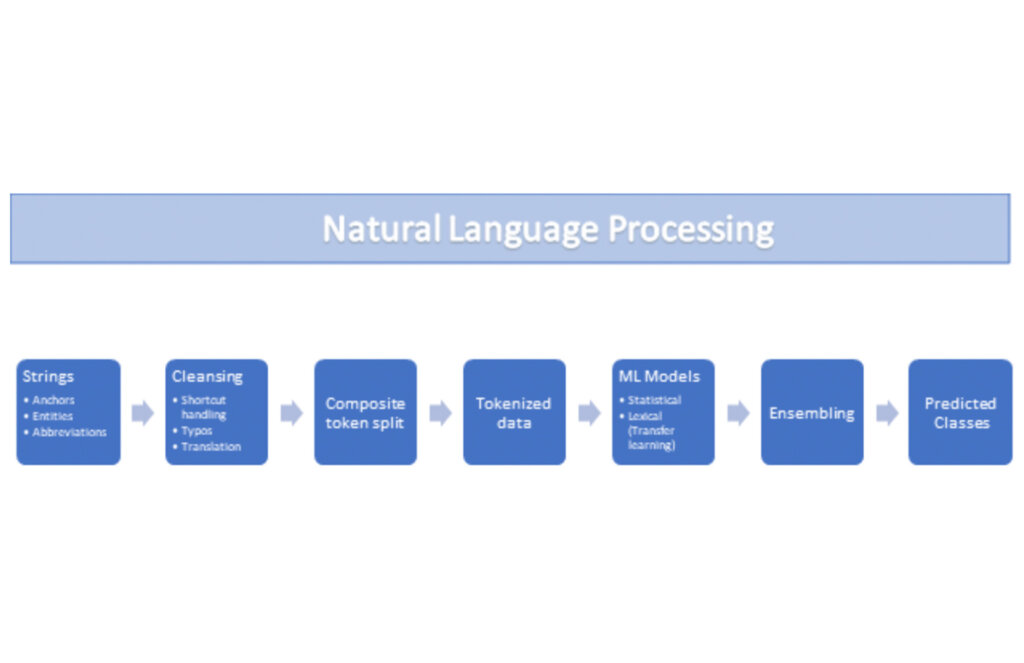
Once we had the variety of customer configurations or the business entities available, we then applied NLP algorithms to categorize and standardize these in buckets. This approach assumes that customers use natural language for configurations like job titles, pay codes etc.
String Preparation
The input data for string preparation process is an entity string or several strings, that describe one entity object (like name-description pair or code-name pair). The output represents set of tokens that may be used to run a classification/clustering model. The process of string preparation tokenizes strings, replaces shortcuts, handles abbreviations, translates tokens, handles grammatical errors and mistypes
ML Models
Statistical
The idea of the model is to use defined target classes (clusters) and assign several tokens (anchors) to each of them an entity that has any of those tokens would be “attracted” to appropriate class. All other tokens are weighted according to frequencies of usage of theses tokens in the entities with anchor tokens:
Using anchor tokens, we are building kind-of Word2Vec - dimensionality of vector is equal to number of target classes. The higher the specific dimension (cluster) value, the higher the probability of entity to be included in appropriate cluster. Final prediction for entity tokens list for specific class is sum of weights of all the tokens included. Predicted cluster is a cluster that has maximal prediction score.
Lexical Model
We managed to generate reasonable amount of labeled data during statistical model implementation and testing. That opens a possibility to build “classical” NLP model that uses labeled data to train classification neural network using pretrained layers to produce token embeddings or even string embeddings. We started experimentation with pre-trained models like GloVe and got good results with single words and bi-grams but started getting issues in handling of n-grams. Our Google account team came to our rescue and recommended some white papers that helped formulate our strategy. We now use Tensorflow nnlm-en-dim128 model to produce string embeddings – it was trained on 200B records English Google News corpus and produces for each input string 128-dimensional vector. After that we use several Dense and Dropout layers to build a classification model.
Ensembling
To perform ensembling all the model results for each class are cast to probabilities using softmax transformation with scale normalization. Final predicted probability is maximal average score of both models among all the classes scores – appropriate class is predicted class.
The machine learning models are deployed on Vertex AI and are used in batch predictions. Model performance is captured at every prediction boundary and monitored for quality in production.
Step 3: Making available common vocabulary
Having the standardized vocabulary, we then needed a mechanism to have the results be available in UKG Ready reports and customer specific models like Flight Risk and Fatigue. For this we again used Google Services for orchestration, data transformation and data storage.
Once the modeling is complete, we made the customer specific models leveraging the above architecture be available in Reports. We utilized our proven existing technology choices in GCP for orchestration, data transformation and data storage
Results
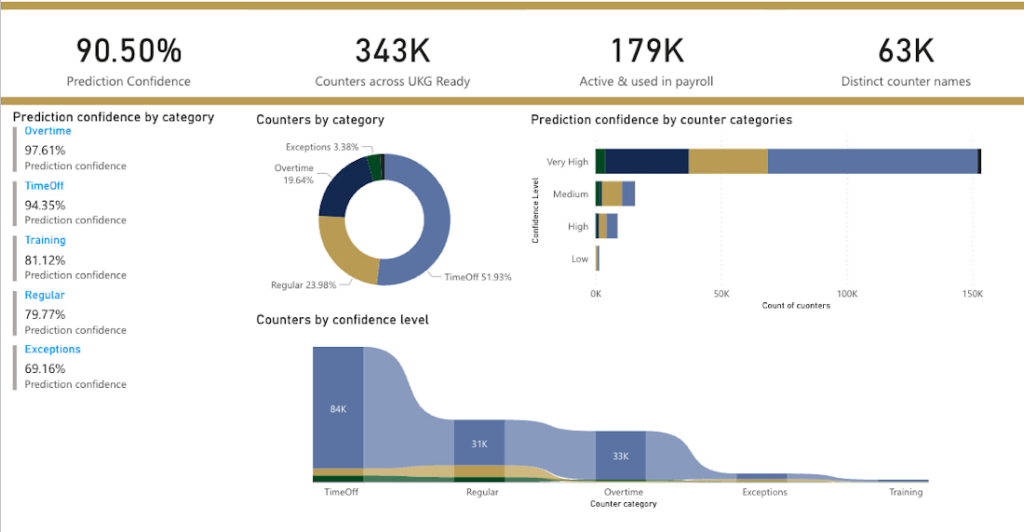
We are able to build a common vocabulary of our customers’ business entities with good confidence. And be an expert advisor to our SMB customers in their decision-making using machine learning. With the advice of our Google account team and using Google services we can add value to our product in a relatively short amount of time. And we are not done! We continue to use this platform for new use cases, complex business problems and innovative machine learning solutions.
Sample result:
Special thanks to Kanchana Patlolla , AI Specialist, Google for the collaboration in bringing this to light
6460
Of your peers have already watched this video.
1:30 Minutes
The most insightful time you'll spend today!
Value Realization with Google Cloud for Retail SAP Data
Retail engagements have changed drastically over the last few years, and by the virtue of COVID-19 pandemic, retail data and customers’ expectations plummeted. To drive value and transformation across the entire value-chain retailers can make most of Google Cloud’s secure, reliable IaaS by migrating their SAP systems and taking advantage of integrations, insights and innovations. In times of change retail companies can gain maximum visibility of SAP data unlocking Google Cloud’s infrastructure modernization and Big Data and analytics capabilities. Watch the video to understand how Google Cloud and SAP partnership is a golden handshake for retail businesses’ future.
10177
Of your peers have already watched this video.
1:00 Minutes
The most insightful time you'll spend today!
Predict User Churn on Gaming Apps with Google Analytics Data using BigQuery ML
User retention can be a major challenge for mobile game developers. According to the Mobile Gaming Industry Analysis in 2019, most mobile games only see a 25% retention rate for users after the first day. To retain a larger percentage of users after their first use of an app, developers can take steps to motivate and incentivize certain users to return. But to do so, developers need to identify the propensity of any specific user returning after the first 24 hours.
In this blog post, we will discuss how you can use BigQuery ML to run propensity models on Google Analytics 4 data from your gaming app to determine the likelihood of specific users returning to your app.
You can also use the same end-to-end solution approach in other types of apps using Google Analytics for Firebase as well as apps and websites using Google Analytics 4. To try out the steps in this blogpost or to implement the solution for your own data, you can use this Jupyter Notebook.
Using this blog post and the accompanying Jupyter Notebook, you’ll learn how to:
- Explore the BigQuery export dataset for Google Analytics 4
- Prepare the training data using demographic and behavioural attributes
- Train propensity models using BigQuery ML
- Evaluate BigQuery ML models
- Make predictions using the BigQuery ML models
- Implement model insights in practical implementations
Google Analytics 4 (GA4) properties unify app and website measurement on a single platform and are now default in Google Analytics. Any business that wants to measure their website, app, or both, can use GA4 for a more complete view of how customers engage with their business. With the launch of Google Analytics 4, BigQuery export of Google Analytics data is now available to all users. If you are already using a Google Analytics 4 property, you can follow this guide to set up exporting your GA data to BigQuery.
Once you have set up the BigQuery export, you can explore the data in BigQuery. Google Analytics 4 uses an event-based measurement model. Each row in the data is an event with additional parameters and properties. The Schema for BigQuery Export can help you to understand the structure of the data.
In this blogpost, we use the public sample export data from an actual mobile game app called “Flood It!” (Android, iOS) to build a churn prediction model. But you can use data from your own app or website.
Here’s what the data looks like. Each row in the dataset is a unique event, which can contain nested fields for event parameters.
SELECT *FROM `firebase-public-project.analytics_153293282.events_*`TABLESAMPLE SYSTEM (1 PERCENT)

This dataset contains 5.7M events from over 15k users.
SELECTCOUNT(DISTINCT user_pseudo_id) as count_distinct_users,COUNT(event_timestamp) as count_eventsFROM`firebase-public-project.analytics_153293282.events_*

Our goal is to use BigQuery ML on the sample app dataset to predict propensity to user churn or not churn based on users’ demographics and activities within the first 24 hours of app installation.

In the following sections, we’ll cover how to:
- Pre-process the raw event data from GA4
- Identify users & the label feature
- Process demographic features
- Process behavioral features
- Train classification model using BigQuery ML
- Evaluate the model using BigQueryML
- Make predictions using BigQuery ML
- Utilize predictions for activation
Pre-process the raw event data
You cannot simply use raw event data to train a machine learning model as it would not be in the right shape and format to use as training data. So in this section, we’ll go through how to pre-process the raw data into an appropriate format to use as training data for classification models.
This is what the training data should look like for our use case at the end of this section:

Notice that in this training data, each row represents a unique user with a distinct user ID (user_pseudo_id).
Identify users & the label feature
We first filtered the dataset to remove users who were unlikely to return the app anyway. We defined these ‘bounced’ users as ones who spent less than 10 mins with the app. Then we labeled all remaining users:
- churned: No event data for the user after 24 hours of first engaging with the app.
- returned: The user has at least one event record after 24 hours of first engaging with the app.
For your use case, you can have a different definition of bounce and churning. Also you can even try to predict something else other than churning, e.g.:
- whether a user is likely to spend money on in-game currency
- likelihood of completing n-number of game levels
- likelihood of spending n amount of time in-game etc.
In such cases, label each record accordingly so that whatever you are trying to predict can be identified from the label column.
From our dataset, we found that ~41% users (5,557) bounced. However, from the remaining users (8,031), ~23% (1,883) churned after 24 hours:
SELECTbounced,churned,COUNT(churned) as count_usersFROMbqmlga4.returningusersGROUP BY 1,2ORDER BY bounced

To create these bounced and churned columns, we used the following snippet of SQL code.
...#churned = 1 if last_touch within 24 hr of app installation, else 0IF (user_last_engagement < TIMESTAMP_ADD(user_first_engagement,INTERVAL 24 HOUR),1,0 ) AS churned,#bounced = 1 if last_touch within 10 min, else 0IF (user_last_engagement <= TIMESTAMP_ADD(user_first_engagement,INTERVAL 10 MINUTE),1,0 ) AS bounced,...
You can view the Jupyter Notebook for the full query used for materializing the bounced and churned labels.
Process demographic features
Next, we added features both for demographic data and for behavioral data spanning across multiple columns. Having a combination of both demographic data and behavioral data helps to create a more predictive model.
We used the following fields for each user as demographic features:
geo.countrydevice.operating_systemdevice.language
A user might have multiple unique values in these fields — for example if a user uses the app from two different devices. To simplify, we used the values from the very first user engagement event.
CREATE OR REPLACE VIEW bqmlga4.user_demographics AS (WITH first_values AS (SELECTuser_pseudo_id,geo.country as country,device.operating_system as operating_system,device.language as language,ROW_NUMBER() OVER (PARTITION BY user_pseudo_id ORDER BY event_timestamp DESC) AS row_numFROM `firebase-public-project.analytics_153293282.events_*`WHERE event_name="user_engagement")SELECT * EXCEPT (row_num)FROM first_valuesWHERE row_num = 1 #first engagement);
Process behavioral features
There is additional demographic information present in the GA4 export dataset, e.g. app_info, device, event_params, geo etc. You may also send demographic information to Google Analytics through each hit via user_properties. Furthermore, if you have first-party data on your own system, you can join that with the GA4 export data based on user_ids.
To extract user behavior from the data, we looked into the user’s activities within the first 24 hours of first user engagement. In addition to the events automatically collected by Google Analytics, there are also the recommended events for games that can be explored to analyze user behavior. For our use case, to predict user churn, we counted the number of times the follow events were collected for a user within 24 hours of first user engagement:
user_engagementlevel_start_quickplaylevel_end_quickplaylevel_complete_quickplaylevel_reset_quickplaypost_scorespend_virtual_currencyad_rewardchallenge_a_friendcompleted_5_levelsuse_extra_steps
The following query shows how these features were calculated:
WITHevents_first24hr AS (SELECTe.*FROM`firebase-public-project.analytics_153293282.events_*` eJOINbqmlga4.returningusers rONe.user_pseudo_id = r.user_pseudo_idWHERETIMESTAMP_MICROS(e.event_timestamp) <= r.ts_24hr_after_first_engagement)SELECTuser_pseudo_id,SUM(IF(event_name = 'user_engagement', 1, 0)) AS cnt_user_engagement,# ... repeated for all behavior data ...SUM(IF(event_name = 'use_extra_steps', 1, 0)) AS cnt_use_extra_steps,FROMevents_first24hrGROUP BY1
View the notebook for the query used to aggregate and extract the behavioral data. You can use different sets of events for your use case. To view the complete list of events, use the following query:
SELECTevent_name,COUNT(event_name) as event_countFROM`firebase-public-project.analytics_153293282.events_*`GROUP BY 1ORDER BYevent_count DESC
After this we combined the features to ensure our training dataset reflects the intended structure. We had the following columns in our table:
- User ID:
user_pseudo_id
- Label:
churned
- Demographic features
countrydevice_osdevice_language
- Behavioral features
cnt_user_engagementcnt_level_start_quickplaycnt_level_end_quickplaycnt_level_complete_quickplaycnt_level_reset_quickplaycnt_post_scorecnt_spend_virtual_currencycnt_ad_rewardcnt_challenge_a_friendcnt_completed_5_levelscnt_use_extra_stepsuser_first_engagement
At this point, the dataset was ready to train the classification machine learning model in BigQuery ML. Once trained, the model will output a propensity score between churn (churned=1) or return (churned=0) indicating the probability of a user churning based on the training data.
Train classification model
When using the CREATE MODEL statement, BigQuery ML automatically splits the data between training and test. Thus the model can be evaluated immediately after training (see the documentation for more information).
For the ML model, we can choose among the following classification algorithms where each type has its own pros and cons:

Often logistic regression is used as a starting point because it is the fastest to train. The query below shows how we trained the logistic regression classification models in BigQuery ML.
CREATE OR REPLACE MODEL bqmlga4.churn_logregTRANSFORM(EXTRACT(MONTH from user_first_engagement) as month,EXTRACT(DAYOFYEAR from user_first_engagement) as julianday,EXTRACT(DAYOFWEEK from user_first_engagement) as dayofweek,EXTRACT(HOUR from user_first_engagement) as hour,* EXCEPT(user_first_engagement, user_pseudo_id))OPTIONS(MODEL_TYPE="LOGISTIC_REG",INPUT_LABEL_COLS=["churned"]) ASSELECT*FROMbqmlga4.train
We extracted month, julianday, and dayofweek from datetimes/timestamps as one simple example of additional feature preprocessing before training. Using TRANSFORM() in your CREATE MODEL query allows the model to remember the extracted values. Thus, when making predictions using the model later on, these values won’t have to be extracted again. View the notebook for the example queries to train other types of models (XGBoost, deep neural network, AutoML Tables).
Evaluate model
Once the model finished training, we ran ML.EVALUATE to generate precision, recall, accuracy and f1_score for the model:
SELECT*FROMML.EVALUATE(MODEL bqmlga4.churn_logreg)

The optional THRESHOLD parameter can be used to modify the default classification threshold of 0.5. For more information on these metrics, you can read through the definitions on precision and recall, accuracy, f1-score, log_loss and roc_auc. Comparing the resulting evaluation metrics can help to decide among multiple models.Furthermore, we used a confusion matrix to inspect how well the model predicted the labels, compared to the actual labels. The confusion matrix is created using the default threshold of 0.5, which you may want to adjust to optimize for recall, precision, or a balance (more information here).
SELECTexpected_label,_0 AS predicted_0,_1 AS predicted_1FROMML.CONFUSION_MATRIX(MODEL bqmlga4.churn_logreg)

This table can be interpreted in the following way:

Make predictions using BigQuery ML
Once the ideal model was available, we ran ML.PREDICT to make predictions. For propensity modeling, the most important output is the probability of a behavior occurring. The following query returns the probability that the user will return after 24 hrs. The higher the probability and closer it is to 1, the more likely the user is predicted to return, and the closer it is to 0, the more likely the user is predicted to churn.
SELECTuser_pseudo_id,returned,predicted_returned,predicted_returned_probs[OFFSET(0)].prob as probability_returnedFROMML.PREDICT(MODEL bqmlga4.churn_logreg,(SELECT * FROM bqmlga4.train)) #can be replaced with a proper test dataset
Utilize predictions for activation
Once the model predictions are available for your users, you can activate this insight in different ways. In our analysis, we used user_pseudo_id as the user identifier. However, ideally, your app should send back the user_id from your app to Google Analytics. In addition to using first-party data for model predictions, this will also let you join back the predictions from the model into your own data.
- You can import the model predictions back into Google Analytics as a user attribute. This can be done using the Data Import feature for Google Analytics 4. Based on the prediction values you can Create and edit audiences and also do Audience targeting. For example, an audience can be users with prediction probability between 0.4 and 0.7, to represent users who are predicted to be “on the fence” between churning and returning.
- For Firebase Apps, you can use the Import segments feature. You can tailor user experience by targeting your identified users through Firebase services such as Remote Config, Cloud Messaging, and In-App Messaging. This will involve importing the segment data from BigQuery into Firebase. After that you can send notifications to the users, configure the app for them, or follow the user journeys across devices.
- Run targeted marketing campaigns via CRMs like Salesforce, e.g. send out reminder emails.
You can find all of the code used in this blogpost in the Github repository:
What’s next?
Continuous model evaluation and re-training
As you collect more data from your users, you may want to regularly evaluate your model on fresh data and re-train the model if you notice that the model quality is decaying.
Continuous evaluation—the process of ensuring a production machine learning model is still performing well on new data—is an essential part in any ML workflow. Performing continuous evaluation can help you catch model drift, a phenomenon that occurs when the data used to train your model no longer reflects the current environment.
To learn more about how to do continuous model evaluation and re-train models, you can read the blogpost: Continuous model evaluation with BigQuery ML, Stored Procedures, and Cloud Scheduler
More resources
If you’d like to learn more about any of the topics covered in this post, check out these resources:
- BigQuery export of Google Analytics data
- BigQuery ML quickstart
- Events automatically collected by Google Analytics 4
- Qwiklabs: Create ML models with BigQuery ML
Or learn more about how you can use BigQuery ML to easily build other machine learning solutions:
- How to build demand forecasting models with BigQuery ML
- How to build a recommendation system on e-commerce data using BigQuery ML
Let us know what you thought of this post, and if you have topics you’d like to see covered in the future! You can find us on Twitter at @polonglin and @_mkazi_.Thanks to reviewers: Abhishek Kashyap, Breen Baker, David Sabater Dinter.
Lufthansa: Wind Forecasting with Google Cloud ML Helps Increase On-time Flights

2510
Of your peers have already read this article.
3:30 Minutes
The most insightful time you'll spend today!
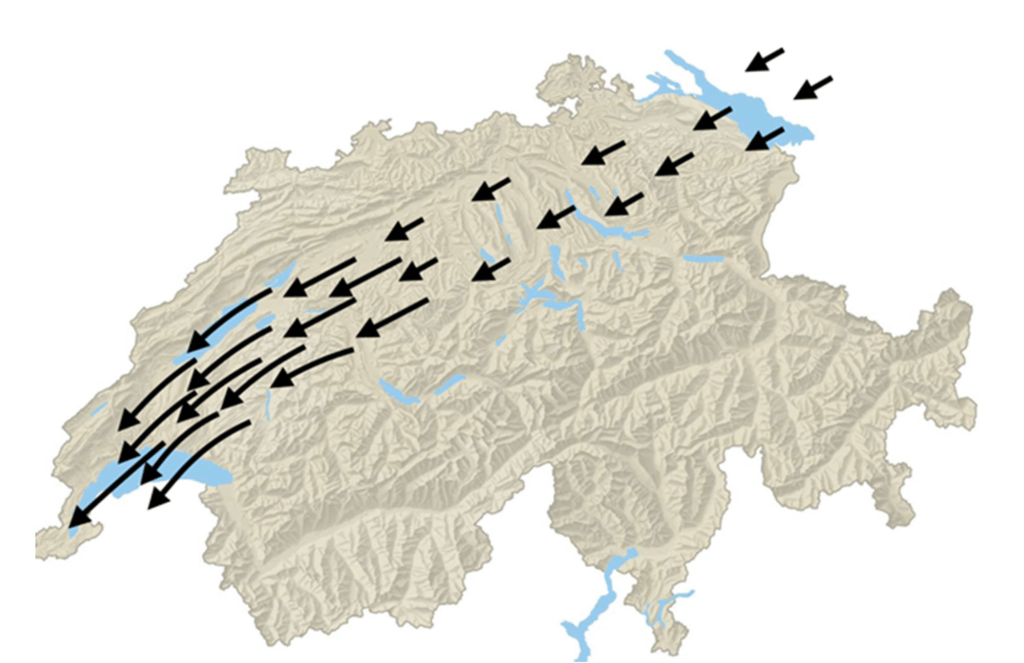
The magnitude and direction of wind significantly impacts airport operations, and Lufthansa Group Airlines are no exception. A particularly troublesome kind is called BISE: it is a cold, dry wind that blows from the northeast to southwest in Switzerland, through the Swiss Plateau. Its effects on flight schedules can be severe, such as forcing planes to change runways, which can create a chain reaction of flight delays and possible cancellations. In Zurich Airport, in particular, BISE can potentially reduce capacity by up to 30%, leading to further flight delays and cancellations, and to millions in lost revenue for Lufthansa (as well as dissatisfaction among their passengers).
Being able to predict this kind of wind well in advance lets the Network Operations Control team schedule flight operations optimally across runways and timeslots, to minimize disruptions to the schedule. However, predicting speed and magnitude can be incredibly difficult to model and thus to predict— which is why Lufthansa reached out to Google Cloud.
Machine learning (ML) can help airports and airlines to better anticipate and manage these types of disruptive weather events. In this blog post, we’ll explore an experiment Lufthansa did together with Google Cloud and its Vertex AI Forecast service, accurately predicting BISE hours in advance, with more than 40% relative improvement in accuracy over internal heuristics, all within days instead of the months it often takes to do ML projects of this magnitude and performance.
“Being impressed with Google’s technology and prowess in the field of AI and machine learning, we were certain that my working together with their expert, to combine our technology with their domain expertise, we would achieve the best results possible,“ said Christian Most, Senior Director, Digital Operations Optimization at Lufthansa Group.
Collecting and preparing the dataset
The goal of Lufthansa and Google Cloud’s project was to forecast the BISE wind for Zurich’s Kloten Airport using deep learning-based ML approaches, then to see if the prediction surpasses internal heuristics-driven solutions and gauge the ease of use and practicality of the deep learning approach in production.
Since deep learning-based techniques require large datasets, the project relies on Meteoswiss simulation data, a dataset consisting of multiple meteorological sensor measurements collected from several weather stations across Switzerland over the past five years. By using this dataset, we obtained data on factors like wind direction, speed, pressure, temperature, humidity and more, at a 10 min resolution, along with some information about the location of the weather stations, such as altitude. These factors, which we hypothesized to be predictive of the BISE, ended up carrying valuable signals, as we would see later.
This collected data was next subjected to an extensive cleaning and feature engineering process using Vertex AI Workbench, in order to prepare the final dataset for training. The cleaning phase included steps to drop the features, or rows, that contained too many missing values, or failed statistical tests for entropy, etc. Since the direction of wind is a circular feature (between 0 and 360 degrees), this column/feature was replaced with two features: the corresponding sine and cosine embedding. The dataset was then flattened such that the columns contained all the relevant features and sensor measurements from all the weather stations at a particular 10-minute interval.
Since the target variable — i.e,. BISE — was not directly available, we engineered a proxy target variable for BISE called “tailwind speed around runway,” which above a certain threshold indicates the presence of BISE along the runway.
Forecasting wind in the Cloud
Once the dataset was ready, Lufthansa and Google Cloud evaluated several options before deciding to experiment and tune Vertex AI Forecast, Google’s AutoML-powered forecasting service, in order to achieve optimum results. Vertex Forecast is capable of the required feature engineering, neural architecture search, and hyper parameter tuning, and it is managed by Google Cloud to score in the top 2.5% in the M5 Forecasting Competition on Kaggle, in a completely automated fashion. These qualities made it an excellent choice for Lufthansa, to reduce the manual overhead of creating, deploying, and maintaining top performing deep learning models.
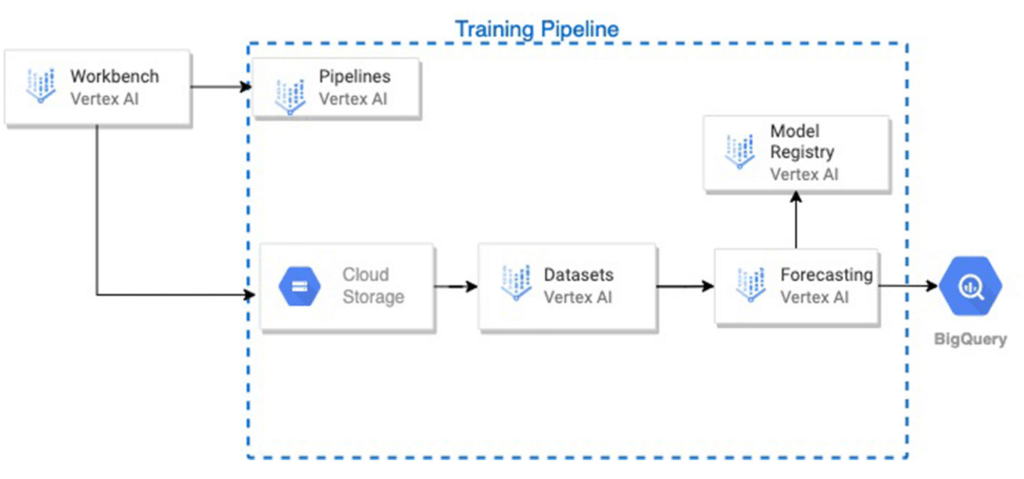
The raw data files were loaded from cloud storage, preprocessed on Vertex AI Workbench. Then, a training pipeline was initiated on Vertex AI Pipelines, which performed the following steps in sequence:
The .csv data file was loaded from Cloud Storage into a Vertex AI managed dataset.
A Vertex AI forecasting training job was initiated with the dataset, and it was also registered as a model in the Vertex AI Model Registry.
Upon completion, the model was evaluated on the test set, and the model’s predictions and the input features and ground truth of the test set, were stored in a user-defined table in BigQuery. Several test metrics were also available on the service and model dashboards.
One of the biggest challenges was the severe imbalance in the dataset, as measurements with BISE were very far and few in between. In order to account for this, instances where BISE occurred, as well the occurrences temporally close to them, were upweighted using weights calculated with methods including Inverse of Square Root of Number of Samples (ISNS), Effective Number of Samples (ENS), and Gaussian reweighting. The formulas for the methods are given below. These weights were supplied as separate columns in the dataset, and were iteratively used thereafter by the service as the “weight” column.
ISNS

ENS

Weighted gaussian

Results and next steps
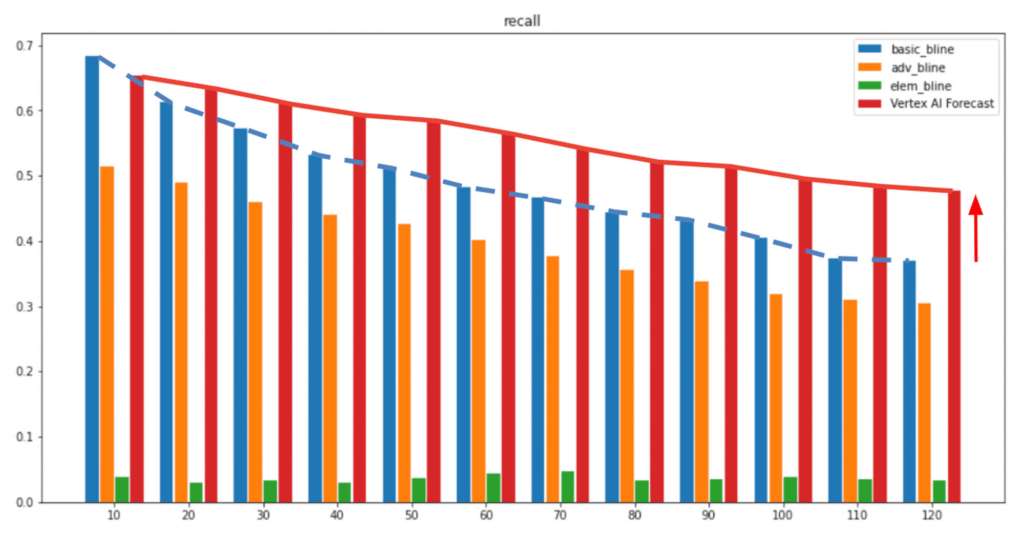
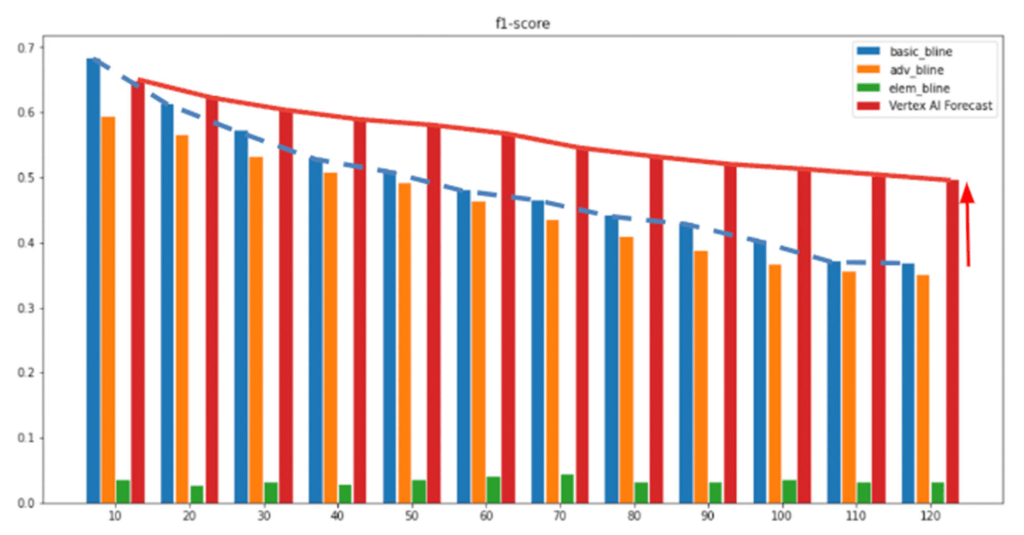
In the above figures, the x-axis represents the forecast horizon and the Y-axis shows the respective metrics (Recall/F1-score). As shown after multiple experiments, we can see Vertex AI Forecast achieved higher recall and precision t (red bar), outperforming Lufthansa’s internal baseline heuristics, with the performance gap widening steadily as the forecast horizon extends further into the future. At the two-hour mark, our custom-configured Vertex AI Forecast model improved by 40% relative to the internal heuristics and 1700% compared to the random guess baseline. As we saw with other experiments, at a six-hour forecast horizon, the performance gap widens even more, with Vertex AI Forecast in the lead. Since forecasting BISE a few hours in advance is very beneficial to prevent flight delays for Lufthansa, this was a great solution for them.
“We are very excited to be able to not only do accurate long term forecasts for the BISE, but also that Vertex AI Forecasting makes training and deploying such models much easier and faster, allowing us to innovate rapidly to serve our customers and stakeholders in the best possible manner,” said Swiss Oliver Rueegg, Product Owner, Swiss International Airlines.
Lufthansa plans to explore productionizing this solution by integrating it into their Operations Decision Support Suite, which is used by the network controllers in the Operations Control Center in Kloten, as well as to work closely with Google’s specialists to integrate both Vertex AI Forecast and other of Google’s AI/ML offerings for their use cases.
More Relevant Stories for Your Company
How Vertex Vizier’s Automated Hyperparameter Tuning Improves ML Models
We recently launched Vertex AI to help you move machine learning (ML) from experimentation into production faster and manage your models with confidence—speeding up your ability to improve outcomes at your organization. But we know many of you are just getting started with ML and there’s a lot to learn! In tandem

Enterprises can Push the Limits of Edge Even Further!
Whether with the cloud or within their own data centers, enterprises have undergone a period of remarkable consolidation and centralization of their compute resources. But with the rise of ever more powerful mobile devices, and increasingly capable cellular networks, application architects are starting to think beyond the confines of the

How TeamSnap Improved Return on Ad Spend Significantly
Anyone who has ever coached or played on a sports team, or had a child involved in sports, knows how difficult scheduling and logistics can be. From game and practice schedules, to uniforms and who’s bringing the snacks, it can be a lot for coaches, administrators, parents, and players to

Building Unique Customer Experiences with Speed & Scale: Sprinklr & Google Cloud
Enterprises are increasingly seeking out technologies that help them create unique experiences for customers with speed and at scale. At the same time, customers want flexibility when deciding where to manage their enterprise data, particularly when it comes to business-critical applications. That’s why I’m thrilled that Sprinklr, the unified customer
