





How Vertex Vizier’s Automated Hyperparameter Tuning Improves ML Models

5056
Of your peers have already read this article.
1:30 Minutes
The most insightful time you'll spend today!
We recently launched Vertex AI to help you move machine learning (ML) from experimentation into production faster and manage your models with confidence—speeding up your ability to improve outcomes at your organization.
But we know many of you are just getting started with ML and there’s a lot to learn! In tandem with building the Vertex AI platform, our teams are dropping as much best practices content as we can to help you come up to speed. Plus, we have a dedicated event on June 10th, Applied ML Summit, with sessions on how to apply ML technology in your projects, as well as grow your skills in this field.
In the meantime, we couldn’t resist a quick lesson on hyperparameter tuning, because (a) it’s incredibly cool (b) you will impress your coworkers (c) Google Cloud has some unique battle tested tech in this area and (d) you will save time by getting better ML models into production faster. Vertex Vizier, on average, finds optimal parameters for complex functions in over 80% fewer trials than traditional methods.
So it’s incredibly cool, but what is it?
While machine learning models automatically learn from data, they still require user-defined knobs which guide the learning process. These knobs, commonly known as hyperparameters, control, for example, the tradeoff between training accuracy and generalizability. Examples of hyperparameters are the optimizer being used, its learning rate, regularization parameters, the number of hidden layers in a DNN, and their sizes.
Setting hyperparameters to their optimal values for a given dataset can make a huge difference in model quality. Typically, optimal hyperparameter values are found via grid searching a small number of combinations, or tedious manual experimentation. Hyperparameter tuning automates this work for you by searching for the best configuration of hyperparameters for optimal model performance.
Vertex Vizier enables automated hyperparameter tuning in several ways:
- “Traditional” hyperparameter tuning: by this we mean finding the optimal value of hyperparameters by measuring a single objective metric which is the output of an ML model. For example, Vizier selects the number of hidden layers and their sizes, an optimizer and its learning rate, with the goal of maximizing model accuracy.
- When hyperparameters are evaluated, models are trained and evaluated on splits of the data set. If evaluation metrics are streamed to Vizier (e.g. as a function of epoch) as the model is trained, Vizier’s early stopping algorithms can predict the final objective value, and recommend which unpromising trials should be early stopped. This conserves compute resources and speeds up convergence.
- Oftentimes, models are tuned sequentially on different data sets. Vizier’s built in transfer learning learns priors from previous hyperparameter tuning studies, and leverages them to converge faster on subsequent hyperparameter tuning studies.
- AutoML is a variant of #1, where Vertex Vizier performs both model selection, and also tunes architectures/non-architecture modifying hyperparameters. AutoML usually requires more code on top of Vertex Vizier (to ingest data etc), but Vizier is in most cases the “engine” behind the process. AutoML is implemented by defining a tree like (DAG) search space, rather than a “flat” search space (like in #1). Note that you can use DAG search spaces for any other purpose where searching over a hierarchical space makes sense.
- There are times when you may wish to optimize more than one metric. For example, we would like to optimize model accuracy, while minimizing model latency. Vizier can find the Pareto frontier, which presents tradeoffs for multiple metrics, allowing users to choose the appropriate tradeoff. Simple example: I want to make a more accurate model, but would like to minimize serving latency. I do not know ahead of time what’s the tradeoff between the two metrics. Vizier can be used to explore and plot a tradeoff curve, so users can select on the most appropriate one. For example, “a latency decrease of 200ms will only decrease accuracy by 0.5%”
Google Vizier is all yours with Vertex AI
Google published the Vizier research paper in 2017, sharing our work and use cases for black-box optimization—i.e. The process of finding the best settings for a bunch of parameters or knobs when you can’t peer inside a system to see how well the knobs are working. The paper discusses our requirements, infrastructure design, underlying algorithms, and advanced features such as transfer learning that the service provides. Vizier has been essential to our progress with machine learning at Google, which is why we are so excited to make it available to you on Vertex AI.
Vizier has already tuned millions of ML models at Google, and its algorithms are continuously improved for faster convergence and handling of real-life edge cases. Vertex Vizier’s models are very well calibrated and are self-tuning (they adapt to user data), and offer unique power features, such as hierarchical search spaces and multi-objective optimization. We believe Vertex Vizier’s set of features is a unique capability to Google Cloud, and look forward to optimizing the quality of your models by automatically tuning hyperparameters for you.
To learn more about Vertex Vizier, check out these docs and if you are interested in what’s coming in machine learning over the next five years, tune in to our Applied ML Summit on June 10th, or watch the sessions on demand in your own time.
Transforming Media Industry: Three Strategies for Media Leaders to Leverage Generative AI

1547
Of your peers have already read this article.
3:30 Minutes
The most insightful time you'll spend today!
The digital era turned the traditional formula for media and entertainment success on its head, ushering in new technologies that have changed how content is produced, distributed, experienced, and monetized. Audiences have more choice, flexibility, and power over what they consume, and today’s media companies have to embrace ongoing transformation or risk falling behind – or becoming irrelevant.
A new wave of transformation is arriving with generative AI, a type of artificial intelligence that can interact with users in natural language and create novel data, ranging from story outlines, reports, and other text outputs to multimodal content like images, videos, and audio. Media and entertainment are inherently about content creation and creativity—so what does this new technology mean for the industry?
At Google Cloud, we see tremendous opportunity for creative industries, from more efficient creation methods to improved user experiences. Let’s explore.
AI for media with Google Cloud
Google Cloud has a long history with large language models (LLMs) and other generative AI technologies—from their influence over the years on products like Document AI, to recent announcements like Generative AI support in Vertex AI, which lets businesses access and tune generative AI foundation models, and Generative AI App Builder, which lets developers build chatbots and other generative apps in minutes.
We’ve helped our global media and entertainment customers with AI for personalization, search and recommendations, predictive analytics, and much more — and with generative AI now on the rise, we have some ideas to help media leaders, technologists, and creators think about and prepare to utilize powerful AI in their work.
Three lenses on innovation in media
The media and entertainment industry is increasingly diverse and complex, with companies spanning over-the-top (OTT) subscription streaming services, 24-hour linear channels, live broadcasts of sporting events, digital journalism, traditional publishing, short-form user-generated social video, and more. More and more, the boundaries between these segments of the media industry are blurring — but common to them all is the focus on providing compelling content in an engaging audience experience that can be directly or indirectly monetized.
With this in mind, we suggest media and entertainment companies look at the application of innovative technologies like generative AI through the following three lenses:
- Improving content creation, production, and management
- Enhancing and personalizing audience experiences
- Improving monetization
Improving content creation, production, and management
Generative AI democratizes many aspects of content creation, opening new ways to create written material, illustrations, sound effects, special effects, and more. Its recent maturation has been so rapid, some in the media industry have expressed concern that generative AI implies the end of creative professions. We think the opposite is more likely: just as photography, audio recordings, and computer generated images have enabled new modes of creativity, rather than making old ones obsolete, generative AI has the potential to both enable new forms of expression and enhance familiar ones.
For example, journalists could use generative AI to speed up research by helping them synthesize and analyze large volumes of information, or to help them create initial drafts or summaries of editorial content. Film and television producers could leverage the technology to accelerate the post-production editing process, with new AI-enabled interfaces for rapidly adjusting or enhancing scene details such as lighting and color. Broadcasters could use generative AI to make vast libraries of video footage searchable and accessible for use in telling more compelling stories. The potential use cases go on and on.
Far from undermining incredible creative professions, generative AI is poised to free writers, artists, editors, and many others from the tedious and mundane aspects of their work, empowering them to focus more of their time on creativity.
Enhancing and personalizing audience experiences
Every media organization in the world today faces the reality that for most consumers, switching costs are extremely low. This puts incredible pressure on these companies to invest in delivering low-friction and compelling audience experiences that help mitigate subscribers from churning and viewers from abandoning content experiences for competitive platforms.
Generative AI can help media companies engage and retain viewers, such as by enabling more powerful search and recommendations on their digital content platforms. With its increasingly multimodal capabilities extending from natural language to both audio and video content, generative AI is well-positioned to power more personalized audience experiences.
Consumers often complain about “the paradox of choice” or their inability to find something interesting to watch on streaming platforms that have incredibly vast libraries of content available on demand. Imagine a not-too-distant future wherein a consumer can simply ask the content platform they’re using to help them find a specific show to watch based on mood, specific types of scenes, combinations of actors, award nominations, or practically anything they can think to ask. And that’s just the tip of the iceberg — imagine generative AI’s potential to curate, assemble, and even create personalized content for a viewer to consume!
Improving monetization
As consumers’ content consumption further expands from traditional theatrical and linear television programming to include digital offerings across an array of platforms, devices, and content types, media companies face the challenge of maintaining and improving monetization. The conventional economics and approaches to advertising and subscription models are proving, in many cases, not to deliver sufficient ROI.
Generative AI has the potential to help media companies improve their monetization of audience experiences. As mentioned previously, enhanced personalization can play a role in mitigating churn, which in turn can help sustain and grow subscription and advertising revenues. Going beyond this, generative AI can be leveraged to drive even greater advertising revenues via more targeted, contextual, and personalized advertisements. Imagine both display and video advertisements that are generated on the fly to personalize product specifics, messaging, style, colors, and innumerable other characteristics to drive greater engagement and higher click-through rates (CTR), and thus higher advertising CPMs (cost per thousand impressions).
Coming up next
Generative AI presents a significant opportunity for media companies to fundamentally transform content creation, engagement, and monetization. Compelling services are already on the market — but there is far more to come.
Google Cloud continues to build on its deep experience and expertise with AI, and we are committed to working with the industry to develop compelling, accessible, trusted, and responsible AI solutions that will drive meaningful business outcomes. We are excited to create the future together with our global media customers and partners across the ecosystem. To learn more about this disruptive topic, read “Debunking five generative AI misconceptions” from Google Cloud vice president of AI & Business Solutions Phil Moyer, or explore our Trusted Tester Program for generative AI.
Trading and Investment Companies will Increase Consumption of Cloud Services: Study Confirms

4905
Of your peers have already read this article.
3:00 Minutes
The most insightful time you'll spend today!
While some traditional financial services companies have more slowly transitioned to the cloud, capital markets firms have embraced cloud computing across their entire value chains — front-, middle-, and back-office. We wanted to understand the dynamics behind this rapid adoption, the most common use cases, and the types of technology most in use, particularly as it relates to market data. Google Cloud commissioned Coalition Greenwich to survey 102 institutional capital markets professionals — at exchanges, trading systems, data aggregators, data producers, asset managers, hedge funds, and investment banks — in the United States, Canada, France, Germany, Italy, the Netherlands, Switzerland, and the United Kingdom.
Our research found that while there are many drivers, demand for easier accessibility is fueling widespread adoption of cloud-based market data services, and associated trading infrastructures, across the buy side and sell side. In fact, 68% of sell-side and buy-side users find it critical for market data providers to offer public cloud-based data services. At the same time, exchanges, market data providers, aggregators, and trading systems are embracing the cloud as a delivery model by offering access to data directly via their own cloud services, APIs or partners.
Here were five noteworthy takeaways from the study:
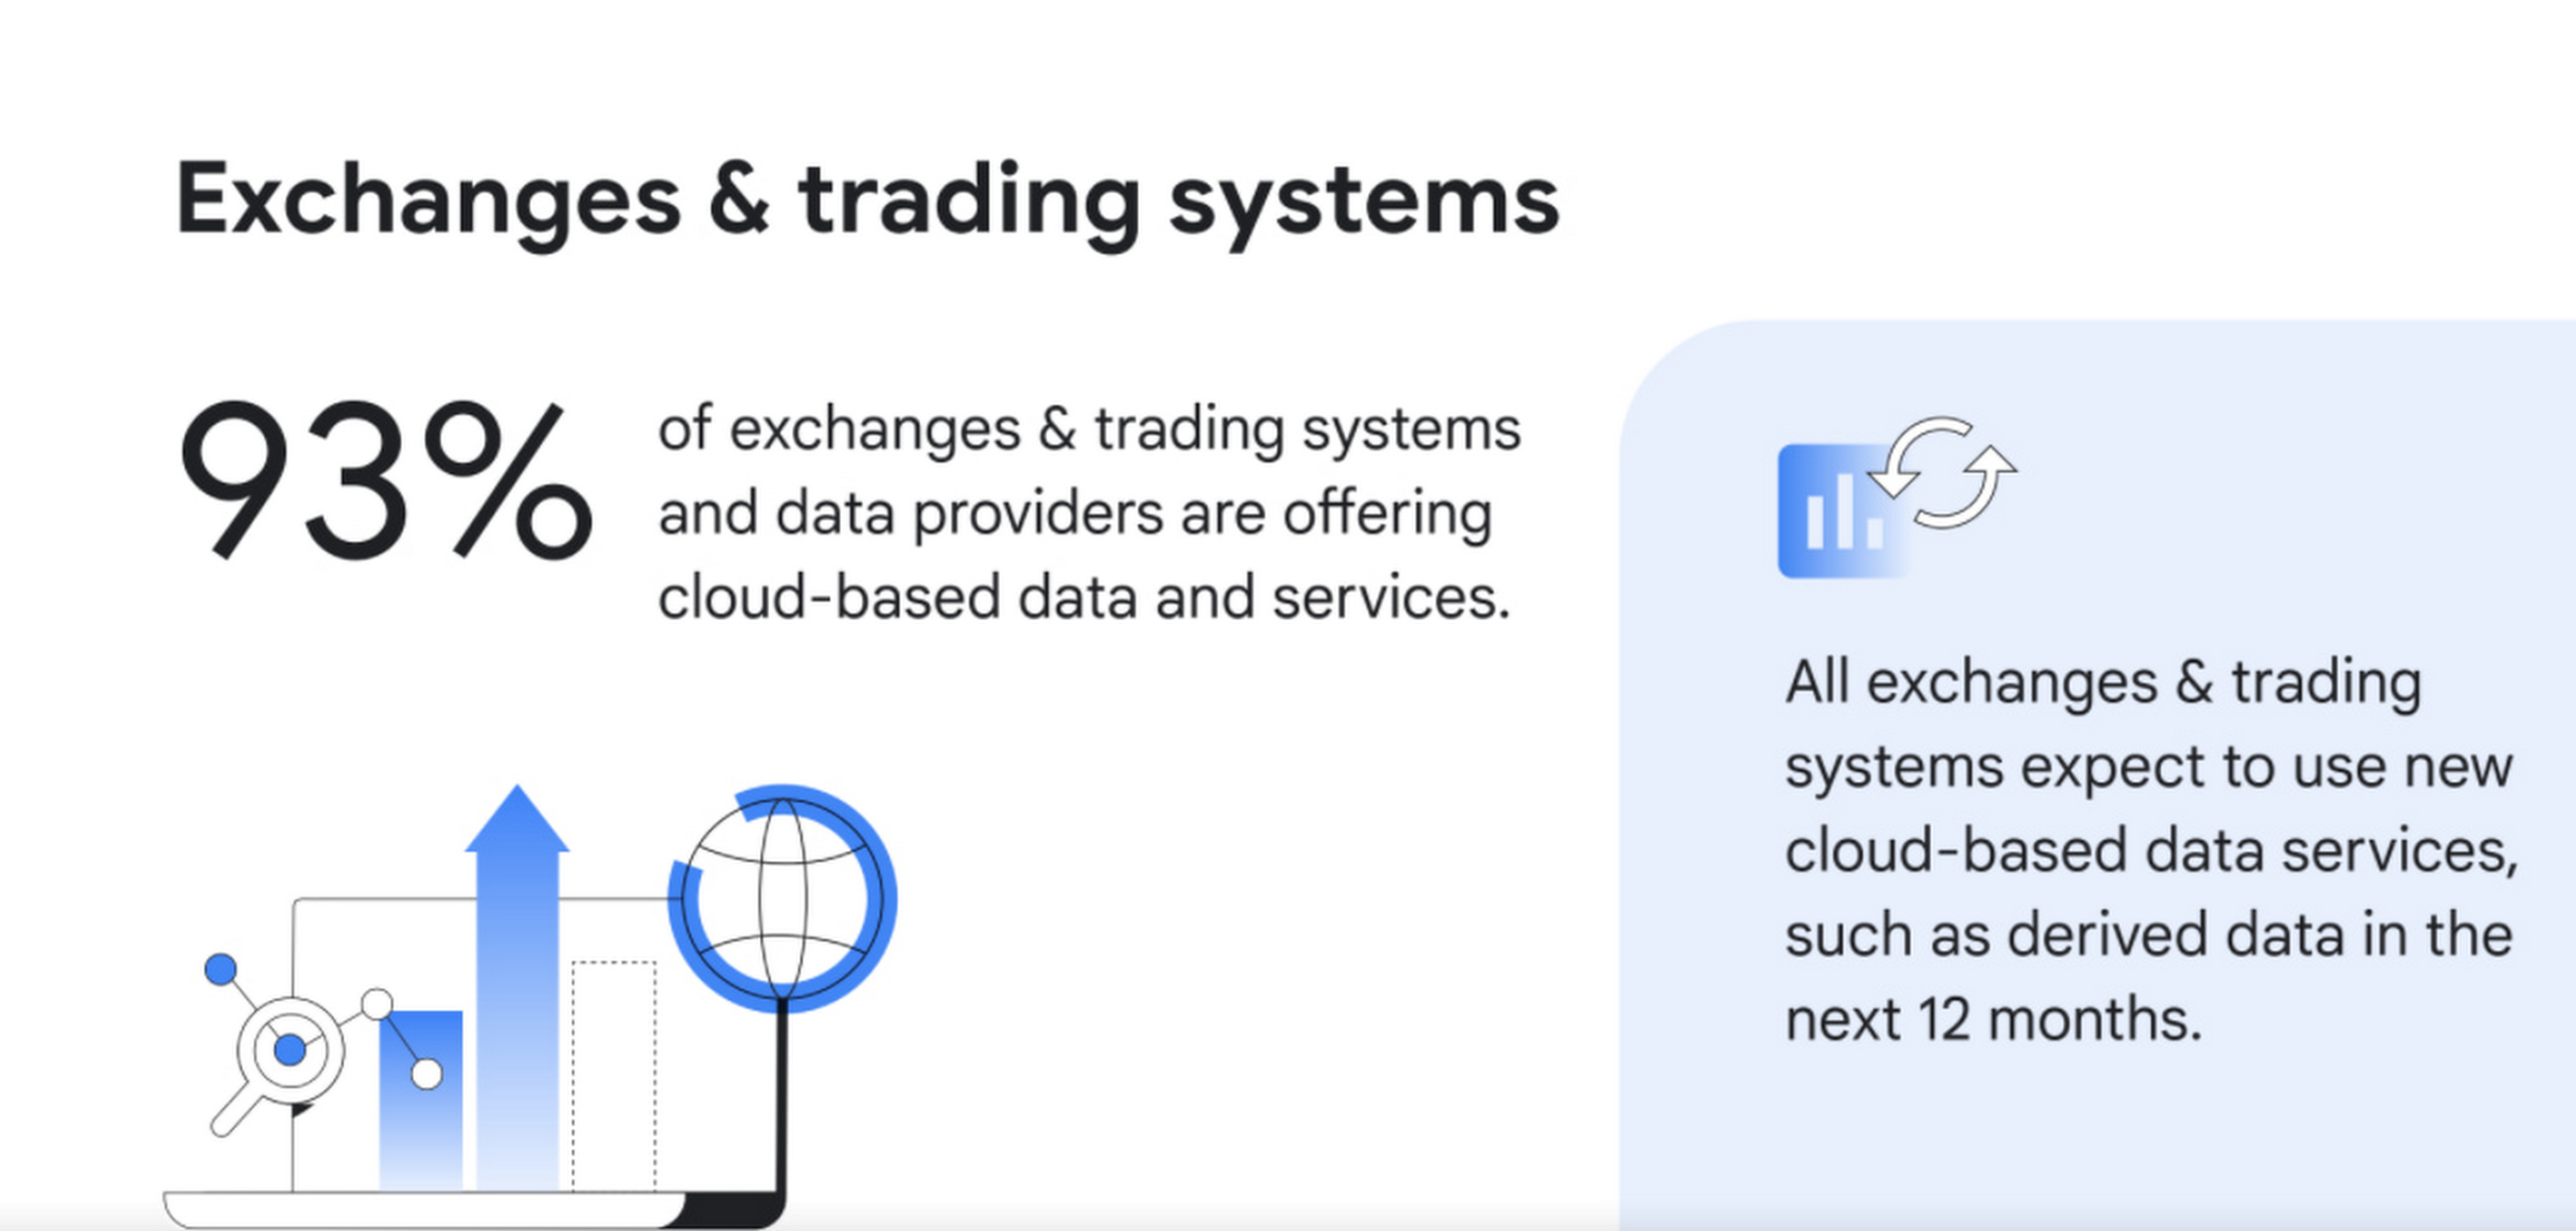
1. Cloud services are becoming ubiquitous for data delivery. Today, the cloud is pervasive, with 93% of exchanges, trading systems and data providers offering cloud-based data and services, according to surveyed executives. Moreover, 100% of those surveyed intend to offer new cloud-based services, such as derived data, in the next 12 months.
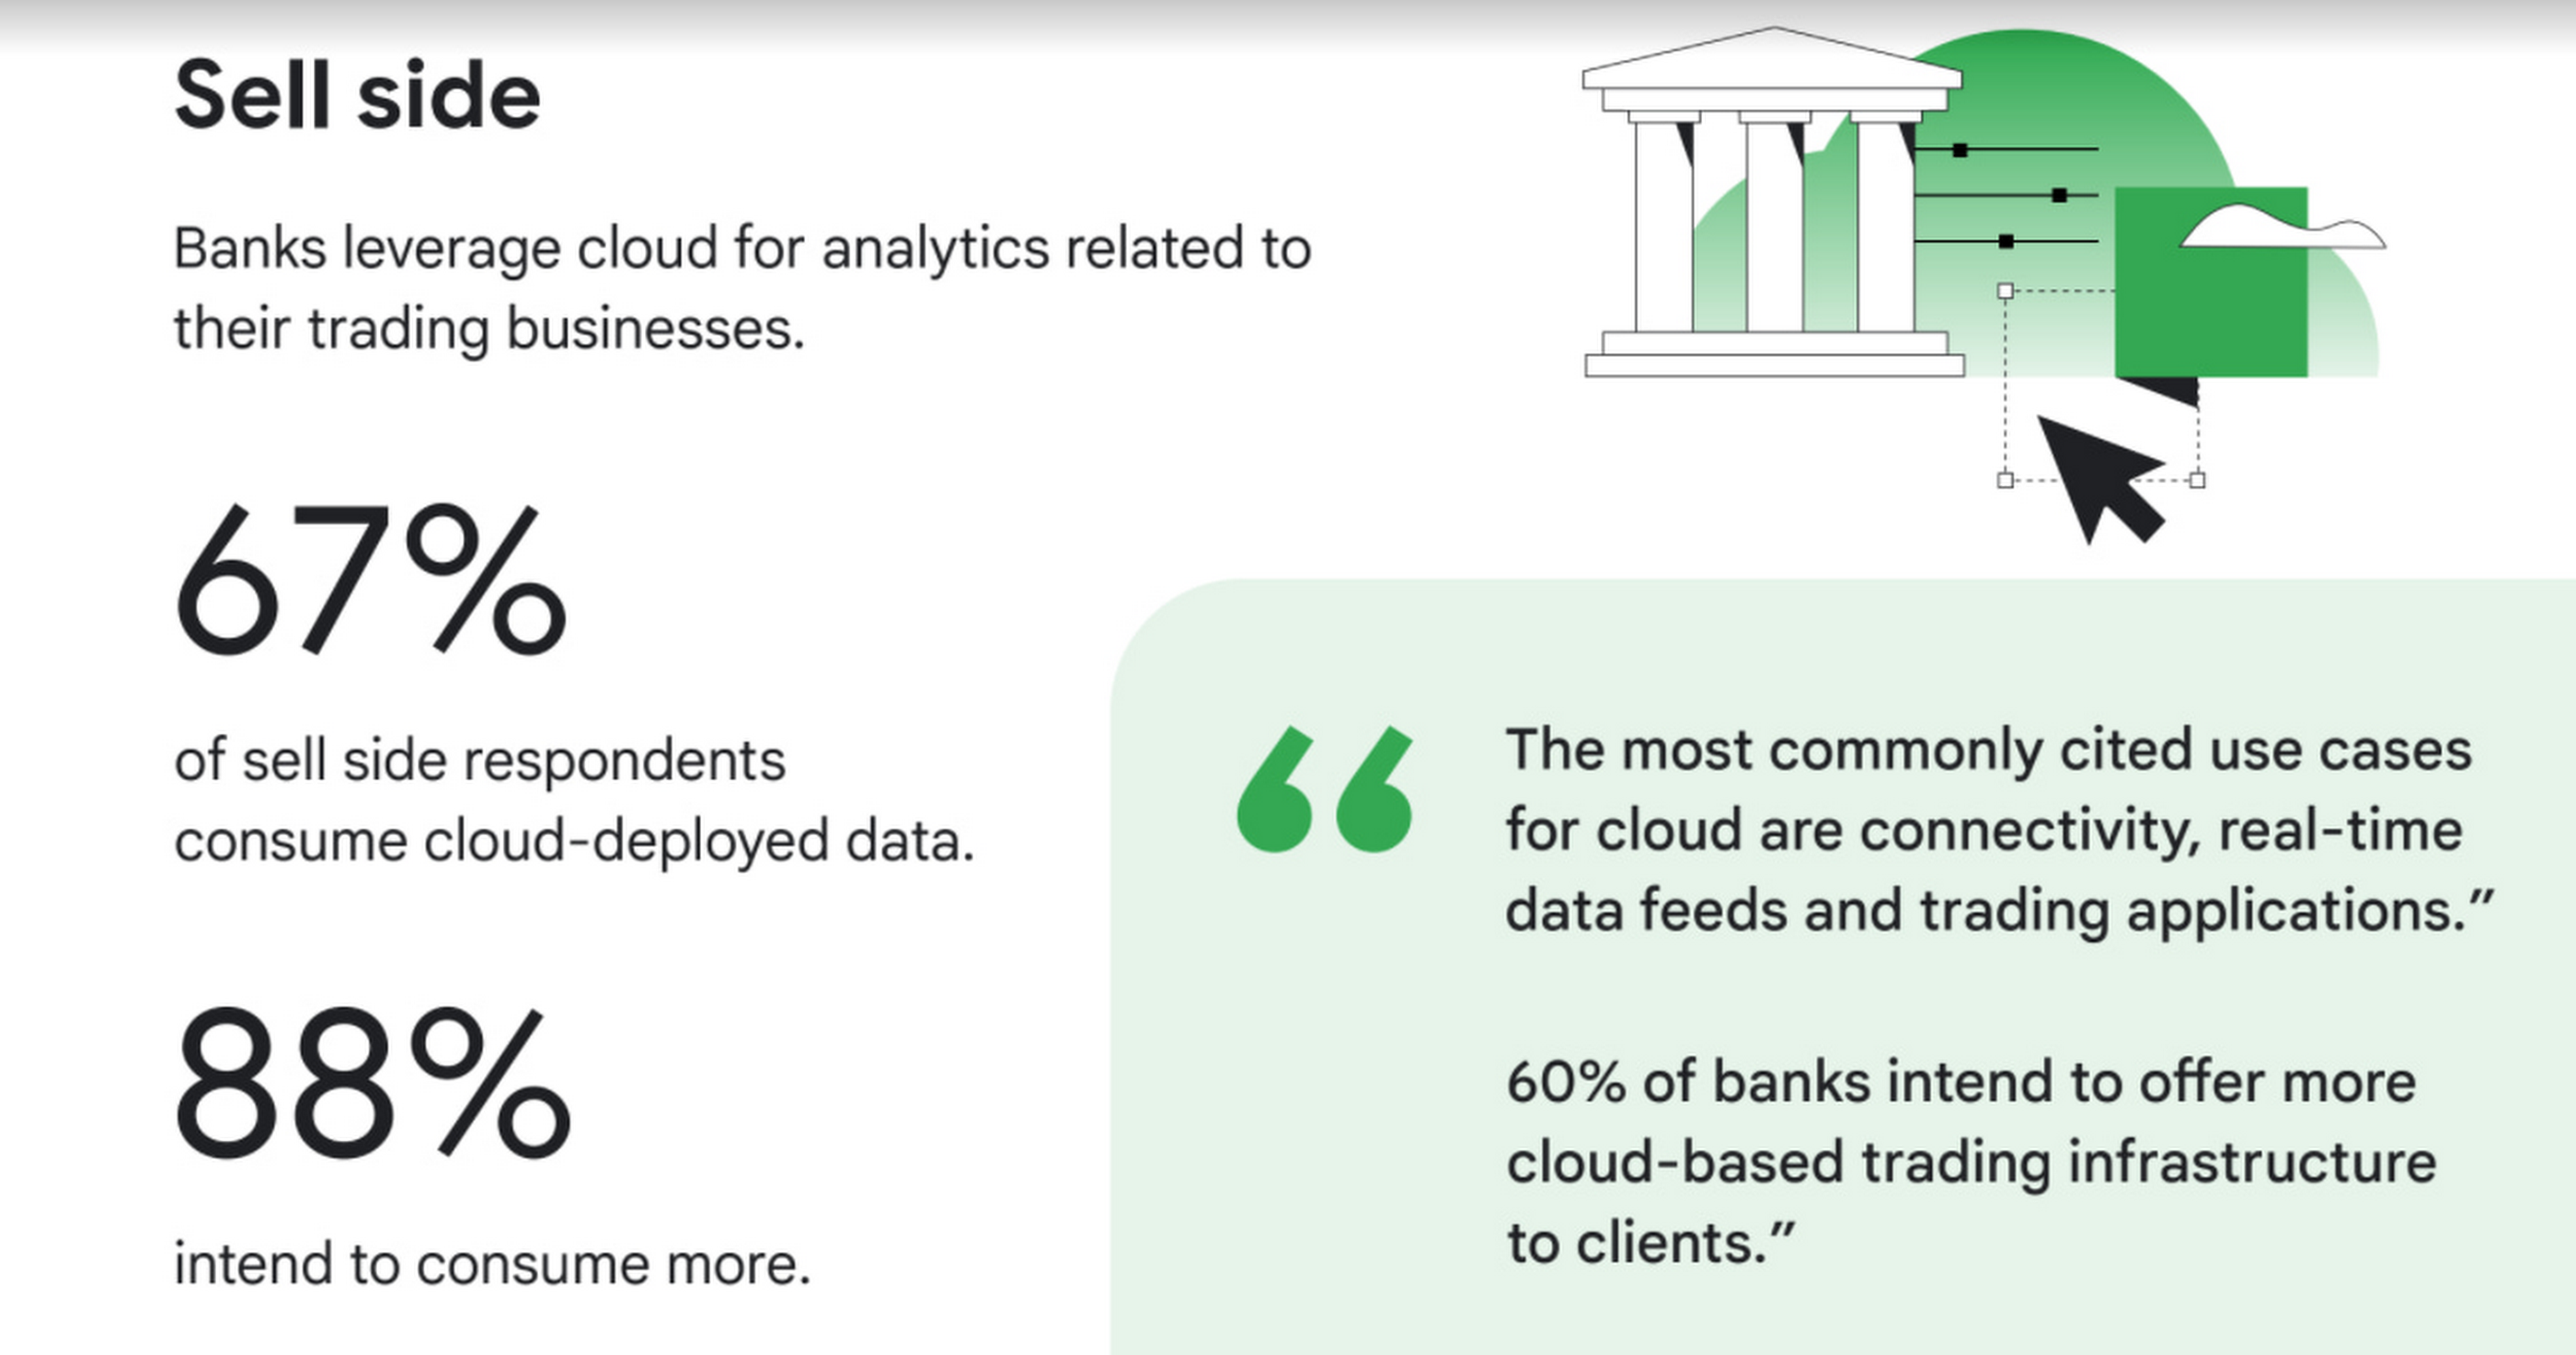
2. Commercial and investment banks are offering additional connectivity, real-time data feeds, and trading applications delivered via the cloud,demonstrating that it’s not only exchanges, trading systems, and data providers that are moving rapidly to the cloud. Internal use cases abound as well, with 67% of those surveyed consuming cloud-deployed market data, primarily for data analytics. 88% of surveyed sell-side firms intend to consume cloud-based market data services, with digital transformation, data science and quant research as the top use cases.
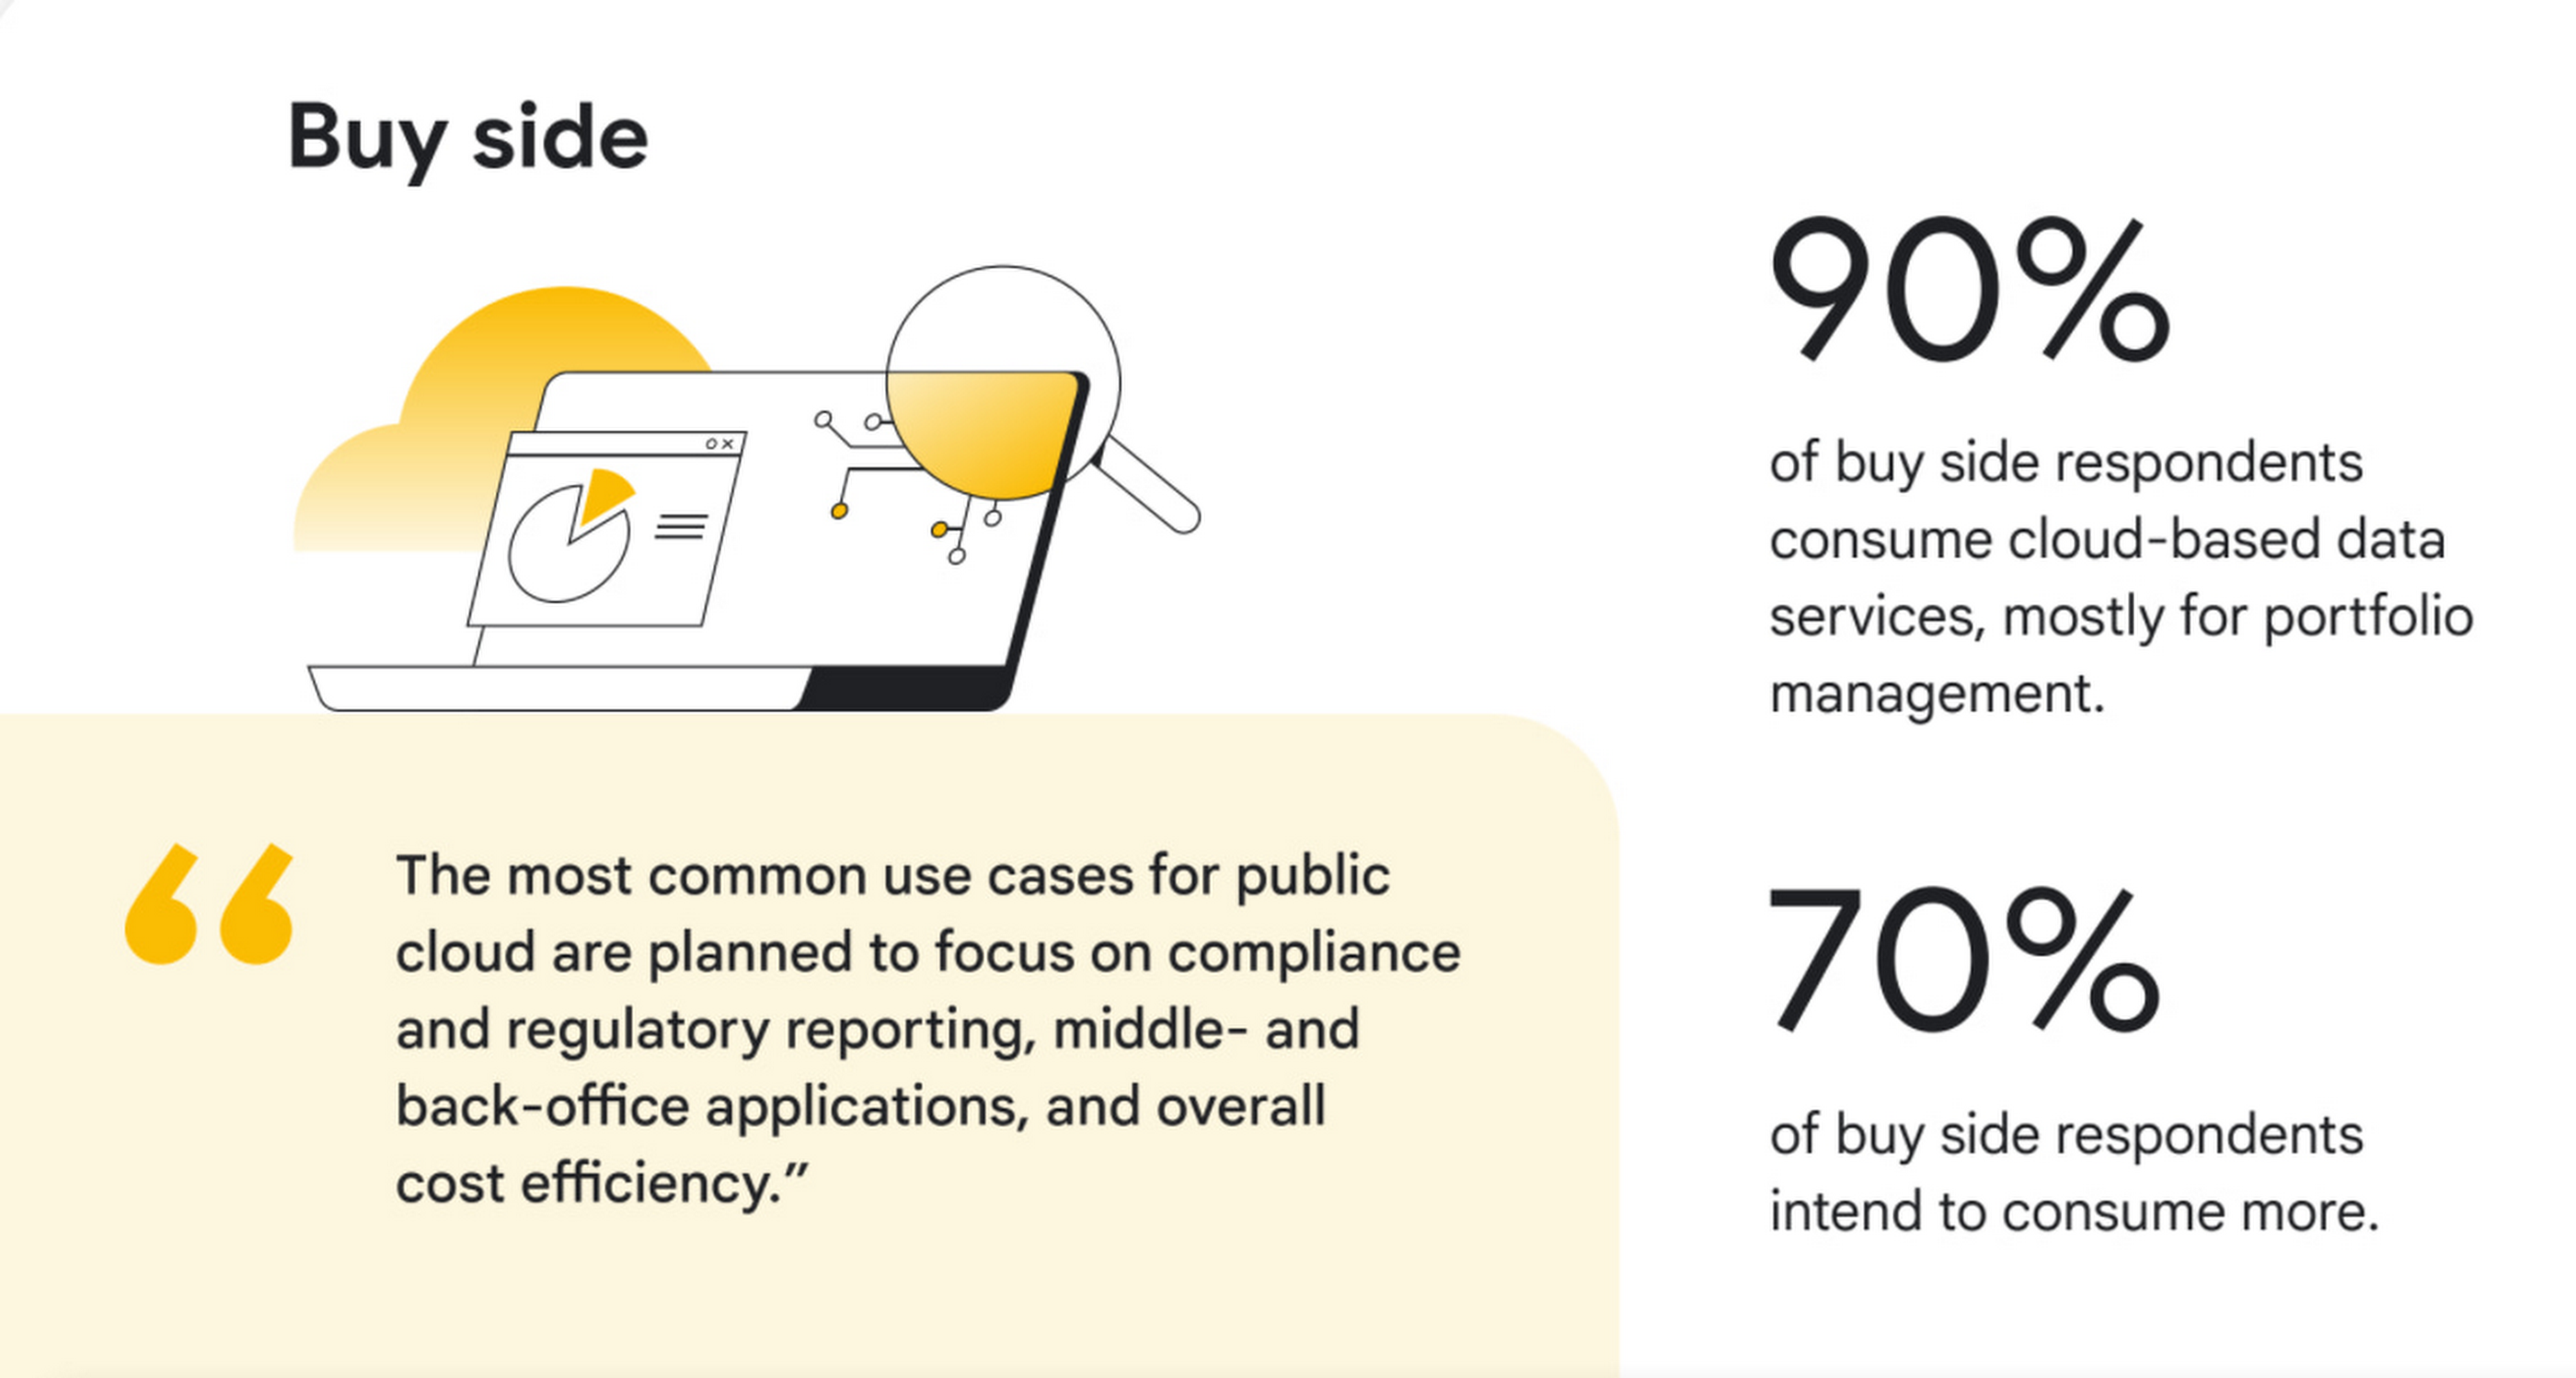
3. Buy side firms will consume even more cloud-deployed data. Today, 90% of surveyed buy-side firms are consuming cloud-deployed market data, mostly for portfolio management. 70% of buy-side firms intend to consume more public cloud-based market data services in the next 12 months, adding services such as compliance and regulatory reporting.
4. AI/ML, powered by cloud, is moving out of the pilot phase and into mainstream use. Today, 50% of exchanges, trading systems, and data providers are offering data products or services powered by AI/ML, and of those, 42% intend to offer AI-powered trade execution and trading analytics services in the next 12 months. Within commercial and investment banks, 55% said they are currently using AI/ML in the cloud, and while that was true for only 14% of overall buy-side respondents, 44% of large buy-side respondents are using it.

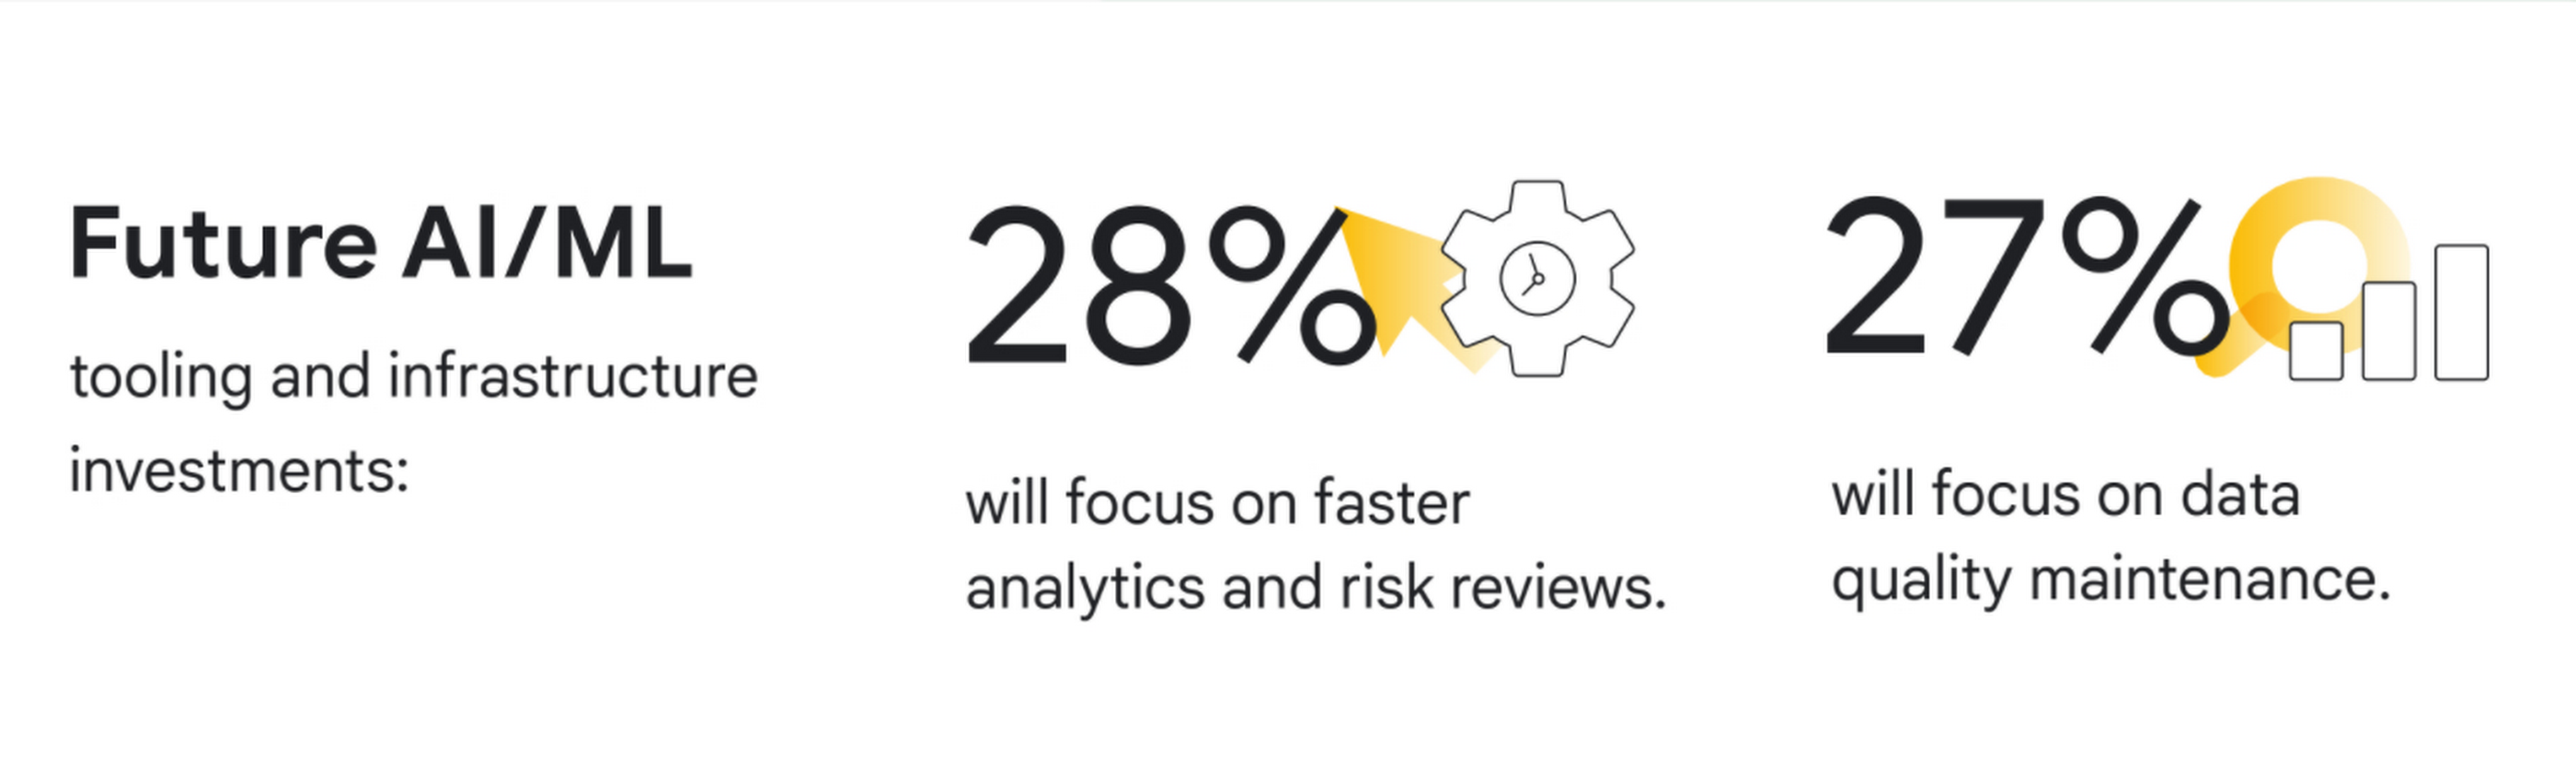
5. Exchanges, trading systems, and data providers are prioritizing public cloud for internal insights. 71% of these firms are using the public cloud, mostly for data transmission, processing, analysis, and long-term data storage. Over the next 12 months, 33% of new public cloud workloads will focus on data mining, data insights and advanced analytics, while 28% of new AI/ML tooling and infrastructure investments will focus on faster analytics and risk reviews, and 27% on data quality maintenance.
“We see new, dramatic shifts on the adoption of cloud across market data,” said David Easthope, Senior Analyst for Coalition Greenwich. “And we expect further proliferation of cloud-based services and greater consumption across the trading and investing lifecycle.”
Conclusions and future predictions
Based on the survey results, Coalition Greenwich predicts five following trends over the next 12 months:
- Exchanges and trading systems will continue to launch a wide array of new cloud-based and possibly cloud exclusive data services across derived data, end of day data, reference data and pricing data.
- Data providers will launch new data products such as pre-trade analytics powered by AI/ML in the cloud.
- Commercial and investment banks will offer additional connectivity, real-time data feeds, and trading applications delivered via the cloud.
- Buy-side firms will consume even more cloud-deployed data, including real-time market data, portfolio management data, and risk analytics.
- Exchanges, trading systems and data providers will explore proof-of-concepts around core systems on the cloud. Improvements to AI/ML tooling or infrastructure will ramp up as firms seek more rapid responses to risk initiatives.
To learn more about these findings, download our two full reports, The Future of market data: Distribution and consumption through cloud and AI and Exchanges and data providers: Prioritizing the cloud and AI for internal insights or our short infographic.
Research methodology
The survey was conducted online by Coalition Greenwich on behalf of Google Cloud from March 2021 to April 2021 among 102 executives in North America (n=82), EMEA (n=17) and other (n=3) who are employed full-time and who are participants or influencers in decisions around cloud and/or senior management with a role at a company which is an institutional asset manager, hedge fund, alternative investment manager, exchange and/or trading system, information provider, information aggregator, or other asset manager/asset owner. The survey included wide perspectives from a range of firm size and asset class focus, including equity, fixed income, FX, commodities, multi-asset, and other asset classes.
Foot Notes
1. We defined market data as direct feeds, consolidated feeds, terminal and desktop products, security and reference data, pricing data, historical data, alternative data, and index data.
2995
Of your peers have already watched this video.
17:30 Minutes
The most insightful time you'll spend today!
Signal Generation in the Investment Management Industry
Machine learning is seeing a lot of use cases in the financial sector. One of them is leverage AI to sift signal from noise and create insights or predictions that can give financial planners an edge.
In this video, David Li, Head of Advanced Analytics, BlackRock and Colman Madden, Customer Engineer, Google Cloud, present on how BlackRock leverages NLP on Google Cloud to search for signals in the investment management industry.
“We analyze large volumes of textual news via NLP to classify text into sentiment scores as well as other metrics such as news volume and emotions in these articles,” says David Li.
He also discusses some of the challenges they faced, and the solutions they found, and why they selected Google Cloud to run this project.
8436
Of your peers have already watched this video.
21:00 Minutes
The most insightful time you'll spend today!
Journey to Transformation and Modernization with Google’s Distributed Cloud
Google Cloud has been leading the way of helping businesses make most from their cloud investments to drive digital transformation through modern application platforms that cater to today’s customer needs. Watch the video from the Next ’21 to explore three areas where companies are supported by Google Cloud throughout their cloud evolution journey–cloud migration and modernization, extension of services and engineering practices to hybrid and multicloud environments, and delivery of high performance with planet scale distributed infrastructure. Also, learn how Google Cloud is equipped for more complex and unique use cases, from datacenter to the edge. Hear the strategies and customer stories that can help your business modernize people, processes, and applications to fully leverage Google’s distributed cloud!
10188
Of your peers have already watched this video.
1:00 Minutes
The most insightful time you'll spend today!
Predict User Churn on Gaming Apps with Google Analytics Data using BigQuery ML
User retention can be a major challenge for mobile game developers. According to the Mobile Gaming Industry Analysis in 2019, most mobile games only see a 25% retention rate for users after the first day. To retain a larger percentage of users after their first use of an app, developers can take steps to motivate and incentivize certain users to return. But to do so, developers need to identify the propensity of any specific user returning after the first 24 hours.
In this blog post, we will discuss how you can use BigQuery ML to run propensity models on Google Analytics 4 data from your gaming app to determine the likelihood of specific users returning to your app.
You can also use the same end-to-end solution approach in other types of apps using Google Analytics for Firebase as well as apps and websites using Google Analytics 4. To try out the steps in this blogpost or to implement the solution for your own data, you can use this Jupyter Notebook.
Using this blog post and the accompanying Jupyter Notebook, you’ll learn how to:
- Explore the BigQuery export dataset for Google Analytics 4
- Prepare the training data using demographic and behavioural attributes
- Train propensity models using BigQuery ML
- Evaluate BigQuery ML models
- Make predictions using the BigQuery ML models
- Implement model insights in practical implementations
Google Analytics 4 (GA4) properties unify app and website measurement on a single platform and are now default in Google Analytics. Any business that wants to measure their website, app, or both, can use GA4 for a more complete view of how customers engage with their business. With the launch of Google Analytics 4, BigQuery export of Google Analytics data is now available to all users. If you are already using a Google Analytics 4 property, you can follow this guide to set up exporting your GA data to BigQuery.
Once you have set up the BigQuery export, you can explore the data in BigQuery. Google Analytics 4 uses an event-based measurement model. Each row in the data is an event with additional parameters and properties. The Schema for BigQuery Export can help you to understand the structure of the data.
In this blogpost, we use the public sample export data from an actual mobile game app called “Flood It!” (Android, iOS) to build a churn prediction model. But you can use data from your own app or website.
Here’s what the data looks like. Each row in the dataset is a unique event, which can contain nested fields for event parameters.
SELECT *FROM `firebase-public-project.analytics_153293282.events_*`TABLESAMPLE SYSTEM (1 PERCENT)

This dataset contains 5.7M events from over 15k users.
SELECTCOUNT(DISTINCT user_pseudo_id) as count_distinct_users,COUNT(event_timestamp) as count_eventsFROM`firebase-public-project.analytics_153293282.events_*

Our goal is to use BigQuery ML on the sample app dataset to predict propensity to user churn or not churn based on users’ demographics and activities within the first 24 hours of app installation.

In the following sections, we’ll cover how to:
- Pre-process the raw event data from GA4
- Identify users & the label feature
- Process demographic features
- Process behavioral features
- Train classification model using BigQuery ML
- Evaluate the model using BigQueryML
- Make predictions using BigQuery ML
- Utilize predictions for activation
Pre-process the raw event data
You cannot simply use raw event data to train a machine learning model as it would not be in the right shape and format to use as training data. So in this section, we’ll go through how to pre-process the raw data into an appropriate format to use as training data for classification models.
This is what the training data should look like for our use case at the end of this section:

Notice that in this training data, each row represents a unique user with a distinct user ID (user_pseudo_id).
Identify users & the label feature
We first filtered the dataset to remove users who were unlikely to return the app anyway. We defined these ‘bounced’ users as ones who spent less than 10 mins with the app. Then we labeled all remaining users:
- churned: No event data for the user after 24 hours of first engaging with the app.
- returned: The user has at least one event record after 24 hours of first engaging with the app.
For your use case, you can have a different definition of bounce and churning. Also you can even try to predict something else other than churning, e.g.:
- whether a user is likely to spend money on in-game currency
- likelihood of completing n-number of game levels
- likelihood of spending n amount of time in-game etc.
In such cases, label each record accordingly so that whatever you are trying to predict can be identified from the label column.
From our dataset, we found that ~41% users (5,557) bounced. However, from the remaining users (8,031), ~23% (1,883) churned after 24 hours:
SELECTbounced,churned,COUNT(churned) as count_usersFROMbqmlga4.returningusersGROUP BY 1,2ORDER BY bounced

To create these bounced and churned columns, we used the following snippet of SQL code.
...#churned = 1 if last_touch within 24 hr of app installation, else 0IF (user_last_engagement < TIMESTAMP_ADD(user_first_engagement,INTERVAL 24 HOUR),1,0 ) AS churned,#bounced = 1 if last_touch within 10 min, else 0IF (user_last_engagement <= TIMESTAMP_ADD(user_first_engagement,INTERVAL 10 MINUTE),1,0 ) AS bounced,...
You can view the Jupyter Notebook for the full query used for materializing the bounced and churned labels.
Process demographic features
Next, we added features both for demographic data and for behavioral data spanning across multiple columns. Having a combination of both demographic data and behavioral data helps to create a more predictive model.
We used the following fields for each user as demographic features:
geo.countrydevice.operating_systemdevice.language
A user might have multiple unique values in these fields — for example if a user uses the app from two different devices. To simplify, we used the values from the very first user engagement event.
CREATE OR REPLACE VIEW bqmlga4.user_demographics AS (WITH first_values AS (SELECTuser_pseudo_id,geo.country as country,device.operating_system as operating_system,device.language as language,ROW_NUMBER() OVER (PARTITION BY user_pseudo_id ORDER BY event_timestamp DESC) AS row_numFROM `firebase-public-project.analytics_153293282.events_*`WHERE event_name="user_engagement")SELECT * EXCEPT (row_num)FROM first_valuesWHERE row_num = 1 #first engagement);
Process behavioral features
There is additional demographic information present in the GA4 export dataset, e.g. app_info, device, event_params, geo etc. You may also send demographic information to Google Analytics through each hit via user_properties. Furthermore, if you have first-party data on your own system, you can join that with the GA4 export data based on user_ids.
To extract user behavior from the data, we looked into the user’s activities within the first 24 hours of first user engagement. In addition to the events automatically collected by Google Analytics, there are also the recommended events for games that can be explored to analyze user behavior. For our use case, to predict user churn, we counted the number of times the follow events were collected for a user within 24 hours of first user engagement:
user_engagementlevel_start_quickplaylevel_end_quickplaylevel_complete_quickplaylevel_reset_quickplaypost_scorespend_virtual_currencyad_rewardchallenge_a_friendcompleted_5_levelsuse_extra_steps
The following query shows how these features were calculated:
WITHevents_first24hr AS (SELECTe.*FROM`firebase-public-project.analytics_153293282.events_*` eJOINbqmlga4.returningusers rONe.user_pseudo_id = r.user_pseudo_idWHERETIMESTAMP_MICROS(e.event_timestamp) <= r.ts_24hr_after_first_engagement)SELECTuser_pseudo_id,SUM(IF(event_name = 'user_engagement', 1, 0)) AS cnt_user_engagement,# ... repeated for all behavior data ...SUM(IF(event_name = 'use_extra_steps', 1, 0)) AS cnt_use_extra_steps,FROMevents_first24hrGROUP BY1
View the notebook for the query used to aggregate and extract the behavioral data. You can use different sets of events for your use case. To view the complete list of events, use the following query:
SELECTevent_name,COUNT(event_name) as event_countFROM`firebase-public-project.analytics_153293282.events_*`GROUP BY 1ORDER BYevent_count DESC
After this we combined the features to ensure our training dataset reflects the intended structure. We had the following columns in our table:
- User ID:
user_pseudo_id
- Label:
churned
- Demographic features
countrydevice_osdevice_language
- Behavioral features
cnt_user_engagementcnt_level_start_quickplaycnt_level_end_quickplaycnt_level_complete_quickplaycnt_level_reset_quickplaycnt_post_scorecnt_spend_virtual_currencycnt_ad_rewardcnt_challenge_a_friendcnt_completed_5_levelscnt_use_extra_stepsuser_first_engagement
At this point, the dataset was ready to train the classification machine learning model in BigQuery ML. Once trained, the model will output a propensity score between churn (churned=1) or return (churned=0) indicating the probability of a user churning based on the training data.
Train classification model
When using the CREATE MODEL statement, BigQuery ML automatically splits the data between training and test. Thus the model can be evaluated immediately after training (see the documentation for more information).
For the ML model, we can choose among the following classification algorithms where each type has its own pros and cons:

Often logistic regression is used as a starting point because it is the fastest to train. The query below shows how we trained the logistic regression classification models in BigQuery ML.
CREATE OR REPLACE MODEL bqmlga4.churn_logregTRANSFORM(EXTRACT(MONTH from user_first_engagement) as month,EXTRACT(DAYOFYEAR from user_first_engagement) as julianday,EXTRACT(DAYOFWEEK from user_first_engagement) as dayofweek,EXTRACT(HOUR from user_first_engagement) as hour,* EXCEPT(user_first_engagement, user_pseudo_id))OPTIONS(MODEL_TYPE="LOGISTIC_REG",INPUT_LABEL_COLS=["churned"]) ASSELECT*FROMbqmlga4.train
We extracted month, julianday, and dayofweek from datetimes/timestamps as one simple example of additional feature preprocessing before training. Using TRANSFORM() in your CREATE MODEL query allows the model to remember the extracted values. Thus, when making predictions using the model later on, these values won’t have to be extracted again. View the notebook for the example queries to train other types of models (XGBoost, deep neural network, AutoML Tables).
Evaluate model
Once the model finished training, we ran ML.EVALUATE to generate precision, recall, accuracy and f1_score for the model:
SELECT*FROMML.EVALUATE(MODEL bqmlga4.churn_logreg)

The optional THRESHOLD parameter can be used to modify the default classification threshold of 0.5. For more information on these metrics, you can read through the definitions on precision and recall, accuracy, f1-score, log_loss and roc_auc. Comparing the resulting evaluation metrics can help to decide among multiple models.Furthermore, we used a confusion matrix to inspect how well the model predicted the labels, compared to the actual labels. The confusion matrix is created using the default threshold of 0.5, which you may want to adjust to optimize for recall, precision, or a balance (more information here).
SELECTexpected_label,_0 AS predicted_0,_1 AS predicted_1FROMML.CONFUSION_MATRIX(MODEL bqmlga4.churn_logreg)

This table can be interpreted in the following way:

Make predictions using BigQuery ML
Once the ideal model was available, we ran ML.PREDICT to make predictions. For propensity modeling, the most important output is the probability of a behavior occurring. The following query returns the probability that the user will return after 24 hrs. The higher the probability and closer it is to 1, the more likely the user is predicted to return, and the closer it is to 0, the more likely the user is predicted to churn.
SELECTuser_pseudo_id,returned,predicted_returned,predicted_returned_probs[OFFSET(0)].prob as probability_returnedFROMML.PREDICT(MODEL bqmlga4.churn_logreg,(SELECT * FROM bqmlga4.train)) #can be replaced with a proper test dataset
Utilize predictions for activation
Once the model predictions are available for your users, you can activate this insight in different ways. In our analysis, we used user_pseudo_id as the user identifier. However, ideally, your app should send back the user_id from your app to Google Analytics. In addition to using first-party data for model predictions, this will also let you join back the predictions from the model into your own data.
- You can import the model predictions back into Google Analytics as a user attribute. This can be done using the Data Import feature for Google Analytics 4. Based on the prediction values you can Create and edit audiences and also do Audience targeting. For example, an audience can be users with prediction probability between 0.4 and 0.7, to represent users who are predicted to be “on the fence” between churning and returning.
- For Firebase Apps, you can use the Import segments feature. You can tailor user experience by targeting your identified users through Firebase services such as Remote Config, Cloud Messaging, and In-App Messaging. This will involve importing the segment data from BigQuery into Firebase. After that you can send notifications to the users, configure the app for them, or follow the user journeys across devices.
- Run targeted marketing campaigns via CRMs like Salesforce, e.g. send out reminder emails.
You can find all of the code used in this blogpost in the Github repository:
What’s next?
Continuous model evaluation and re-training
As you collect more data from your users, you may want to regularly evaluate your model on fresh data and re-train the model if you notice that the model quality is decaying.
Continuous evaluation—the process of ensuring a production machine learning model is still performing well on new data—is an essential part in any ML workflow. Performing continuous evaluation can help you catch model drift, a phenomenon that occurs when the data used to train your model no longer reflects the current environment.
To learn more about how to do continuous model evaluation and re-train models, you can read the blogpost: Continuous model evaluation with BigQuery ML, Stored Procedures, and Cloud Scheduler
More resources
If you’d like to learn more about any of the topics covered in this post, check out these resources:
- BigQuery export of Google Analytics data
- BigQuery ML quickstart
- Events automatically collected by Google Analytics 4
- Qwiklabs: Create ML models with BigQuery ML
Or learn more about how you can use BigQuery ML to easily build other machine learning solutions:
- How to build demand forecasting models with BigQuery ML
- How to build a recommendation system on e-commerce data using BigQuery ML
Let us know what you thought of this post, and if you have topics you’d like to see covered in the future! You can find us on Twitter at @polonglin and @_mkazi_.Thanks to reviewers: Abhishek Kashyap, Breen Baker, David Sabater Dinter.
More Relevant Stories for Your Company


NLP in Healthcare Can Unlock Clinical Insights beyond Typical Data Format Barriers
Aches and pains. What, if anything, is the difference between those? And do you know a “myocardial infarction” from a “heart attack”? What about an “MI”? Is that shorthand, or part of the address of a hospital in Michigan? For people, it can be easy to understand the distinctions and

Google Introduces ML-based Predictive Autoscaling to Forecast Capacity and Match Scaling Demands
At Google Cloud, we believe you get most benefits from the cloud when you scale infrastructure based on changing demand. Compute Engine allows you to configure autoscaling to save costs during periods of low demand, and add capacity to support peak loads. When you use a managed instance group (MIG), you can have an autoscaler

Looking for a Cloud Data Warehouse? Find out Why Forrester Thinks Google BigQuery is a Leader
We are thrilled to announce that Google has been named a Leader in The Forrester Wave™: Cloud Data Warehouse, Q1 2021 report. For more than a decade, BigQuery, our petabyte-scale cloud data warehouse, has been in a class of its own. We're excited to share this recognition and we want to thank
