





3884
Of your peers have already watched this video.
3:20 Minutes
The most insightful time you'll spend today!
Leveraging APIs to Deliver Connected Customer Experiences
What does the connected customer experience even mean? It’s not just about a checklist of assets like website and mobile but how those channels seamlessly work together with the physical world to give your customer great experiences with your brand.
Modern APIs enable companies to mask back-end complexities behind a predictable developer-friendly interface. These APIs create ways for developers to easily and securely connect legacy systems with all kinds of applications and devices. Well managed APIs give businesses the flexibility to adapt to changing the environment and bring new user experiences to the market easily.
Watch how APIs can help make this happen in this 3-minute video.
6534
Of your peers have already watched this video.
24:00 Minutes
The most insightful time you'll spend today!
Swarovski’s Journey towards Online and Offline Conversion with Predictive Analytics
Luxury brand and leader in crystals and glass production, Swarovski has charmed customers with its exquisite collections for over 125 years. To understand their customers better and map their online behaviors, Swarovski had to overcome prediction hurdles as majority of the purchases are not frequent or habitual. They are mostly impulse buys or have no rational behind the purchase in order for the brand to accurately map customers’ interest and delight them with relevant personalization or website customization strategy.
Swarovski used a machine learning (ML) model to predict the most performing SKUs and list of products based on both online and offline indicators to target buyers. A score was assigned to each product in the list and was personalized at the country level that delivered relevant insights. Swarovski is aiming to expand the product listing page to personalize at customer level. Watch the video to dive deep into Swarovski’s data analytics efforts to answer complex questions, reporting and prediction using both online and offline data.
10165
Of your peers have already watched this video.
1:00 Minutes
The most insightful time you'll spend today!
Predict User Churn on Gaming Apps with Google Analytics Data using BigQuery ML
User retention can be a major challenge for mobile game developers. According to the Mobile Gaming Industry Analysis in 2019, most mobile games only see a 25% retention rate for users after the first day. To retain a larger percentage of users after their first use of an app, developers can take steps to motivate and incentivize certain users to return. But to do so, developers need to identify the propensity of any specific user returning after the first 24 hours.
In this blog post, we will discuss how you can use BigQuery ML to run propensity models on Google Analytics 4 data from your gaming app to determine the likelihood of specific users returning to your app.
You can also use the same end-to-end solution approach in other types of apps using Google Analytics for Firebase as well as apps and websites using Google Analytics 4. To try out the steps in this blogpost or to implement the solution for your own data, you can use this Jupyter Notebook.
Using this blog post and the accompanying Jupyter Notebook, you’ll learn how to:
- Explore the BigQuery export dataset for Google Analytics 4
- Prepare the training data using demographic and behavioural attributes
- Train propensity models using BigQuery ML
- Evaluate BigQuery ML models
- Make predictions using the BigQuery ML models
- Implement model insights in practical implementations
Google Analytics 4 (GA4) properties unify app and website measurement on a single platform and are now default in Google Analytics. Any business that wants to measure their website, app, or both, can use GA4 for a more complete view of how customers engage with their business. With the launch of Google Analytics 4, BigQuery export of Google Analytics data is now available to all users. If you are already using a Google Analytics 4 property, you can follow this guide to set up exporting your GA data to BigQuery.
Once you have set up the BigQuery export, you can explore the data in BigQuery. Google Analytics 4 uses an event-based measurement model. Each row in the data is an event with additional parameters and properties. The Schema for BigQuery Export can help you to understand the structure of the data.
In this blogpost, we use the public sample export data from an actual mobile game app called “Flood It!” (Android, iOS) to build a churn prediction model. But you can use data from your own app or website.
Here’s what the data looks like. Each row in the dataset is a unique event, which can contain nested fields for event parameters.
SELECT *FROM `firebase-public-project.analytics_153293282.events_*`TABLESAMPLE SYSTEM (1 PERCENT)

This dataset contains 5.7M events from over 15k users.
SELECTCOUNT(DISTINCT user_pseudo_id) as count_distinct_users,COUNT(event_timestamp) as count_eventsFROM`firebase-public-project.analytics_153293282.events_*

Our goal is to use BigQuery ML on the sample app dataset to predict propensity to user churn or not churn based on users’ demographics and activities within the first 24 hours of app installation.

In the following sections, we’ll cover how to:
- Pre-process the raw event data from GA4
- Identify users & the label feature
- Process demographic features
- Process behavioral features
- Train classification model using BigQuery ML
- Evaluate the model using BigQueryML
- Make predictions using BigQuery ML
- Utilize predictions for activation
Pre-process the raw event data
You cannot simply use raw event data to train a machine learning model as it would not be in the right shape and format to use as training data. So in this section, we’ll go through how to pre-process the raw data into an appropriate format to use as training data for classification models.
This is what the training data should look like for our use case at the end of this section:

Notice that in this training data, each row represents a unique user with a distinct user ID (user_pseudo_id).
Identify users & the label feature
We first filtered the dataset to remove users who were unlikely to return the app anyway. We defined these ‘bounced’ users as ones who spent less than 10 mins with the app. Then we labeled all remaining users:
- churned: No event data for the user after 24 hours of first engaging with the app.
- returned: The user has at least one event record after 24 hours of first engaging with the app.
For your use case, you can have a different definition of bounce and churning. Also you can even try to predict something else other than churning, e.g.:
- whether a user is likely to spend money on in-game currency
- likelihood of completing n-number of game levels
- likelihood of spending n amount of time in-game etc.
In such cases, label each record accordingly so that whatever you are trying to predict can be identified from the label column.
From our dataset, we found that ~41% users (5,557) bounced. However, from the remaining users (8,031), ~23% (1,883) churned after 24 hours:
SELECTbounced,churned,COUNT(churned) as count_usersFROMbqmlga4.returningusersGROUP BY 1,2ORDER BY bounced

To create these bounced and churned columns, we used the following snippet of SQL code.
...#churned = 1 if last_touch within 24 hr of app installation, else 0IF (user_last_engagement < TIMESTAMP_ADD(user_first_engagement,INTERVAL 24 HOUR),1,0 ) AS churned,#bounced = 1 if last_touch within 10 min, else 0IF (user_last_engagement <= TIMESTAMP_ADD(user_first_engagement,INTERVAL 10 MINUTE),1,0 ) AS bounced,...
You can view the Jupyter Notebook for the full query used for materializing the bounced and churned labels.
Process demographic features
Next, we added features both for demographic data and for behavioral data spanning across multiple columns. Having a combination of both demographic data and behavioral data helps to create a more predictive model.
We used the following fields for each user as demographic features:
geo.countrydevice.operating_systemdevice.language
A user might have multiple unique values in these fields — for example if a user uses the app from two different devices. To simplify, we used the values from the very first user engagement event.
CREATE OR REPLACE VIEW bqmlga4.user_demographics AS (WITH first_values AS (SELECTuser_pseudo_id,geo.country as country,device.operating_system as operating_system,device.language as language,ROW_NUMBER() OVER (PARTITION BY user_pseudo_id ORDER BY event_timestamp DESC) AS row_numFROM `firebase-public-project.analytics_153293282.events_*`WHERE event_name="user_engagement")SELECT * EXCEPT (row_num)FROM first_valuesWHERE row_num = 1 #first engagement);
Process behavioral features
There is additional demographic information present in the GA4 export dataset, e.g. app_info, device, event_params, geo etc. You may also send demographic information to Google Analytics through each hit via user_properties. Furthermore, if you have first-party data on your own system, you can join that with the GA4 export data based on user_ids.
To extract user behavior from the data, we looked into the user’s activities within the first 24 hours of first user engagement. In addition to the events automatically collected by Google Analytics, there are also the recommended events for games that can be explored to analyze user behavior. For our use case, to predict user churn, we counted the number of times the follow events were collected for a user within 24 hours of first user engagement:
user_engagementlevel_start_quickplaylevel_end_quickplaylevel_complete_quickplaylevel_reset_quickplaypost_scorespend_virtual_currencyad_rewardchallenge_a_friendcompleted_5_levelsuse_extra_steps
The following query shows how these features were calculated:
WITHevents_first24hr AS (SELECTe.*FROM`firebase-public-project.analytics_153293282.events_*` eJOINbqmlga4.returningusers rONe.user_pseudo_id = r.user_pseudo_idWHERETIMESTAMP_MICROS(e.event_timestamp) <= r.ts_24hr_after_first_engagement)SELECTuser_pseudo_id,SUM(IF(event_name = 'user_engagement', 1, 0)) AS cnt_user_engagement,# ... repeated for all behavior data ...SUM(IF(event_name = 'use_extra_steps', 1, 0)) AS cnt_use_extra_steps,FROMevents_first24hrGROUP BY1
View the notebook for the query used to aggregate and extract the behavioral data. You can use different sets of events for your use case. To view the complete list of events, use the following query:
SELECTevent_name,COUNT(event_name) as event_countFROM`firebase-public-project.analytics_153293282.events_*`GROUP BY 1ORDER BYevent_count DESC
After this we combined the features to ensure our training dataset reflects the intended structure. We had the following columns in our table:
- User ID:
user_pseudo_id
- Label:
churned
- Demographic features
countrydevice_osdevice_language
- Behavioral features
cnt_user_engagementcnt_level_start_quickplaycnt_level_end_quickplaycnt_level_complete_quickplaycnt_level_reset_quickplaycnt_post_scorecnt_spend_virtual_currencycnt_ad_rewardcnt_challenge_a_friendcnt_completed_5_levelscnt_use_extra_stepsuser_first_engagement
At this point, the dataset was ready to train the classification machine learning model in BigQuery ML. Once trained, the model will output a propensity score between churn (churned=1) or return (churned=0) indicating the probability of a user churning based on the training data.
Train classification model
When using the CREATE MODEL statement, BigQuery ML automatically splits the data between training and test. Thus the model can be evaluated immediately after training (see the documentation for more information).
For the ML model, we can choose among the following classification algorithms where each type has its own pros and cons:

Often logistic regression is used as a starting point because it is the fastest to train. The query below shows how we trained the logistic regression classification models in BigQuery ML.
CREATE OR REPLACE MODEL bqmlga4.churn_logregTRANSFORM(EXTRACT(MONTH from user_first_engagement) as month,EXTRACT(DAYOFYEAR from user_first_engagement) as julianday,EXTRACT(DAYOFWEEK from user_first_engagement) as dayofweek,EXTRACT(HOUR from user_first_engagement) as hour,* EXCEPT(user_first_engagement, user_pseudo_id))OPTIONS(MODEL_TYPE="LOGISTIC_REG",INPUT_LABEL_COLS=["churned"]) ASSELECT*FROMbqmlga4.train
We extracted month, julianday, and dayofweek from datetimes/timestamps as one simple example of additional feature preprocessing before training. Using TRANSFORM() in your CREATE MODEL query allows the model to remember the extracted values. Thus, when making predictions using the model later on, these values won’t have to be extracted again. View the notebook for the example queries to train other types of models (XGBoost, deep neural network, AutoML Tables).
Evaluate model
Once the model finished training, we ran ML.EVALUATE to generate precision, recall, accuracy and f1_score for the model:
SELECT*FROMML.EVALUATE(MODEL bqmlga4.churn_logreg)

The optional THRESHOLD parameter can be used to modify the default classification threshold of 0.5. For more information on these metrics, you can read through the definitions on precision and recall, accuracy, f1-score, log_loss and roc_auc. Comparing the resulting evaluation metrics can help to decide among multiple models.Furthermore, we used a confusion matrix to inspect how well the model predicted the labels, compared to the actual labels. The confusion matrix is created using the default threshold of 0.5, which you may want to adjust to optimize for recall, precision, or a balance (more information here).
SELECTexpected_label,_0 AS predicted_0,_1 AS predicted_1FROMML.CONFUSION_MATRIX(MODEL bqmlga4.churn_logreg)

This table can be interpreted in the following way:

Make predictions using BigQuery ML
Once the ideal model was available, we ran ML.PREDICT to make predictions. For propensity modeling, the most important output is the probability of a behavior occurring. The following query returns the probability that the user will return after 24 hrs. The higher the probability and closer it is to 1, the more likely the user is predicted to return, and the closer it is to 0, the more likely the user is predicted to churn.
SELECTuser_pseudo_id,returned,predicted_returned,predicted_returned_probs[OFFSET(0)].prob as probability_returnedFROMML.PREDICT(MODEL bqmlga4.churn_logreg,(SELECT * FROM bqmlga4.train)) #can be replaced with a proper test dataset
Utilize predictions for activation
Once the model predictions are available for your users, you can activate this insight in different ways. In our analysis, we used user_pseudo_id as the user identifier. However, ideally, your app should send back the user_id from your app to Google Analytics. In addition to using first-party data for model predictions, this will also let you join back the predictions from the model into your own data.
- You can import the model predictions back into Google Analytics as a user attribute. This can be done using the Data Import feature for Google Analytics 4. Based on the prediction values you can Create and edit audiences and also do Audience targeting. For example, an audience can be users with prediction probability between 0.4 and 0.7, to represent users who are predicted to be “on the fence” between churning and returning.
- For Firebase Apps, you can use the Import segments feature. You can tailor user experience by targeting your identified users through Firebase services such as Remote Config, Cloud Messaging, and In-App Messaging. This will involve importing the segment data from BigQuery into Firebase. After that you can send notifications to the users, configure the app for them, or follow the user journeys across devices.
- Run targeted marketing campaigns via CRMs like Salesforce, e.g. send out reminder emails.
You can find all of the code used in this blogpost in the Github repository:
What’s next?
Continuous model evaluation and re-training
As you collect more data from your users, you may want to regularly evaluate your model on fresh data and re-train the model if you notice that the model quality is decaying.
Continuous evaluation—the process of ensuring a production machine learning model is still performing well on new data—is an essential part in any ML workflow. Performing continuous evaluation can help you catch model drift, a phenomenon that occurs when the data used to train your model no longer reflects the current environment.
To learn more about how to do continuous model evaluation and re-train models, you can read the blogpost: Continuous model evaluation with BigQuery ML, Stored Procedures, and Cloud Scheduler
More resources
If you’d like to learn more about any of the topics covered in this post, check out these resources:
- BigQuery export of Google Analytics data
- BigQuery ML quickstart
- Events automatically collected by Google Analytics 4
- Qwiklabs: Create ML models with BigQuery ML
Or learn more about how you can use BigQuery ML to easily build other machine learning solutions:
- How to build demand forecasting models with BigQuery ML
- How to build a recommendation system on e-commerce data using BigQuery ML
Let us know what you thought of this post, and if you have topics you’d like to see covered in the future! You can find us on Twitter at @polonglin and @_mkazi_.Thanks to reviewers: Abhishek Kashyap, Breen Baker, David Sabater Dinter.
Enhancing Romi’s Conversations: The Role of BigQuery and LLMs
901
Of your peers have already read this article.
3:30 Minutes
The most insightful time you'll spend today!
MIXI, Inc. (MIXI) is a social networking organization that provides a diverse range of services for friends and family to enjoy together, such as the social-media platform mixi, a mobile game called Monster Strike, and a family photo and video sharing service known as FamilyAlbum. One of our current projects is Romi, a social robot launched in April 2021 that uses Speech-to-Text by Google Cloud as its speech recognition engine.
Since the late 2010s, the social robot market has been booming, with some models becoming increasingly affordable for consumers, from robotic tutors that promote social and cognitive development for children, to companion robots for elderly care. But with Romi, there is a marked difference in the quality of dialogue that makes Romi distinct from most social robots.
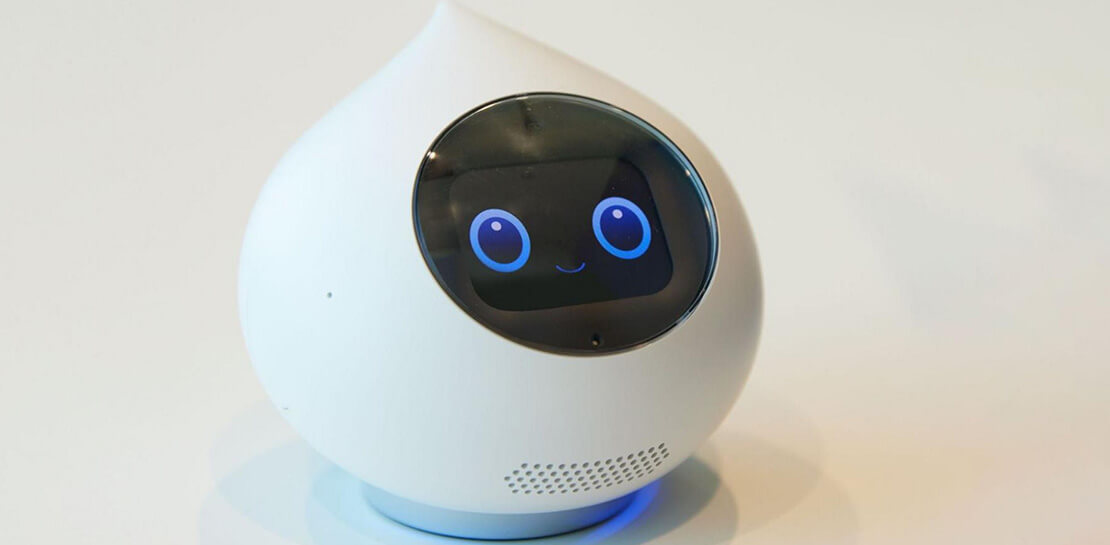
The biggest feature of Romi is that the AI developed internally by MIXI can generate natural exchange of communication. The size of a hand-held device, Romi can be placed anywhere in a room and has a screen to demonstrate different facial expressions. It responds to conversation within context. Until now, AI has been used to interpret the intentions behind user speech, but Romi is an AI-powered robot that takes it a step further, generating spoken conversations. After all, Romi was created to offer heartwarming communication to those who are looking for it. This form of speech recognition did not exist before Romi was released. We hope users will enjoy conversing with it, including the occasional unexpected response.

The speech recognition part was one of the most critical aspects of Romi. Most of the infrastructure that makes up Romi uses a main public cloud, which was used for other services then. As for speech recognition, we decided to try out the Speech-to-Text tool by Google Cloud, which was praised for its overwhelmingly high accuracy, and the prototype’s results were very positive. Even though we tried other companies’ services before making the final decision, our conclusion about Speech-to-Text remains the same.
The accuracy and responsiveness of Speech-to-Text made the tool an effective one for a social robot like Romi. Google Cloud also provided a sense of security with its high reliability that has been demonstrated in enabling Romi’s workloads, and will be able to support continuous development of Romi’s services for the long run.
With the rapid development of speech recognition technology, MIXI decided to re-examine the speech recognition engine for Romi in June 2022, about a year after its release. We eventually decided to continue its use of Speech-to-Text. We reviewed about 10 companies’ Japanese-compatible speech recognition engines, and found that Speech-to-Text offered the best results. In addition, Speech-to-Text has several speech recognition transcription models, but we found that the latest short model, which specializes in short utterances, is more suitable for Romi than the default model.
The cost-savings that Speech-to-Text delivers is also impressive. The billing unit was changed from 15 seconds increments rounded up, to one second in November, and huge cost reductions could be expected with Romi. This is important to us because Romi does not have trigger phrases, such as “OK Google,” so as to achieve more natural conversations. As a result, it can recognize and process more speech as compared to other social robots. While this results in a more user-friendly experience, it also requires greater workloads and can incur a higher cost compared to most speech recognition engines. But with the updated billing system that Speech-to-Text delivers, we are able to continue refining Romi’s speech recognition accuracy while keeping costs low.
Improving data analysis with BigQuery
Google Cloud was only used for speech recognition initially, but as Romi’s range of service expanded, more aspects of Romi were hosted on Google Cloud. Among these features, the machine learning platform for AI was moved to Google Cloud at an early stage. To be able to make use of a cloud platform at an affordable cost makes Google Cloud very appealing. Premium Support and technical account management helped us with our cost considerations.
Furthermore, MIXI started migrating the data analysis platform for Romi to BigQuery last year. BigQuery was chosen because it excels at bringing together and analyzing big data in various formats, as in-depth data analysis becomes necessary to improve Romi’s services. What also makes BigQuery an attractive choice was the ability to introduce structured query language (SQL) to BigQuery, a language that the development team from MIXI is familiar with.
In particular, we are grateful for the use of software like Looker. It takes a lot of work, even for engineers, to write complex queries, but with Looker, even non-engineers can intuitively perform fairly complex analysis. About half a year ago, we held regular briefings mainly for employees interested in data analysis, and now they voluntarily conduct analysis, conduct discussions based on the results, and create new projects and ideas. This has become a regular workflow for us.
Currently, what is popular in AI-based communication is the emergence of large-scale language models (LLMs) that learn from huge amounts of data, and generate natural responses on a different level than before.
To improve the conversational experience with Romi, we have been looking into relevant LLM technologies for a while now. It is important to be able to use high performance GPUs as inexpensively as possible in order to run PoC at high speed. We will continue to focus on Google Cloud services, including Compute Engine and VertexAI.
Transforming Businesses with Google Distributed Cloud Edge Appliance: A Look at Real-World Use Cases

2537
Of your peers have already read this article.
4:30 Minutes
The most insightful time you'll spend today!
While many organizations are driving digital transformation by migrating to the cloud, there are some industries, geographies, and use cases that require a different approach to cloud modernization. Regulated industries such as healthcare, insurance, pharmaceutical, energy, telecommunication, and banking have stringent data residency and sovereignty requirements. Other industries need to meet local data processing requirements, while others require real-time data processing with sub-millisecond latencies, for example to detect defects on manufacturing lines. These use cases demand a combination of edge, on-premises and cloud services for their infrastructure.
With these requirements in mind, Google Cloud launched Google Distributed Cloud powered by Anthos to extend the power of Google Cloud infrastructure and services to the edge (or closer). The underlying infrastructure for this service comes in two variants: a 42U rack filled with compute, storage, and networking devices called Google Distributed Cloud Edge Rack and a 1U appliance called Google Distributed Cloud Edge Appliance.
In this blog post, we discuss the Google Distributed Cloud Edge Appliance and how manufacturing, retail, and automotive industry verticals can use it to address common use cases.
How the appliance works
But first, let’s talk about the Google Distributed Cloud Edge Appliance itself.
Google Distributed Cloud Edge Appliances comprises two components: (1) Distributed Cloud Edge infrastructure and (2) the Distributed Cloud Edge service.
The Google Distributed Cloud Edge service runs on Google Cloud and serves as a control plane for the nodes and clusters running on your appliance. In order to perform remote management of the appliance and to collect metrics, the Distributed Cloud Edge service must be connected to Google Cloud at all times, allowing you to manage your workloads on the edge hardware through the Google Cloud Console. For customers who can’t be connected at all times for data residency or sovereignty reasons, we highly recommend that the appliance be connected to the cloud at least once a month to allow for needed security patches and updates.
Google Distributed Cloud Edge Appliances come with built-in network ports that provide connectivity to the control plane via the internet, Cloud VPN, or Dedicated Interconnect, and to your on-prem network. Each Google Distributed Cloud Edge Appliance is homed to a specific Google Cloud region but it is designed to also use any public Google Cloud endpoint to communicate with the control plane in Google Cloud, allowing you to move these appliances between different geographic locations.
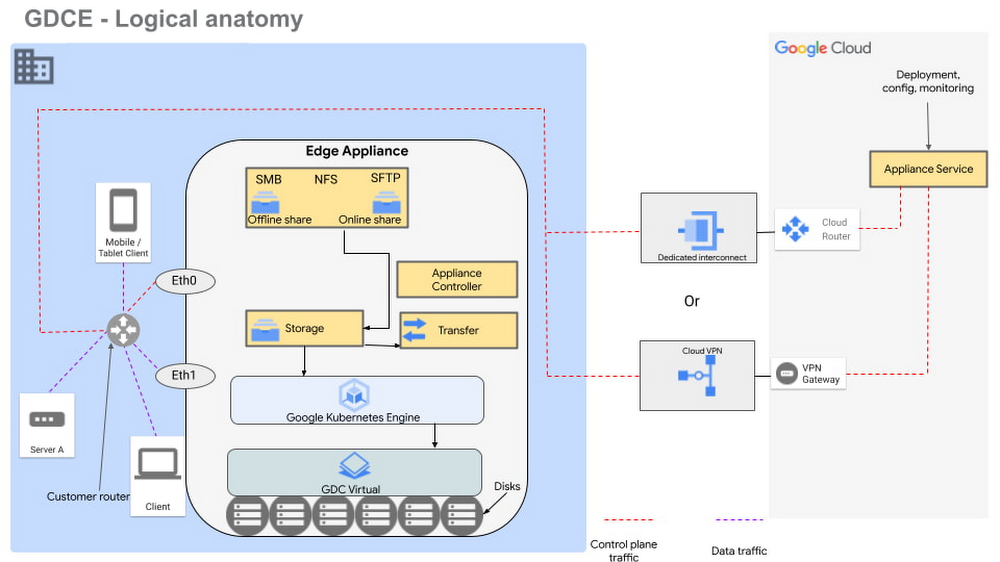
Figure 1 – Logical design of Google Distributed Cloud Edge Appliance
There are two NFS shares on each appliance; one is offline, meaning it does not transfer data to Google Cloud, and the other is online, meaning data saved to that share is synced to Cloud Storage on Google Cloud for further processing. The appliance supports Server Message Block (SMB) and Secure File Transfer Protocols (SFTP) for communication.
Each Google Distributed Cloud Edge Appliance runs Google Distributed Cloud Virtual, enabling you to build a single-node Kubernetes cluster with access to the underlying file system of the appliance. This allows you to build containerized applications on the underlying appliance hardware to address use cases in the following verticals.
Vertical use cases
Now that you understand how Google Cloud Edge Appliance is configured, let’s consider some of the industry use cases where it can provide unique value.
Manufacturing
In the manufacturing industry, quality control and safety is a crucial factor. Businesses need to ensure products are manufactured to the highest standards to remain competitive in their markets, to retain customers, and to keep factory workers safe. To do this, manufacturers need real-time data about the products being manufactured on the production lines, ensuring quality control and gaining a real-time view of where people are on the factory floor.
In manufacturing environments, Google Distributed Cloud Edge Appliance can be used to detect hazards or manufacturing defects in real-time. Figure 1 is a reference architecture for a hazard detection solution running off a Google Distributed Cloud Edge Appliance on a factory floor.
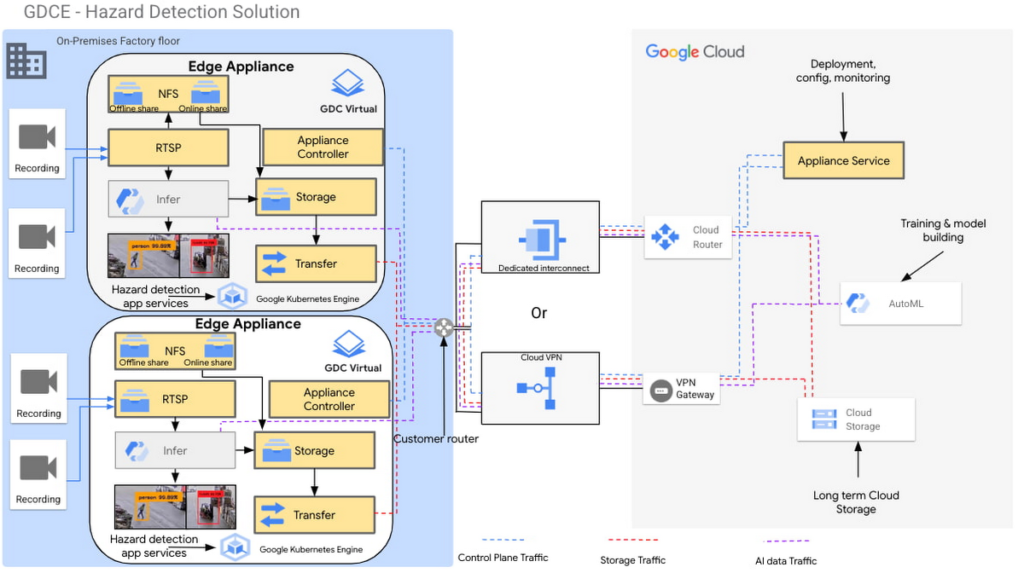
Figure 2 – Hazard detection architecture using Google Distributed Cloud Edge Appliance
In this architecture, cameras on the factory floor stream live video into the Google Distributed Cloud Edge Appliance. Depending on the number of cameras and appliances, cameras could be split or mapped to different appliances. This architecture makes it possible to initially transfer video data to Google Cloud using an online NFS share. Once in Google Cloud, you can use AutoML to train and build models that can be used as part of the hazard detection solution.
With these trained models, the cameras can stream video data into the appliance using the real-time streaming protocol (RTSP). You can then use AutoML inference to analyze the real-time video streaming data.
For example, in this reference architecture, if an individual comes too close to the fork lift, a function is triggered by the microservices running on the edge appliance that pushes a notification either to a messaging service, or to an enterprise resource planning tool. This alerts factory managers to factory floor hazards in real time so they can take corrective action.
You can also review messages and videos later on for preventive planning purposes, or push streamed videos to Cloud Storage for archive, to use the appliance’s storage space more efficiently.
Data transfers to Google Cloud can be done over Google Cloud Dedicated Interconnect, or VPN between the region and your site. This connectivity also allows you to send the appliance’s control-plane network traffic to the region.
You could also use the reference architecture in figure 2 for a product anomaly detection solution running off a Google Distributed Cloud Edge Appliance on a factory floor or manufacturing line. In this instance, machine learning models are trained to detect anomalies on finished products before final packaging.
Retail
In the retail industry, the Google Distributed Cloud Edge Appliance reference architecture in Figure 2 enables a number of transformative capabilities for retail operations, including:
- contactless checkout
- product scans
- mobile-scan-bag
- cashierless checkout
- unattended retail shops
- visual check-out monitoring
It does all this within a retailer’s facilities with the low latency and high throughput you need to process data locally, so you can obtain actionable insights from your data.
Or, you could use Google Distributed Cloud Edge Appliance at the edge to overhaul store management operations, for example, monitoring store occupancy, queue depth and wait times, detecting slips and falls and out-of-stock items, or monitoring inventory compliance.
Automotive
Advanced Driver Assistance Systems (ADAS) are becoming standard in modern automobiles. To successfully build and roll out continued improvements around ADAS, the automotive industry continues to run extensive tests on ADAS systems that are built into the vehicles they manufacture. Automotive companies can use Google Distributed Cloud Edge Appliance to modernize and transform how they collect data for the ADAS systems they’re developing. For example, test vehicles contain several different sensors that generate data, which can be quickly offloaded to an in-vehicle edge appliance.
Then, within the appliance, you can deploy containerized workloads to transform sensor data, infer videos and images and detect events. This alleviates the need for operators to label all events and allows development teams to quickly gather insights from the tests.
If you want to focus on a subset of information, you can transfer specific data or the entire data payload into Transfer Appliances when vehicles return to the development center. All these systems, i.e., transfer appliances and edge appliances, work in tandem to reduce local system administration and operational costs through a cloud-based control plane.
This approach allows you to deploy, track, monitor and configure services that are running in data centers or at edge locations from the cloud. From the factories, the data can be moved offline or online into Google Cloud where you can use different storage classes and processing capabilities to further process or store the data. You can also deploy newly trained models and business rules back to the edge appliances. In all this, data transfers between the cloud and the appliance are performed using end-to-end encryption, to give you control over your data.
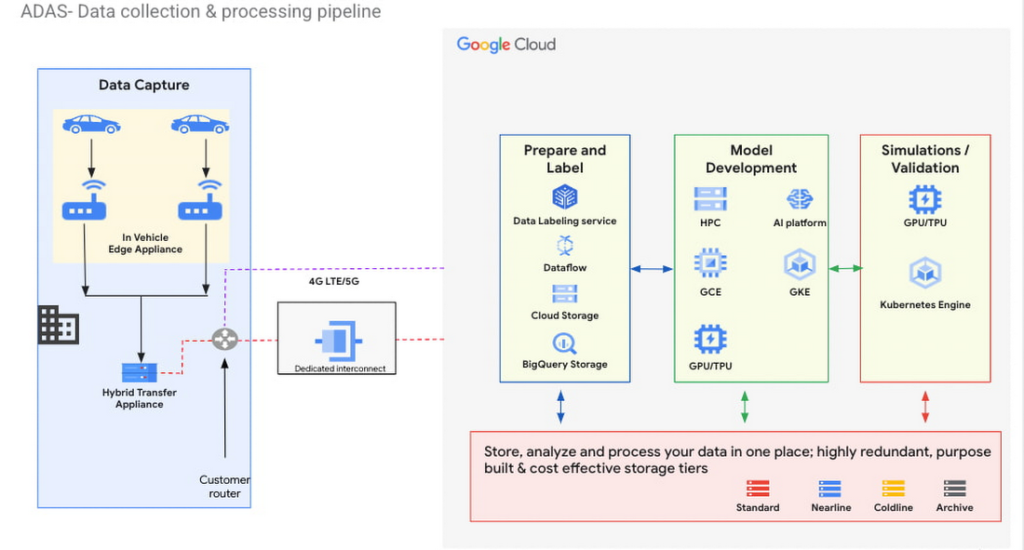
Figure 3 – ADAS implementation with a Google Distributed Cloud Edge Appliance
The reference architecture in Figure 3 shows an ADAS implementation where Google Distributed Cloud Edge Appliance is being used to gather, process and transform data at the edge in the automotive industry. It could also be applied to data capture and processing use cases in manned and unmanned vehicles. Notice how the Distributed Edge Appliance extends to the cloud by sending data there, or using other cloud-based services.
We’re just getting started
These are just a few of the use cases where organizations in the manufacturing, retail and automotive industries are using Google Distributed Cloud Edge Appliance with modern and containerized applications that are powered by Google Cloud. If you’re interested in bringing the power of Google Cloud to the edge using Google Distributed Cloud Edge Appliances to transform your business, reach out to us or any of our accredited partners.
Scaling with Breaking News: BBC’s Serverless Infrastructure on Google Cloud

1274
Of your peers have already read this article.
3:30 Minutes
The most insightful time you'll spend today!
Editors note: Today’s post is from Neil Craig at the British Broadcasting Corporation (BBC), the national broadcaster of the United Kingdom. Neil is part of the BBC’s Digital Distribution team which is responsible for building the services such as the public-facing www bbc.co.uk and .com websites and ensuring they are able to scale and operate reliably.
The BBC’s public-facing websites inform, educate, and entertain over 498 million adults per week across the world. Because breaking news is so unpredictable, we need a core content delivery platform that can easily scale in response to surges in traffic, which can be quite unpredictable.
To this end, we recently rebuilt our log-processing infrastructure on a Google Cloud serverless platform. We’ve found that the new system, based on Cloud Storage, Eventarc, Cloud Run and BigQuery, enables us to provide a reliable and stable service without us having to worry about scaling up during busy times. We’re also able to save license fee payers money by operating the service more cost effectively than our previous architecture. Not having to manually manage the scale of major components of the stack has freed up our time, allowing us to spend it on using, rather than creating the data.
A log in time
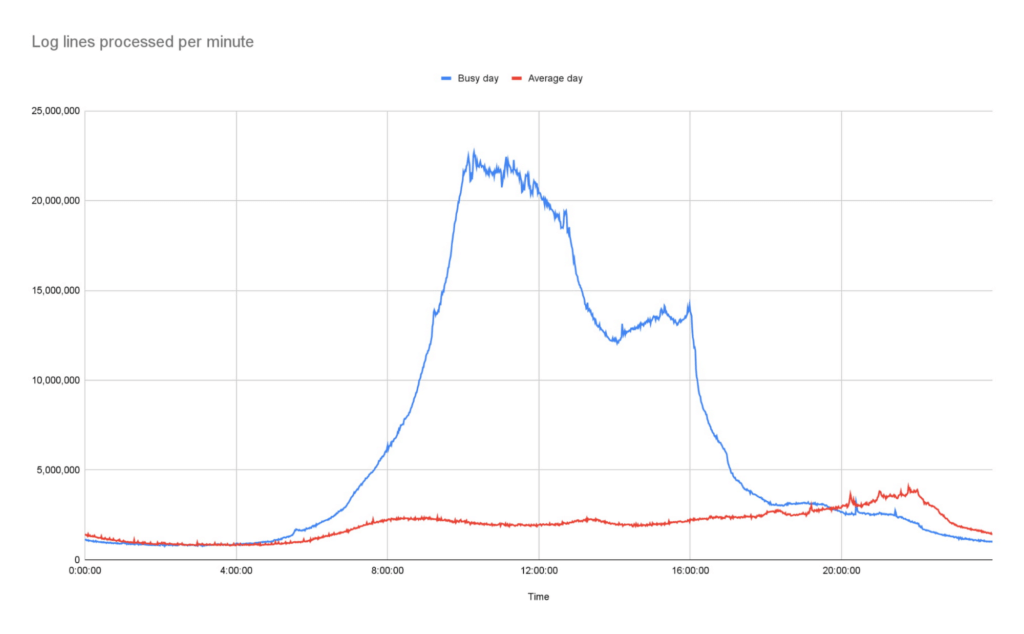
To operate the site and ensure our services run smoothly we continually monitor Traffic Manager and CDN access logs. Our websites generate more than 3B log lines per day, and handle large data bursts during major news events; on a busy day our system supports over 26B log lines in a single day.
As initially designed, we stored log data in a Cloud Storage bucket. But every time we needed to access that data, we had to download terabytes of logs down to a virtual machine (VM) with a large amount of attached storage, and use the ‘grep’ tool to search and analyze them. From beginning to end, this took us several hours. On heavy news days, the time lag made it difficult for the engineering team to do their jobs.
We needed a more efficient way to make this log data available, so we designed and deployed a new system that deals with logs and reacts to spikes more efficiently as they arrive, improving the timeliness of critical information significantly.
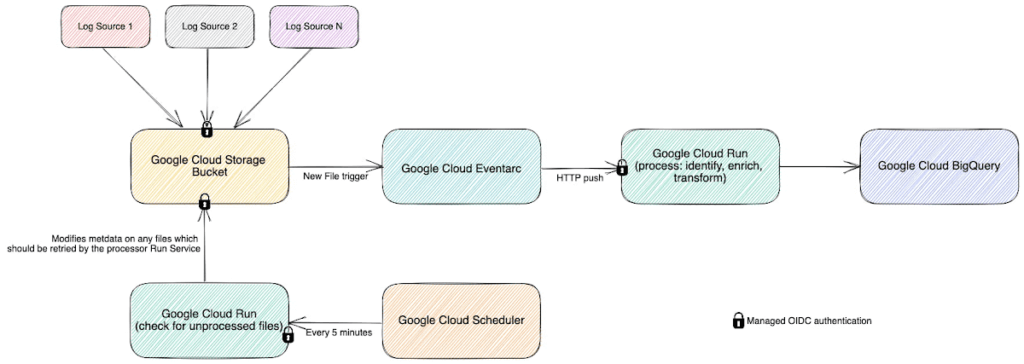
In this new system, we still leverage Cloud Storage buckets, but on arrival, each log generates an event using EventArc. That event triggers Cloud Run to validate, transform and enrich various pieces of information about the log file such as filename, prefix, and type, then processes it and outputs the processed data as a stream into BigQuery. This event-driven design allows us to process files quickly and frequently — processing a single log file typically takes less than a second. Most of the files that we feed into the system are small, fewer than 100 Megabytes, but for larger files, we automatically split those into multiple files and Cloud Run automatically creates additional parallel instances very quickly, helping the system scale almost instantly.
The nature of running a global website which provides news coverage means we see frequent, unpredictable large spikes of traffic. We learn from these and optimize our systems where necessary so we’re confident in the system’s ability to handle significant traffic. For example, around the time of the announcement of the Queen’s passing in September, we saw some huge traffic spikes. During the largest, within one minute, we went from running 150 – 200 container instances to over 1000…. and the infrastructure just worked. Because we engineered the log processing system to rely on the elasticity of a serverless architecture, we knew from the get-go that it would be able to handle this type of scaling.
Around the time of the announcement of the Queen’s passing in September, we saw some huge traffic spikes. During the largest, within one minute, we went from running 150 – 200 container instances to over 1000…. and the infrastructure just worked
Our initial concern about choosing serverless was cost. It turns out that using Cloud Run is significantly more cost-effective than running the number of VMs we would need for a system that could survive reasonable traffic spikes with a similar level of confidence.
Switching to Cloud Run also allows us to use our time more efficiently, as we no longer need to spend time managing and monitoring VM scaling or resource usage. We picked Cloud Run intentionally because we wanted a system that could scale well without manual intervention. As the digital distribution team, our job is not to do ops work on the underlying components of this system — we leave that to the specialist ops teams at Google.
Another conscious choice we made whilst rebuilding the system was to use the built-in service-to-service authentication in Google Cloud. Rather than implementing and maintaining the authentication mechanism ourselves, we add some simple configuration which instructs the client side to create and send a OIDC token for a service account we define and the server side to authenticate and authorize the client. Another example is pushing events into Cloud Run, where we can configure Cloud Run authorization to only accept events from specific EventArc triggers, so it is fully private.
Going forward, the new system has allowed us to make better use of our data safely. For example, BigQuery’s per-column permissions allow us to open up access to our logs to other engineering teams around the organization, without having to worry about sharing PII that’s restricted to approved users.
The goal of our team is to empower all teams within the BBC to get the content they want on the web when they want it, make it reliable, secure, and make sure it can scale. Google Cloud serverless products helped us to achieve these goals with relatively little effort and require significantly less management than previous generations of technology.
More Relevant Stories for Your Company

Why Your Company Needs an Enterprise Gearbox
For most established businesses today, the disruptive start-up has emerged as the biggest and most intimidating competition. A start-up's digital prowess and astounding ability to innovate and scale massively in weeks, for what takes conventional businesses quarters, is daunting. How does one compete with that? To play in today’s digitally-connected

Cardinal Health Leads the Way in Healthcare App Modernization
Apps play a critical role in an ever-expanding range of healthcare services, as patients and providers increasingly expect streamlined, engaging digital experiences. This means that IT must become faster, more agile, and free from the constraints of everyday infrastructure management. At Cardinal Health, we are continuously enhancing our technology to



Lowe’s: Building a Centralized Price Management Solution
Watch how American retail company specializing in home improvement Lowe's used Google Cloud to build a centralized price management solution. The company's application development team leveraged Google Cloud to enable the improvement of their software development life cycle - from code development to CI/CD and monitoring.

Benchmarking Report for Indian Businesses: The State of Digital Commerce APIs
APIs are the foundation for digital commerce, enabling retailers to evolve from web to mobile. APIs allow retailers to create services such as price check, compare and review products, get instant product availability, purchase, schedule pickup, and delivery, and improve customer engagement and loyalty--all from users’ mobile devices. Evolving from
