





4947
Of your peers have already watched this video.
49:30 Minutes
The most insightful time you'll spend today!
How to Migrate an Oracle Database to Google Cloud
As more enterprises migrate a growing number of workloads to the cloud, migrating databases, too, has become a key focus.
But migrating databases is also really tough. This is due to a number of different reasons.
The first one is that there’s a lot of proprietary technology and functionality that’s built into a lot of the legacy database technologies.
With Oracle, for example, that may be things like stored procedure, custom functions, Oracle RAC, so on and so forth.
This makes it really hard for database administrators to migrate to an equivalent cloud-native technology.
The second challenge is that historical on-prem databases are all quite monolithic.
These are humongous servers which don’t really fit into the cloud way of doing things.
So often, database administrators have to split these up into multiple servers in the cloud.
The third challenge, which a lot of companies underestimate, is the reliance of applications on databases.
Say, you are a company that’s been around for 10 to 15 years. As the business has grown, it’s added tens to hundreds of apps, both internal- and external-facing, that are all relying on the database.
So as you’re thinking about migration, it’s really important to consider the risks that are associated of migrating to different cloud technologies. Obviously, you would like to minimize your company’s exposure.
With that background, here are the steps, procedures, best practices, and how to solve the challenges associated with migrating on-premises Oracle databases to Google Cloud SQL PostgreSQL.
From source database migration assessment to schema conversion, data replication, and performance tuning, we will cover all of the basics required to get you started with your first Oracle to Cloud SQL migration project.
The Benefits of Cloud SQL for Business: Faster Deployments, Lower Costs, and Enhanced Agility

2779
Of your peers have already read this article.
3:00 Minutes
The most insightful time you'll spend today!
If you’re self-managing relational databases such as MySQL, PostgreSQL or SQL Server, you may be thinking about the pros and cons of cloud-based database services. Regardless of whether you’re running your databases on premises or in the cloud, self-managed databases can be inefficient and expensive, requiring significant effort around patching, hardware maintenance, backups, and tuning. Are managed database services a better option?
To answer this question, Google Cloud sponsored a business value white paper by IDC, based on the real-life experiences of eight Cloud SQL customers. Cloud SQL is an easy-to-use, fully-managed database service for running MySQL, PostgreSQL and SQL Server workloads. More than 90% of the top 100 Google Cloud customers use Cloud SQL.
The study found that migration to Cloud SQL unlocked significant efficiencies and cost reductions for these customers. Let’s take a look at the key benefits in this infographic.

A deeper dive into Cloud SQL benefits
To read the full IDC white paper, you can download it here: The Business Value of Cloud SQL: Google Cloud’s Relational Database Service for MySQL, PostgreSQL, and SQL Server, by Carl W. Olofson, Research Vice President, Data Management Software, IDC and Matthew Marden, Research Vice President, Business Value Strategy Practice, IDC.
Looking for commentary from IDC? Listen to the on-demand webinar, How Enterprises Have Achieved Greater Efficiency and Improved Business Performance using Google Cloud SQL, where Carl Olofson discusses the downsides of self-managed databases and the benefits of managed services like Cloud SQL, including the cost savings and improved business performance realized by the customers interviewed in the study.
Getting started
You can use our Database Migration Service for an easy, secure migration to Cloud SQL. Since Cloud SQL supports the same database versions, extensions and configuration flags as your existing MySQL, PostgreSQL and SQL Server instances, a simple lift-and-shift migration is usually all you need. So let Google Cloud take routine database administration tasks off your hands, and enjoy the scalability, reliability and openness that the cloud has to offer.
Start your journey with a Cloud SQL free trial.
BigQuery Explainable AI for Demystifying the Inner Workings of ML Models. Now GA!

6547
Of your peers have already read this article.
2:00 Minutes
The most insightful time you'll spend today!
Explainable AI (XAI) helps you understand and interpret how your machine learning models make decisions. We’re excited to announce that BigQuery Explainable AI is now generally available (GA). BigQuery is the data warehouse that supports explainable AI in a most comprehensive way w.r.t both XAI methodology and model types. It does this at BigQuery scale, enabling millions of explanations within seconds with a single SQL query.
Why is Explainable AI so important? To demystify the inner workings of machine learning models, Explainable AI is quickly becoming an essential and growing need for businesses as they continue to invest in AI and ML. With 76% of enterprises now prioritizing artificial intelligence (AI) and machine learning (ML) over other initiatives in 2021 IT budgets, the majority of CEOs (82%) believe that AI-based decisions must be explainable to be trusted according to a PwC survey.
While the focus of this blogpost is on BigQuery Explainable AI, Google Cloud provides a variety of tools and frameworks to help you interpret models outside of BigQuery, such as with Vertex Explainable AI, which includes AutoML Tables, AutoML Vision, and custom-trained models.
So how does Explainable AI in BigQuery work exactly? And how might you use it in practice?
Two types of Explainable AI: global and local explainability
When it comes to Explainable AI, the first thing to note is that there are two main types of explainability as they relate to the features used to train the ML model: global explainability and local explainability.
Imagine that you have a ML model that predicts housing price (as a dollar amount), based on three features: (1) number of bedrooms, (2) distance to the nearest city center, and (3) construction date.
Global explainability (a.k.a. global feature importance) describes the features’ overall influence on the model and helps you understand if a feature had a greater influence than other features over the model’s predictions. For example, global explainability can reveal that the number of bedrooms and distance to city center typically has a much stronger influence than the construction date on predicting housing prices. Global explainability is especially useful if you have hundreds or thousands of features and you want to determine which features are the most important contributors to your model. You may also consider using global explainability as a way to identify and prune less important features to improve the generalizability of their models.
Local explainability (a.k.a. feature attributions) describes the breakdown of how each feature contributes towards a specific prediction. For example, if the model predicts that house ID#1001 has a predicted price of $230,000, local explainability would describe a baseline amount (e.g. $50,000) and how each of the features contributes on top of the baseline towards the predicted price. For example, the model may say that on top of the baseline of $50,000, having 3 bedrooms contributed an additional $50,000, close proximity to the city center added $100,000, and construction date of 2010 added $30,000, for a total predicted price of $230,000. In essence, understanding the exact contribution of each feature used by the model to make each prediction is the main purpose of local explainability.
What ML models does BigQuery Explainable AI apply to?
BigQuery Explainable AI applies to a variety of models, including supervised learning models for IID data and time series models. The documentation for BigQuery Explainable AI provides an overview of the different ways of applying explainability per model. Note that each explainability method has its own way of calculation (e.g. Shapley values), which are covered more in-depth in the documentation.

Examples with BigQuery Explainable AI
In this next section, we will show three examples of how to use BigQuery Explainable AI in different ML applications:
Regression models with BigQuery Explainable AI
Let’s use a boosted tree regression model to predict how much a taxi cab driver will receive in tips for a taxi ride, based on features such as number of passengers, payment type, total payment and trip distance. Then let’s use BigQuery Explainable AI to help us understand how the model made the predictions in terms of global explainability (which features were most important?) and local explainability (how did the model arrive at each prediction?).
The taxi trips dataset comes from the BigQuery public datasets and is publicly available in the table: bigquery-public-data.new_york_taxi_trips.tlc_yellow_trips_2018.
First, you can train a boosted tree regression model.
CREATE OR REPLACE MODEL bqml_tutorial.taxi_tip_regression_modelOPTIONS (model_type='boosted_tree_regressor',input_label_cols=['tip_amount'],max_iterations = 50,tree_method = 'HIST',subsample = 0.85,enable_global_explain = TRUE) ASSELECTvendor_id,passenger_count,trip_distance,rate_code,payment_type,total_amount,tip_amountFROM`bigquery-public-data.new_york_taxi_trips.tlc_yellow_trips_2018`WHERE tip_amount >= 0LIMIT 1000000
Now let’s do a prediction using ML.PREDICT, which is the standard way in BigQuery ML to make predictions without explainability.
SELECT *FROMML.PREDICT(MODEL bqml_tutorial.taxi_tip_regression_model,(SELECT"0" AS vendor_id,1 AS passenger_count,CAST(5.85 AS NUMERIC) AS trip_distance,"0" AS rate_code,"0" AS payment_type,CAST(55.56 AS NUMERIC) AS total_amount))

But you might wonder—how did the model generate this prediction of ~11.077?
BigQuery Explainable AI can help us answer this question. Instead of using ML.PREDICT, you use ML.EXPLAIN_PREDICT with an additional optional parameter top_k_features. ML.EXPLAIN_PREDICT extends the capabilities of ML.PREDICT by outputting several additional columns that explain how each feature contributes to the predicted value. In fact, since ML.EXPLAIN_PREDICT includes all the output from ML.PREDICT anyway, you may want to consider using ML.EXPLAIN_PREDICT every time instead.
SELECT *FROMML.EXPLAIN_PREDICT(MODEL bqml_tutorial.taxi_tip_regression_model,(SELECT"0" AS vendor_id,1 AS passenger_count,CAST(5.85 AS NUMERIC) AS trip_distance,"0" AS rate_code,"0" AS payment_type,CAST(55.56 AS NUMERIC) AS total_amount),STRUCT(6 AS top_k_features))

The way to interpret these columns is:
Σfeature_attributions + baseline_prediction_value = prediction_value
Let’s break this down. The prediction_value is ~11.077, which is simply the predicted_tip_amount. The baseline_prediction_value is ~6.184, which is the tip amount for an average instance. top_feature_attributions indicates how much each of the features contributes towards the prediction value. For example, total_amount contributes ~2.540 to the predicted_tip_amount.
ML.EXPLAIN_PREDICT provides local feature explainability for regression models. For global feature importance, see the documentation for ML.GLOBAL_EXPLAIN.
Classification models with BigQuery Explainable AI
Let’s use a logistic regression model to show you an example of BigQuery Explainable AI with classification models. We can use the same public dataset as before: bigquery-public-data.new_york_taxi_trips.tlc_yellow_trips_2018.
Train a logistic regression model to predict the bracket of the percentage of the tip amount out of the taxi bill.
CREATE OR REPLACE MODEL bqml_tutorial.taxi_tip_classification_modelOPTIONS(model_type='logistic_reg',input_label_cols=['tip_bucket'],enable_global_explain=true) ASSELECTvendor_id,passenger_count,trip_distance,rate_code,payment_type,total_amount,CASEWHEN tip_amount > total_amount*0.20 THEN '20% or more'WHEN tip_amount > total_amount*0.15 THEN '15% to 20%'WHEN tip_amount > total_amount*0.10 THEN '10% to 15%'ELSE '10% or less'END AS tip_bucketFROM`bigquery-public-data.new_york_taxi_trips.tlc_yellow_trips_2018`WHERE tip_amount >= 0LIMIT 1000000
Next, you can run ML.EXPLAIN_PREDICT to get both the classification results and the additional information for local feature explainability. For global explainability, you can use ML.GLOBAL_EXPLAIN. Again, since ML.EXPLAIN_PREDICT includes all the output from ML.PREDICT anyway, you may want to consider using ML.EXPLAIN_PREDICT every time instead.
SELECT *FROMML.EXPLAIN_PREDICT(MODEL bqml_tutorial.taxi_tip_classification_model,(SELECT"0" AS vendor_id,1 AS passenger_count,CAST(5.85 AS NUMERIC) AS trip_distance,"0" AS rate_code,"0" AS payment_type,CAST(55.56 AS NUMERIC) AS total_amount),STRUCT(6 AS top_k_features))

Similar to the regression example earlier, the formula is used to derive the prediction_value:
Σfeature_attributions + baseline_prediction_value = prediction_value
As you can see in the screenshot above, the baseline_prediction_value is ~0.296. total_amount is the most important feature in making this specific prediction, contributing ~0.067 to the prediction_value, though followed by trip_distance. The feature passenger_count contributes negatively to prediction_value by -0.0015. The features vendor_id, rate_code, and payment_type did not seem to contribute much to the prediction_value.
You may wonder why the prediction_value of ~0.389 doesn’t equal the probability value of ~0.359. The reason is that unlike for regression models, for classification models, prediction_value is not a probability score. Instead, prediction_value is the logit value (i.e., log-odds) for the predicted class, which you could separately convert to probabilities by applying the softmax transformation to the logit values. For example, a three-class classification has a log-odds output of [2.446, -2.021, -2.190]. After applying the softmax transformation, the probability of these class predictions is [0.9905, 0.0056, 0.0038].
Time-series forecasting models with BigQuery Explainable AI

Explainable AI for forecasting provides more interpretability into how the forecasting model came to its predictions. Let’s go through an example of forecasting the number of bike trips in NYC using the new_york.citibike_trips public data in BigQuery.
You can train a time-series model ARIMA_PLUS:
CREATE OR REPLACE MODEL bqml_tutorial.nyc_citibike_arima_modelOPTIONS(model_type = 'ARIMA_PLUS',time_series_timestamp_col = 'date',time_series_data_col = 'num_trips',holiday_region = 'US') ASSELECTEXTRACT(DATE from starttime) AS date,COUNT(*) AS num_tripsFROM`bigquery-public-data.new_york.citibike_trips`GROUP BY dateNext, you can first try forecasting without explainability using ML.FORECAST:SELECT*FROMML.FORECAST(MODEL bqml_tutorial.nyc_citibike_arima_model,STRUCT(365 AS horizon, 0.9 AS confidence_level))
This function outputs the forecasted values and the prediction interval. Plotting it in addition to the input time series gives the following figure.

But how does the forecasting model arrive at its predictions? Explainability is especially important if the model ever generates unexpected results.
With ML.EXPLAIN_FORECAST, BigQuery Explainable AI provides extra transparency into the seasonality, trend, holiday effects, level (step) changes, and spikes and dips outlier removal. In fact, since ML.EXPLAIN_FORECAST includes all the output from ML.FORECAST anyway, you may want to consider using ML.EXPLAIN_FORECAST every time instead.
SELECT*FROMML.EXPLAIN_FORECAST(MODEL bqml_tutorial.nyc_citibike_arima_model,STRUCT(365 AS horizon, 0.9 AS confidence_level))

Compared to the previous figure which only shows the forecasting results, this figure shows much richer information to explain how the forecast is made.
First, it shows how the input time series is adjusted by removing the spikes and dips anomalies, and by compensating the level changes. That is:
time_series_adjusted_data = time_series_data - spikes_and_dips - step_changes
Second, it shows how the adjusted input time series is decomposed into different components such as both weekly and yearly seasonal components, holiday effect component and trend component. That is
time_series_adjusted_data = trend + seasonal_period_yearly + seasonal_period_weekly + holiday_effect + residual
Finally, it shows how these components are forecasted separately to compose the final forecasting results. That is:
time_series_data = trend + seasonal_period_yearly + seasonal_period_weekly + holiday_effect
For more information on these time series components, please see the documentation here.
Conclusion
With the GA of BigQuery Explainable AI, we hope you will now be able to interpret your machine learning models with ease.
Thanks to the BigQuery ML team, especially Lisa Yin, Jiashang Liu, Amir Hormati, Mingge Deng, Jerry Ye and Abhinav Khushraj. Also thanks to the Vertex Explainable AI team, especially David Pitman and Besim Avci.
HarbourBridge Schema Assistant Allows Quick, Bulk Migration to Cloud Spanner

5455
Of your peers have already read this article.
1:30 Minutes
The most insightful time you'll spend today!
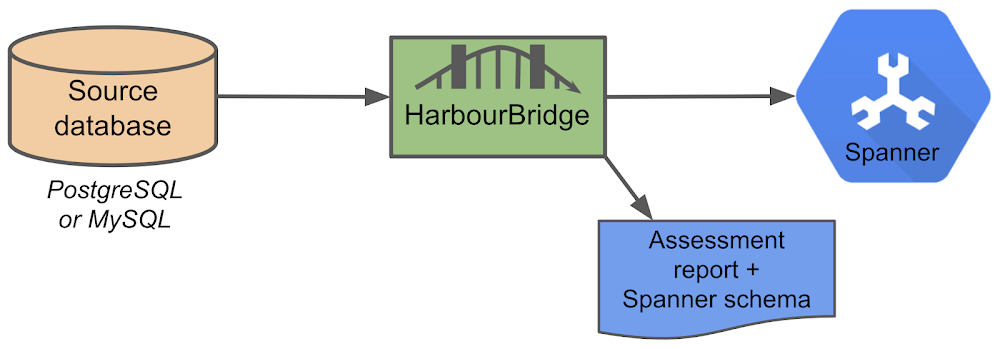
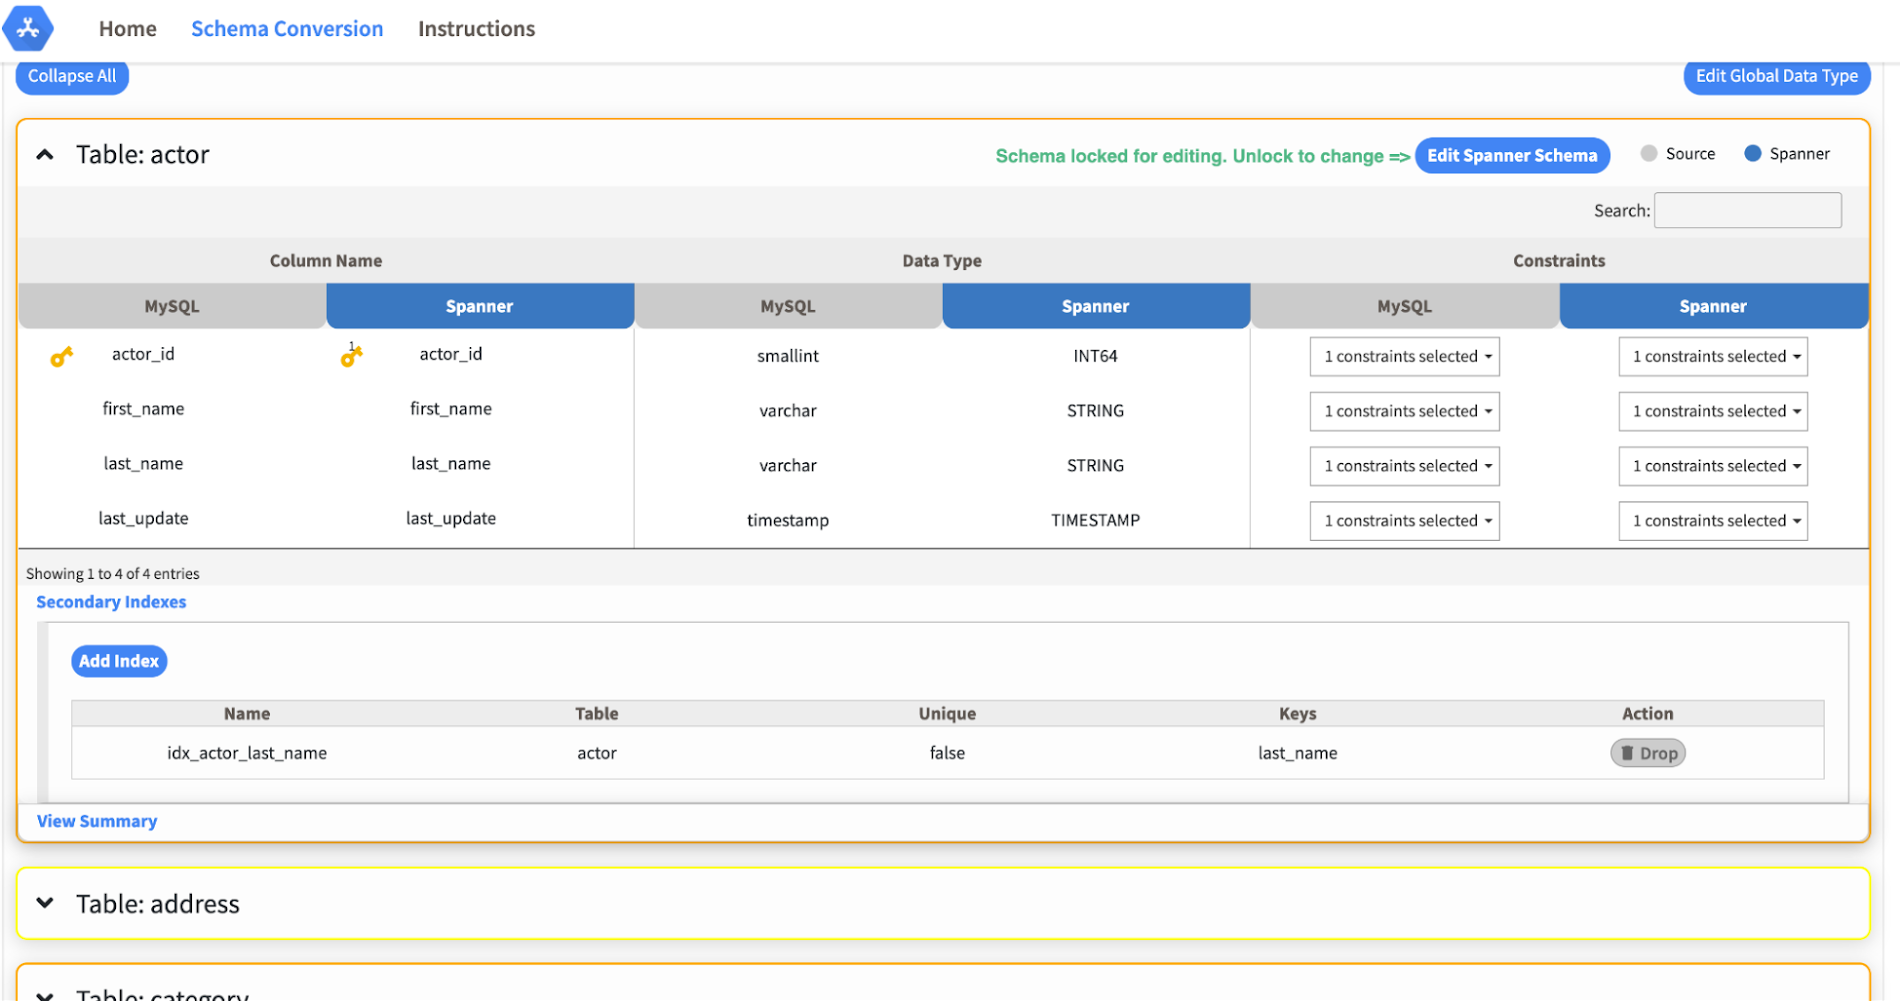
Today we’re announcing the HarbourBridge Schema Assistant, which provides a guided schema-design workflow for migrating from MySQL or PostgreSQL to Spanner. HarbourBridge imports dump files (from mysqldump or pg_dump) or directly connects to your source database, and converts the source database schema to an equivalent Spanner schema. The new Schema Assistant capability displays the source schema and Spanner schema side-by-side, highlights errors and walks you through a series of steps to validate and optimize your Spanner schema. It also produces a browsable assessment report with an overall migration-fitness score for Spanner, a table-by-table detailed analysis of type mappings and a list of features used in the source database that aren’t supported by Spanner. It supports editing of table and column names, column types, primary keys and constraints, as well as dropping of tables, columns, foreign keys and secondary indexes.
The new Schema Assistant complements HarbourBridge’s existing data and schema migration capabilities and is a critical step towards our goal of building a complete open-source migration toolkit. HarbourBridge continues to support command-line schema and data migration and turn-key Spanner evaluation.
Complementing the bulk data migration capabilities of HarbourBridge, we are also announcing the ability to migrate change events from MySQL to Cloud Spanner.
Supported Features in Schema Assistant
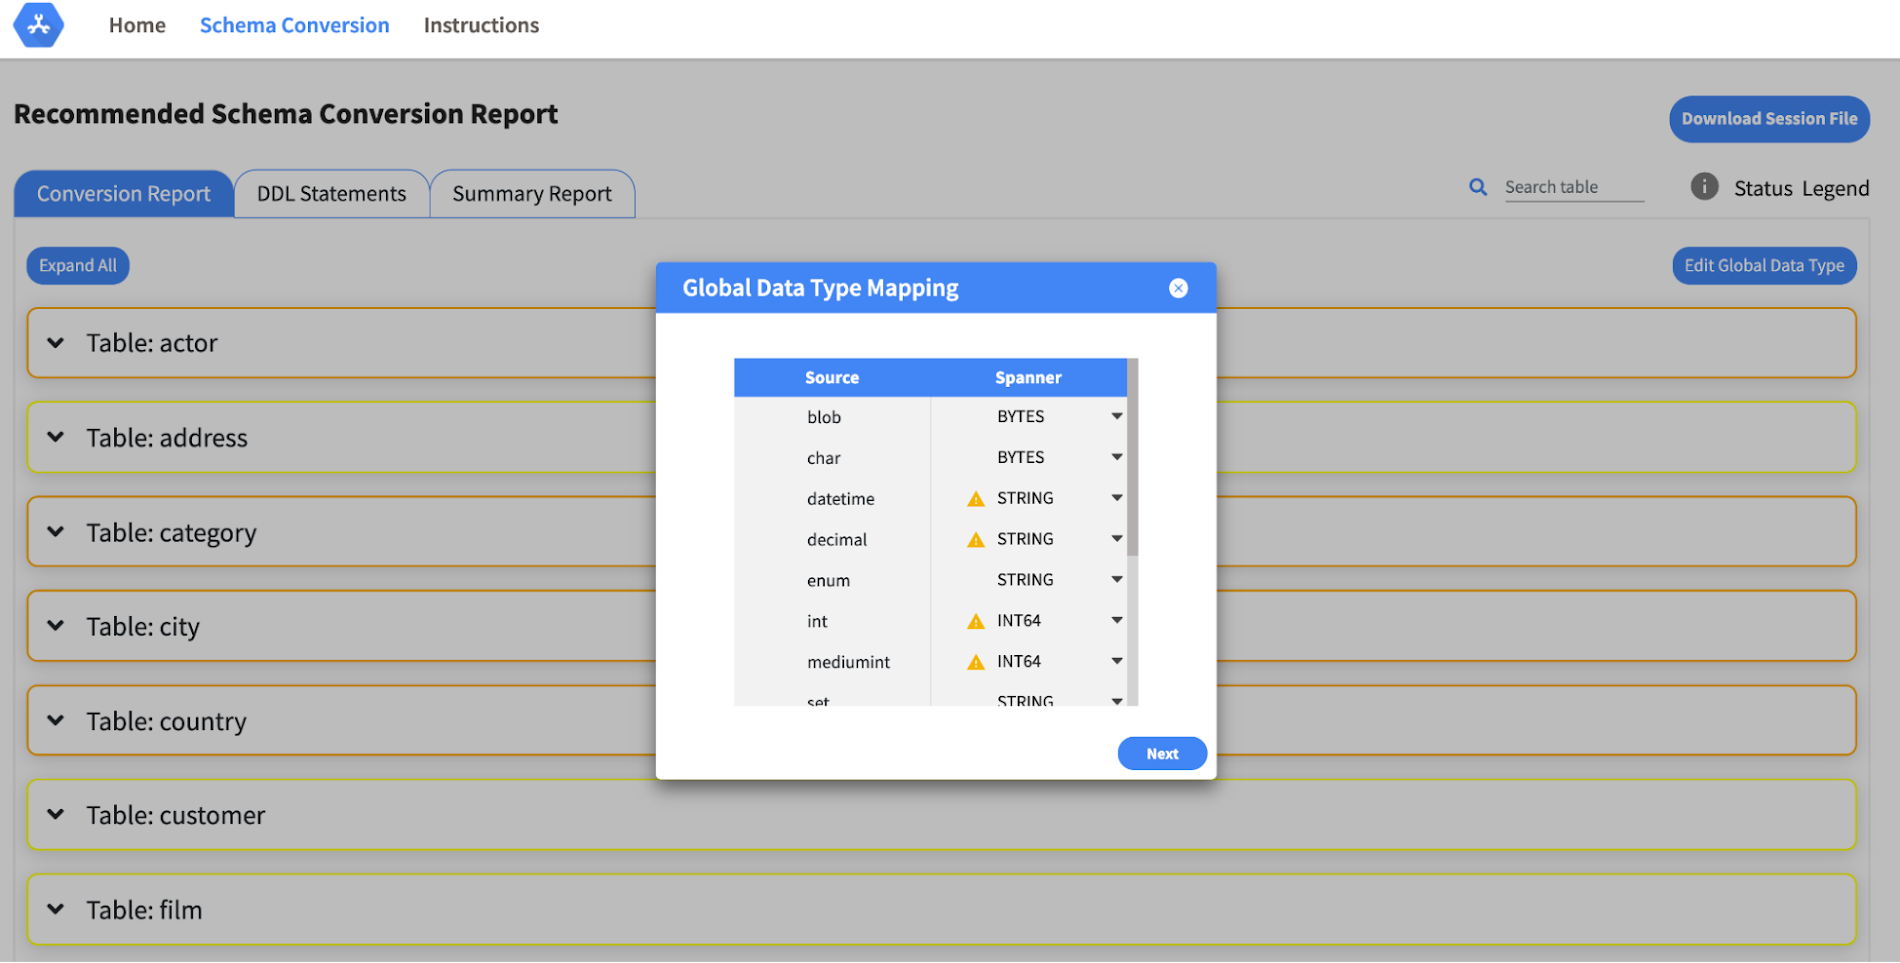
- Global type mapping. Users can customize the global mapping for how types should be mapped to Spanner consistently across the schema. For example, mapping large integers in source schema to Spanner’s NUMERIC.
- Local type mapping. Users can override the custom type mapping for a given table/column.
- Session management. A session keeps track of all the changes made to the schema mapping.
- Customization of secondary indexes. Users can add, edit and delete secondary indexes to optimize their Spanner performance.
- Customization of foreign keys and interleaved tables. Table interleaving is an important design consideration when migrating to Cloud Spanner as explained in more detail in this blog post.
Features in the pipeline
We are already working to further expand the supported set of schema editing features and welcome your feedback. We are particularly excited to expand the Schema Assistant’s design recommendations for optimizing Spanner schemas e.g. in-depth recommendations for primary key design.
HarbourBridge is open source and we gladly accept contributions from the wider community.
HSBC Overcomes Capacity Challenges and Innovation-Blocks With Google BigQuery

4003
Of your peers have already read this article.
3:45 Minutes
The most insightful time you'll spend today!
At HSBC, we serve 39 million customers, in-person and online, from consumers to businesses, in 66 countries. We maintain data centers in 21 countries, with more than 94,000 servers. With an on-premises infrastructure supporting our business, we kept running into capacity challenges, which really became an innovation blocker and ultimately a business constraint.
Our teams wanted to do more with data to create better products and services, but the technology tools we had weren’t letting us grow and explore. And that data was growing continually. Just one of our data warehouses had grown 300% from 2014 to 2018.
We had a huge amount of data, but what’s the point of having all that data if we couldn’t get insights and business value from it? We wanted to serve our customers flexibly, in the ways that work best for them.
We knew moving to cloud would let us store and process more data, but as a global bank, we were moving complex systems that needed to also be secure.
It was a team effort to create the project scope and strategy up front, and it paid off in the end. Our cloud migration now enables us to use an agile, DevOps mindset, so we can fail fast and deliver smaller workloads, with automation built in along the way.
This migration also helped us eliminate technical debt and build a data platform that lets us focus on innovation, not managing infrastructure. Along the way, we invented new technology and built processes that we can use as we continue migrating.
Planning for a cloud move
We chose cloud migration because we knew we needed cloud capabilities for our business to really reach its digital potential. We picked Google Cloud, specifically BigQuery, because it’s super fast over small and large datasets, and because we could use both a SQL interface and Connected Sheets to interact with it.
We had to move our data and its schema into the cloud—without having to manually manage every detail and miss the timelines we had set. Our data warehouse is huge, complex, and mission-critical, and didn’t easily lend itself to fit into existing reference architectures. We needed to plan ahead and automate to make sure the migration was efficient, and to ensure we could simplify data and processes along the way.
The first legacy data warehouse we migrated had been built over a period of 15 years, with 30 years worth of data comprising millions of transactions and 180 TB of data.
It ran 6,500 extract, transform, load (ETL) jobs and more than 2,500 reports, getting data from about 100 sources. Cloud migration choices usually involves either re-engineering or lift-and-shift, but we decided on a different strategy for ours: move and improve.
This allowed us to take full advantage of BigQuery’s capabilities, including its capacity and elasticity, to help solve our essential problem of capacity constraints.
Taking the first steps to cloud
We started creating our cloud strategy through a mapping exercise, which also helped start the change management process among internal teams. We chose architecture decision records as our migration approach, basing those on technical user journeys, which we mapped out using an agile board. User journeys included things like “change data capture,” “product event handling,” or “slowly changing dimensions.”
These are typical data warehouse topics that have to be addressed when going through a migration, and we had others more specific to the financial services industry, too.
For example, we needed to make sure the data warehouse would have a consistent, golden source of data at a specific point in time. We considered business impacts as well, so we prioritized initially moving archival and historical data to immediately take load off of the old system.
We also worked to establish metrics early on and introduce new concepts, like managing queries and quotas rather than managing hardware, so that data warehouse users would be prepared for the shift to cloud.
To simplify as we went, we examined what we currently had stored in our data warehouse to see what was used or unused. We worked with stakeholders to assess reports, and identified about 600-plus reports that weren’t being used that we could deprecate. We also examined how we could simplify our ETL jobs to remove the technical debt added by previous migrations, giving our production support teams a bit more sleep at night.
We used a three-step migration strategy for our data: first, migrating schema to BigQuery; second, migrating the reporting load to BigQuery, adding metadata tagging and performing the reconciliation process; and third, moving historical data by converting all the SQL script into data into BigQuery-compliant scripts.
Creating new tools for migration automation
In keeping with our automation mantra, we invented multiple accelerators to speed up migration. We developed these to meet the timelines we’d set, and to eliminate human error.
The schema parser and data reconciliation tool helped us migrate our data layer onto BigQuery. SQL parser helped migrate the data access layer onto Google Cloud Platform (GCP) without having to individually migrate 3,500 SQL instances that don’t have data lineage or documentation. This helped us to prioritize workloads.
And the data lineage tool identified components across layers to find dependencies. This was essential for finding and eliminating integration issues during the planning stage, and for identifying application owners during the migration. Finally, the data reconciliation tool reconciles any discrepancies between the data source and the cloud data target.
Building a cloud future
We used this first migration in our UK data center as a template, so we now have a tailored process and custom tools that we’re confident using going forward.
Our careful approach has paid off for our teams and our customers. We’re enjoying better development and testing procedures. We’ve created an onboarding path for applications, we have a single source of truth in our data warehouse, and we use authorized views for secure data access. The flexibility and scalable capacity of BigQuery means that users can explore data without constraints and our customers get the information they need, faster.
Dataflow Guarantees 50+% Increase in Developer Productivity and Infrastructure Cost Savings: Read More

8362
Of your peers have already read this article.
3:00 Minutes
The most insightful time you'll spend today!
In our conversations with technology leaders about data-driven transformation using Google Data Cloud – industry’s leading unified data and AI solution – , one important topic is incorporating continuous intelligence to move from answering questions such as “What has happened? to questions like “What is happening?” and “What might happen?”. The core to this evolution is the need for an underlying data processing that not only provides powerful real-time capabilities for events happening close to origination, but also brings together existing data sources under one unified data platform to enable organizations to draw insights and take actions holistically. Dataflow, Google’s cloud-native data processing and streaming analytics platform, is a key component of any modern data and AI architecture and data transformation journey, along with BigQuery, Google’s internet-scale warehouse with built-in streaming, BI engine and ML; Pub/Sub, a global no-ops event delivery service; and Looker, a modern BI and embedded analytics platform. One of the key evaluation factors is potential economic value of Dataflow to their organization, particularly in the context of engaging other stakeholders is key for many of the leaders that we engage with. So we commissioned Forrester Consulting to conduct a comprehensive study on the impact that Dataflow had on their organization by interviewing actual customers .
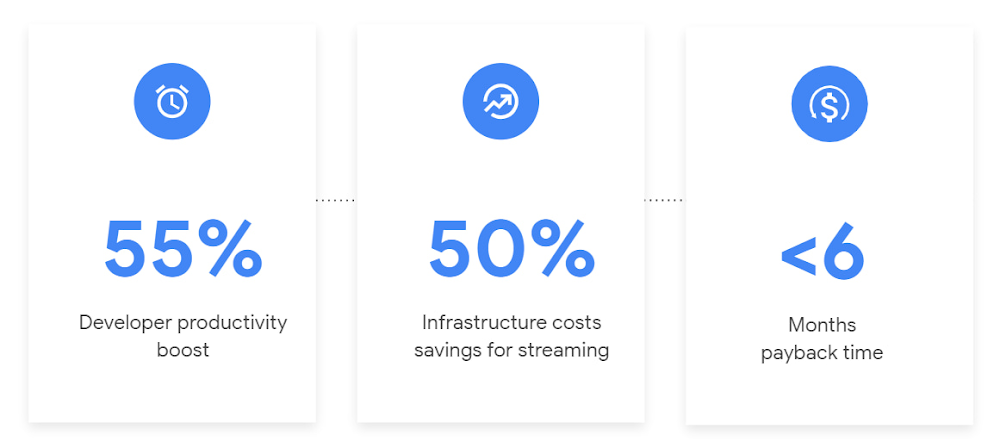
Today we’re excited to share our commissioned study conducted by Forrester Consulting, the Total Economic Impact™ of Google Cloud Dataflow, which allows data leaders to understand and quantify the benefits of Dataflow, and use cases it enables. Forrester conducted interviews with Dataflow customers to evaluate the benefits, costs, and risks of investing in Dataflow across an organization. Based on their interviews, Forrester identified major financial benefits across four different areas: business growth, infrastructure cost savings, data engineer productivity, and administration efficiency. In fact, Forrester found that customers adopting Dataflow can achieve a 55% boost in developer productivity and a 50% reduction in infrastructure costs. In fact, Forrester projects that customers adopting Dataflow can achieve a range of up to 171% Return on Investment (ROI) and a less than six months payback period. Customers can now use figures in the report to compute their own Return on Investment (ROI) and payback period.
“Dataflow is integral to accelerating time-to-market, decreasing time-to-production, reducing time to figure out how to use data for use cases, focusing time on value-add tasks, streamlining ingestion, and reducing total cost of ownership.” – Lead technical architect, CPG
Let’s take a deeper look at the ways that Forrester found that Dataflow can help you achieve your goals and unlock your business potential.
Benefit #1: Increase data engineer productivity by 55%
Developers can choose among a variety of programming languages to define and execute data workflows. Dataflow also seamlessly integrates with other Google Cloud Platform and open source technologies to maximize value and applicability to a wide variety of use cases. Dataflow streamlined workflows with code reusability,dynamic templates, and the simplicity of a managed service. Engineers trusted pipelines to run correctly and adhere to governance. Data engineers avoided laborious issue-monitoring and remediation tasks that were common in the legacy environments such as poor performance, lack of availability, and failed jobs. Teams valued the language flexibility and open source base.
“Dataflow provided us with ETL replacement that opened limitless potential use cases and enabled us to do smarter data enhancement while data remains in motion.” — Director of data projects, financial services
Benefit #2: Reduce infrastructure costs by up-to 50% for batch and streaming workloads
Dataflow’s serverless autoscaling and discrete control of job needs, scheduling, and regions eliminated overhead and optimized technology spending. Consolidating global data processing solutions to Dataflow further eliminated excess costs while ensuring performance, resilience, and governance across environments. Dataflow’s unified streaming and batch data platform gives organizations the flexibility to define either workload in the same programming model, run it on the same infrastructure, and manage it from a single operational management tool.
“Our costs with our cloud data platform using Dataflow are just a fraction of the costs we faced before. Now we only pay for cloud infrastructure consumption because the open source base helps us avoid licensing costs. We spend about $120,000 per year with Dataflow, but we’d be spending millions with our old technologies.” – Lead technical architect, CPG
Benefit #3: Increase top-line revenue by improving customer experience and retention with payback time of < 6 months
Streaming analytics is an essential capability in today’s digital world to gain real-time actionable insights. Likewise, organizations must also have flexible, high- performance batch environments to analyze historical data for building machine learning models, business intelligence, and advanced analytics. Dataflow enabled real-time streaming use cases, improved data enrichment, encouraged data exploration,improved performance and resiliency, reduced errors, increased trust, and eliminated barriers to scale. As a result, organizations provided customers with more accurate, relevant, and in-the-moment data-backed services and insights — boosting customer experience, creating new revenue streams, and improving acquisition, retention, and enrichment.
“It’s already been proven that we are getting more business [with Dataflow] because we can turn around results faster for customers.” – VP of technology, financial services technology
“When we provide data to our customers and partners with Dataflow, we are much more confident in those numbers and can provide accurate data within a minute. Our customers and partners have taken note and commented on this. It’s reduced complaints and prevented churn.” – Senior software engineer, media
Other benefits
Eliminated administrative overhead and toil
As a cloud-native managed service, all administration tasks such as provisioning, scaling, and updates are automatically handled by Google Cloud. Teams no longer need to manage servers and related software for legacy data processing solutions. Admins also streamlined processes for setting up data sources, adding pipelines, and enforcing governance.
Saved business operations costs for support teams and data end users
Dataflow improved the speed, quality, reliability, and ease of access to data for insights for general business users, saving time and empowering users to drive better data-backed outcomes. It also reduced support inquiry volume while automating manual job creation.
What’s next?
Download the Forrester Total Economic Impact study today to dive deep into the economic impact Dataflow can deliver your organization. We would love to partner with you to explore the potential Dataflow can unlock in your teams. Please reach out to our sales team to start a conversation about your data transformation with Google Cloud.
More Relevant Stories for Your Company

The future of data warehousing
While data has influenced major business decisions throughout the ages, the term “data warehouse” isn’t even half a century old. But it’s an important concept; by centralizing data from many disparate sources, analysts can make more informed decisions. Traditionally, this has meant collecting data in on-premises infrastructure. But as data

Migrating MySQL to Spanner? Here’s What You Need to Know
Since its initial release in 1995, MySQL has not only been the de-facto database for many data storage needs, but has gathered much attention over the years as one of the most well-recognized databases around when it comes to Relational Database Management Systems and transactional data processing. Any application in

How One Company Uses AI and Data Analysis to Boost Revenue
AI, deep learning, and image recognition is transforming the shopping experience. These technologies enable consumers to use product images or screenshots rather than text to search for similar products. This improves the customer experience and enables retailers with online and offline outlets to provide a genuine omnichannel experience. The lack of

Demystifying Transactional Locking in Cloud Spanner
Cloud Spanner is a fully managed relational database with unlimited scale, strong consistency, and up to 99.999% availability. It is designed for highly concurrent applications that read and update data, for example, to process payments or for online game play. To ensure the consistency across multiple concurrent transactions, Cloud Spanner
