





4851
Of your peers have already watched this video.
38:32 Minutes
The most insightful time you'll spend today!
Everything You Need to Know About Google Cloud ML Engine 101
Machine learning is all around us today. But data scientists and IT teams tasked with creating models have a hard time bringing together the right mix of ingredients—from data, infrastructure, tools, and APIs—to do their jobs effectively.
Google’s Cloud ML Engine eases many of the challenges data scientists and IT teams face. It’s a managed service that allows businesses to build and deploy their own models using any type or any size of data.
With Google’s Cloud ML Engine, data scientists can create models for training and prediction. And it provides APIs for these two building blocks.
Nikhil Kothari, Senior Staff Software Engineer, Google Cloud, breaks down Google’s Cloud ML Engine. He shows you how to use it as a service, so that data scientists can focus on data and on building models instead of managing infrastructure.
Quantum Metric Increases Business 10-fold

9265
Of your peers have already read this article.
5:30 Minutes
The most insightful time you'll spend today!
At Quantum Metric, we’re in the business of bringing our customers business insights that are based on customer experience data and analytics for mid-market and Fortune 500 companies.
Our software, powered by big data, machine intelligence, and Google Cloud, helps our customers identify, quantify, prioritize and measure opportunities to improve digital experiences.
As companies move to a more agile product lifecycle, including continuous deployment and continuous integration, they’re finding that it’s critical to receive perpetual quantified feedback and insights from their data in real time to understand where the largest opportunities exist.
Each year, billions of customer interactions are captured through browsers or mobile apps on PCs, tablets, and mobile devices. This data, fed into the Quantum Metric platform, can show if a customer had a password problem they couldn’t solve or struggled when trying to purchase something and abandoned their cart.
It also can show if the customer tried in vain to complete an online change to their service provider’s subscription, to reach tech support, or couldn’t find the size or color they were looking for while shopping online.
Most importantly, the Quantum Metric platform quantifies the business value of the issue, helping organizations prioritize where they can make the largest impact to their business.
Success overwhelms our initial architecture
Initially, the Quantum Metric experience analytics software ran on a MySQL open source relational database management system (RDBMS). The MySQL RDBMS worked great for simple queries, when there was a specific question to ask of the data.
Soon, though, we knew we needed to offer more advanced data science capabilities. Our bigger customers wanted to ask questions across very large data sets—days, weeks, months, and years worth of data. They wanted to pose iterative questions using complex filters to answer their most challenging business questions.
With more complex queries across more data, response times from our RDBMS went from 100 to 500 milliseconds to as long as 20 minutes.
That delay was slowing down our ability and time to insights, which also reduced the value we could provide to our customers, since iterative exploration and analysis requires real-time query responses. Because of the need for real-time responses, there were certain questions that we just weren’t able to ask of the data. It became clear that we needed a much more robust data warehouse solution.
There were also operational challenges with MySQL and massive-scale data ingestion. We spent a lot of time into the wee hours of the night and morning handling errors and recovering databases.
We tried to address these challenges by sharding, partitioning, and indexing the data to optimize for the types of questions customers were asking. But the problems were escalating and happening more often, from once a month across the customer base to monthly for at least 20 different customers.
We could tune the platform for today and tomorrow’s workload, with good guesses at where indexes could be used, but we simply couldn’t continue to horizontally scale MySQL in a cost-efficient and operationally efficient manner.
Speed breeds innovation
Once we started exploring options that could better scale with our business, we looked at NoSQL technologies like Cassandra (a partitioned row-store database), MySQL’s Column Store (a columnar store database), and Vertica (a columnar store database)—each with unique ways of handling data storage and accessibility.
But with high volumes of complex queries across large data stores, all of these solutions began to fail, bogged down with multiple, simultaneous users. We could have solved the problems with more raw compute and storage, but it would have been prohibitively expensive to run and require a large team to operate.
We then decided to try BigQuery, and it was transformative.
We connected our front end to BigQuery via APIs. Once data is 15 minutes old, it is automatically extracted, loaded, and transformed (ETL) to BigQuery.
We continuously update the legacy MySQL RDBMS so its data is integrated with BigQuery data when queries require real-time data. Most query response times are within 100-200 milliseconds, matching what we initially experienced with MySQL.
When traffic from our customers scales up, we can now scale on-demand to accommodate it, thanks to BigQuery’s hundreds of thousands of CPUs. Our customers no longer run into slow response times, and we’ve gained confidence that we can offer them—and their users—advanced insights and better experiences without delay.
More importantly, with this scale of query power, we were able to build data science algorithms into the platform, which iteratively query BigQuery based on the results, and help quantify the impact of a specific issue to a specific segment of users. Adding these capabilities was possible because of the massive scale of BigQuery.
In addition to new insights and fast response times, we wanted our customers to be able to ask complex questions using very simple language.
For example: “Show me high-loyalty customers, located in specific geographic areas, who visited the web site at least five times, based on specific campaigns, and never booked a seat on a flight.”
This was exactly the kind of query that was used by a major U.S. airline to understand the multi-million dollar impact of a failure affecting their most valuable customers: their high-loyalty members.
And this was all done while maintaining the highest standard of care of customer data and privacy by default, using multiple layers of encryption of data in transit, at rest, and a unique military-grade encryption approach. This approach encrypts PII, including even session cookies, with a RSA-2048 key available only to a select few and used for use cases such as fraud analysis.
It’s no exaggeration to say that BigQuery has totally transformed our business. It provides the petabyte scale and speed we were missing, in addition to taking care of operational maintenance, a task that was burying our team with MySQL.
We’re now able to support some of the largest companies in the world that require real-time, petabyte-scale analytics. That lets them serve more customers faster with higher quality, and take advantage of BigQuery’s power and scale to innovate.
There are other cloud solutions that can address petabyte analytics, but the most unique value proposition of BigQuery was its on-demand scaling and operational management, with extremely cost-effective pay-as-you-go billing. While today we are at a scale where we have round-the-clock querying needs, our early days had very sporadic query loads where we needed instant scale, then a long lull of nothing. The unique business model of BigQuery’s pay-by-bytes-scanned allowed us to have access to a massive-scale querying platform without breaking the bank.
Using BigQuery powers better customer experience and reduces purchasing friction
Among the many features of Quantum Metric is the ability to replay online customer sessions. In the example below from a mobile e-commerce site, each action is displayed chronologically. Why did this customer’s transaction fail?
Diving deeper, the session replay shows that the user tried to change the item quantity in the checkout cart, which resulted in a failed API call. Powered by BigQuery, Quantum Metric can then show how many other end users had this issue, with a simple click of “Show More Errors Like This.”
With BigQuery’s massive scale, Quantum Metric will then quantify the impact of that issue, so companies can prioritize which issues need attention immediately. If this is the issue that’s impacting the business the most, our customer can use a single click to open a Jira ticket, forwarding the discovery to their product and engineering teams. Those teams can then re-engineer the experience in near-real time, addressing the failed API call and cutting out the frustrating time it takes for engineers to reproduce the issue.
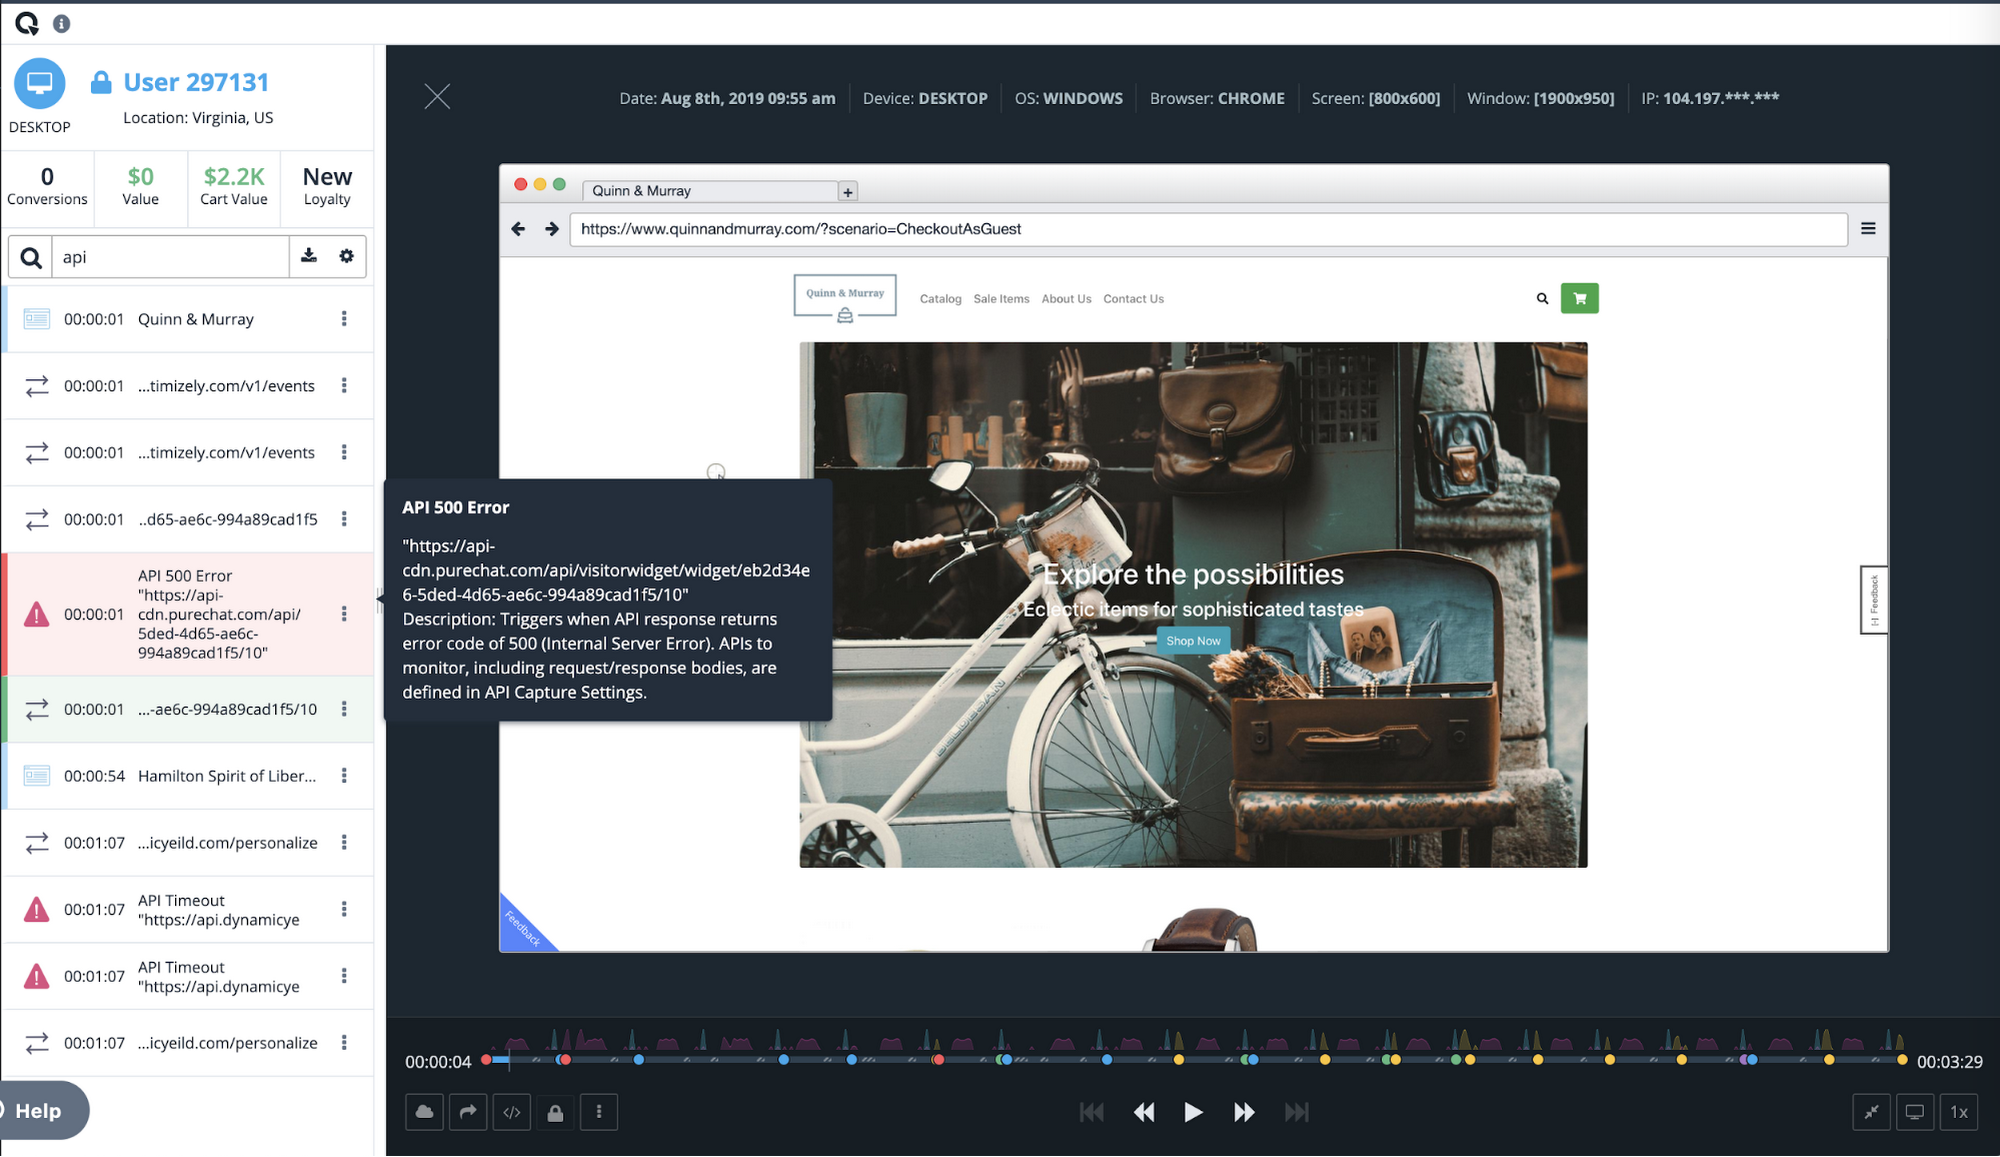
Once we had a powerful back end in BigQuery, we realized that Quantum Metric’s platform could be used to ask complex questions from vast datasets. We built some of the processes that data scientists use to formulate those queries right into our product.
For example, we added one series of processes to our platform to help customers understand whether a suspect issue is really impacting end-user experience. Is it something that should be prioritized and fixed? Does this really affect the user experience? Does it have financial impact? These and other questions can be pre-defined as a complex query in Quantum Metric to let our customer quickly gain insight on how an issue is impacting the business. Customers were blown away when they heard this was possible. It was the holy grail for what they were looking for in data science. It really sets us apart from our competition.
Today, with every company heavily dependent on data, those companies that can uncover and act on insights fastest are the ones that will succeed. BigQuery gives us the data warehouse platform we need to provide our customers with fast, reliable technology tools. It frees us from having to deal with the minutiae of technology infrastructure operations, so we can focus on finding and extracting the magic in customer data. With the power and scale of BigQuery, combined with the real-time capture of every user experience with 100% fidelity, we’re able to offer a self-service analytics platform that provides insights into digital journey friction points and acts as the indisputable arbitrator of truth.
What Drives Your Organization to be Data-driven?

4887
Of your peers have already read this article.
4:00 Minutes
The most insightful time you'll spend today!
Every organization has its own unique data culture and capabilities. Yet each is expected to use technology trends and solutions in the same way as everyone else. Your organization may be built on years of legacy applications, you may have developed a considerable amount of expertise and knowledge, yet you may be asked to adopt a new approach based on a technology trend. On the other hand, you may be on the other side of the spectrum, a digitally native organization built with engineering principles from scratch without legacy systems but expected to follow the same principles as process driven, established organizations. The question is, should we treat these organizations in the same way when it comes to data processing? In this series of blogs and papers this is what we are exploring: how to set up an organization from the first principles from data analyst, data engineering and data science point of view. In reality, there is no such organization that is solely driven by one of these but it is likely to be a combination of multiple types. What type of organization you become is then driven by how much you are influenced by each of these principles.
When you are considering what data processing technology encompasses, take a step back and make a strategic decision based on your key goals. This can be whether you optimize for performance, cost, reduction in operational overhead, increase in operational excellence, integration of new analytical and machine learning approaches. Or perhaps you’re looking to leverage existing employees’ skills while meeting all your data governance and regulatory requirements. We will be exploring these different themes and will focus on how they guide your decision-making process. You may be coming from technologies which are solving some of the past problems and some of the terminologies may be more familiar, however they don’t scale your capabilities. There is also the opportunity cost of prioritizing legacy and new issues that arise from a transformation effort, and as a result your new initiative can set you further behind on your core business while you play catch up to an ever changing technology landscape.
Data value chain
The key for any ingestion and transformation tool is to extract data from a source and start acting on it. The ultimate goal is to reduce the complexity and increase the timeliness of the data. Without data, it is impossible to create a data driven organization and act on the insights. As a result, data needs to be transformed, enriched, joined with other data sources, and aggregated to make better decisions. In other words, insights on good timely data mean good decisions.
While deciding on the data ingestion pipeline, one of the best approaches is to look into the volume of data, the velocity of the data, and type of data that is arriving. Other considerations include the number of different data sources you are managing, whether you need to scale to thousands of sources using generic pipelines, whether you want to create one generic pipeline but then apply data quality rules and governance. ETL tools are ideal for this use case as generic pipelines can be written and then parameterized.
On the other hand, consider the data source. Can the data be directly ingested without transforming and formatting the data? If the data does not need to be transformed and can be ingested directly into the data warehouse as a managed solution. This not only reduces the operational costs but also allows for more timely data delivery. If the data is coming in through an unstructured format such as XML or in a format such as EBCDIC and needs to be transformed and formatted, then a tool with ETL Capabilities can be used depending on the speed of the data arrival.
It is also important to understand the speed and time of arrival of the data. Think about your SLAs and time durations/windows that are relevant for your data ingestion plans. This would not only drive the ingestion profiles but would also dictate which framework to use. As discussed above, velocity requirements would drive the decision-making process.
Type of Organization
Different organizations can be successful by employing different strategies based on the talent that they have. Just like in sports, each team plays with a different strategy with the ultimate goal of winning.
Organizations often need to decide on what’s the best strategy to take in respect to data ingestion and processing – whether you need to hire an expensive group of data engineers, or exploit your data wizards and analysts to enrich and transform data that can be acted on, or whether it would be more realistic to train the current workforce to do more functional/high value work rather than to focus on building generally understood and available foundational pieces.
On the other hand, the transformation part of ETL pipelines as we know it, dictates where the load will be. All of these are made a reality in the cloud native world where data can be enriched, aggregated, and joined. Loading data into a powerful and modern data warehouse means that you can already join and enrich the data using ELT. Consequently, ETL isn’t really needed in its strict terms anymore if the data can be loaded directly into the data warehouse.
All of the above was not possible in the traditional, siloed, and static data warehouses and data ecosystems whereby systems would not talk to each other or there were capacity constraints in respect to both storing and processing the data in the expensive Data Warehouse. This is no longer the case in the BigQuery world as storage is now cheap and transformations are now much more capable without constraints of virtual appliances.
If your organization is already heavily invested into an ETL tool, one option is to use them to load BigQuery and transform the data initially within the ETL tool. Once the as-is and to-be are verified to be matching, then with the improved knowledge and expertise one can start moving workloads into BigQuery SQL, and effectively do ELT.
Furthermore, if your organization is coming from a more traditional data warehouse that extensively relies on stored procedures and scripting, then the question that one may ask is, do I continue leveraging these skills and expertise and use these capabilities that are also provided in BigQuery? ELT with BigQuery is more natural, similar to what’s already in Teradata BTEQ, Oracle PL/SQL but migrating from ETL to ELT requires changes. This change then enables exploiting streaming use cases, such as real-time use cases in retail. This is because there is no preceding step before data is loaded and made available.
Organizations can be broadly classified under 3 types as Data Analyst Driven, Data Engineering driven, and Blended organization. We will be covering a Data Science driven organization within the Blended category.
Data Analyst Driven
Analysts understand the business and are used to using SQL/spreadsheets. Allowing them to do advanced analytics through interfaces that they are accustomed to enables scaling. As a result, easy to use ETL tooling to bring data quickly into the target system becomes a key driver. Ingesting data directly from a source or staging area then also becomes critical as it allows analysts to exploit their key skills using ELT and increases timeliness of the data. This is commonplace with traditional EDWs and realized by extended capabilities of using Stored Procedures and Scripting. Data is enriched, transformed, and cleansed using SQL and ETL tools act as the orchestration tools.
The capabilities brought by cloud computing on separation of data and computation changes the face of the EDW as well. Rather than creating complex ingestion pipelines, the role of the ingestion becomes, bringing data close to the cloud, staging on a storage bucket or on a messaging system before being ingested into the cloud EDW. This then releases data analysts to focus on looking into data insights using tools and interfaces that they are accustomed to.
Data Engineering / Data Science Driven
Building complex data engineering pipelines is expensive but enables increased capabilities. This allows creating repeatable processes and scaling the number of sources. Once complemented with cloud it enables agile data processing methodologies. On the other hand, data science organizations allow carrying out experiments and producing applications that work for specific use cases but are not often productionised or generalized.
Real-time analytics enables immediate responses and there are specific use cases where low latency anomaly detection applications are required to run. In other words, business requirements would be such that it has to be acted upon as the data arrives on the fly. Processing this type of data or application requires transformation done outside of the target.
All the above usually requires custom applications or state-of-the-art tooling which is achieved by organizations that excel with their engineering capabilities. In reality, there are very few organizations that can be truly engineering organizations. Many fall into what we call here as the blended organization.
Blended org
The above classification can be used on tool selection for each project. For example, rather than choosing a single tool, choose the right tool for the right workload, because this would reduce operational cost, license cost and use the best of the tools available. Let the deciding factor be driven by business requirements: each business unit or team would know the applications they need to connect with to get valuable business insights. This coupled with the data maturity of the organization would be the key to making sure the right data processing tool would be the right fit.
In reality, you are likely to be somewhere on a spectrum. Digital native organizations are likely to be closer to being engineering driven, due to their culture and business that they are in. However, brick and mortar organizations would be closer to being analyst driven due to the significant number of legacy systems and processes they possess. These organizations are either considering or working toward digital transformation with an aspiration of having a data engineering / software engineering culture like Google.
The blended organization with strong skills around data engineering, would have built the platform and built frameworks, to increase reusable patterns would increase productivity and then reduce costs. Data engineers focus on running Spark on Kubernetes whereas infrastructure engineers focus on container work. This in turn provides unparalleled capabilities as application developers focus on the data pipelines and even the underlying technologies or platforms changes code stays the same. As a result, security issues, latency requirements, cost demands and portability are addressed at multiple layers.
Conclusion – What type of organization are you?
Often an organization’s infrastructure is not flexible enough to react to a fast changing technological landscape. Whether you are part of an organization which is engineering driven or analyst driven, organizations frequently look at technical requirements that inform which architecture to implement. But a key, and frequently overlooked, component needed to truly become a data-driven organization is the impact of the architecture on your data users. When you take into account the responsibilities, skill sets, and trust of your data users, you can create the right data platform to meet the needs of your IT department as well as your business.
To become a truly data-driven organization, the first step is to design and implement an analytics data platform that meets your technical and business needs. The reality is that each organization is different and has a different culture, different skills, and capabilities. Key is to leverage its strengths to stay competitive while adopting new technologies when it is needed and as it fits to your organization.
To learn more about the elements of how to build an analytics data platform depending on the organization you are, read our paper here.
Make Meaningful Analysis with Geo Boundary Public Datasets on BigQuery

6346
Of your peers have already read this article.
4:00 Minutes
The most insightful time you'll spend today!
Geospatial data is a critical component for a comprehensive analytics strategy. Whether you are trying to visualize data using geospatial parameters or do deeper analysis or modeling on customer distribution or proximity, most organizations have some type of geospatial data they would like to use – whether it be customer zipcodes, store locations, or shipping addresses. However, converting geographic data into the correct format for analysis and aggregation at different levels can be difficult. In this post, we’ll walk through some examples of how you can leverage the Google Cloud platform alongside Google Cloud Public Datasets to perform robust analytics on geographic data. The full queries can be accessed from this notebook here.
Public US Geo Boundaries dataset
BigQuery hosts a slew of public datasets for you to access and integrate into your analytics. Google pays for the storage of these datasets and provides public access to the data via the bigquery-public-data project. You only pay for queries against the data. Plus, the first 1 TB per month is free! These public datasets are valuable on their own, but when joined against your own data they can unlock new analytics use cases and save the team a lot of time.
Within the Google Cloud Public Datasets Program there are several geographic datasets. Here, we’ll work with the geo_us_boundaries dataset, which contains a set of tables that have the boundaries of different geospatial areas as polygons and coordinates based on the center point (GEOGRAPHY column type in BigQuery), published by the US Census Bureau.

Mapping geospatial points to hierarchical areas
Many times you will find yourself in situations where you have a string representing an address. However, most tools require lat/long coordinates to actually plot points. Using the Google Maps Geocoding API we can convert an address into a lat/long and then store the results in the BigQuery table.
With a lat/long representation of our point, we can join our initial dataset back onto any of the tables here using the ST_WITHIN function. This allows us to check and see if a point is within the specified polygon.
ST_WITHIN(geography_1, geography_2)
This can be helpful for ensuring standard nomenclature; for example, metropolitan areas that might be named differently. The query below maps each customers’ address to a given metropolitan area name.
SELECTcust.id as customer_id,metro.name as metro_nameFROM `looker-private-demo.retail.customers` as cust,`bigquery-public-data.geo_us_boundaries.metropolitan_divisions` as metroWHERE ST_WITHIN(ST_GEOGPOINT(cust.longitude, cust.latitude),metro.metdiv_geom)
It can also be useful for converting to designated market area (DMA), which is often used in creating targeted digital marketing campaigns.
SELECTcust.id as customer_id,dma.dma_nameFROM `looker-private-demo.retail.customers` as cust,`bigquery-public-data.geo_us_boundaries.designated_market_area` as dmaWHERE ST_WITHIN(ST_GEOGPOINT(cust.longitude, cust.latitude),dma.dma_geom)
Or for filling in missing information; for example, some addresses may be missing zip code which results in incorrect calculations when aggregating up to the zipcode level. By joining onto the zip_codes table we can ensure all coordinates are mapped appropriately and aggregate up from there.
SELECTzip.zip_code,count(distinct cust.id) as unique_customersFROM `looker-private-demo.retail.customers` as cust,`bigquery-public-data.geo_us_boundaries.zip_codes` as zipWHERE ST_WITHIN(ST_GEOGPOINT(cust.longitude, cust.latitude),zip.zip_code_geom)GROUP BY 1
Note that the zip code table isn’t a comprehensive list of all US zip codes, they are zip code tabulation areas (ZCTAs). Details about the differences can be found here. Additionally, the zip code table gives us hierarchical information, which allows us to perform more meaningful analytics. One example is leveraging hierarchical drilling in Looker. I can aggregate my total sales up to the country level, and then drill down to state, city and zipcode to identify where sales are highest. You can also use the BigQuery GeoViz tool to visualize geospatial data!

Aside from simply checking if a point is within an area, we can also use ST_DISTANCE to do something like find the closest city using the centerpoint for the metropolitan area table.
SELECTcust.id as customer_id,ARRAY_AGG(metro.name order by ST_DISTANCE(ST_GEOGPOINT(cust.longitude, cust.latitude),metro.internal_point_geom) asc limit 1)[offset(0)] as metro_nameFROM`looker-private-demo.retail.customers` as cust,`bigquery-public-data.geo_us_boundaries.metropolitan_divisions` as metroGROUP BY cust.id
This concept doesn’t just hold true for points, we can also leverage other GIS functions to see if a geospatial area is contained within areas that are listed in the boundaries datasets. If your data comes into BigQuery as a GeoJSON string, we can convert it to a GEOGRAPHY type using the ST_GEOGFROMGEOJSON function. Once our data is in a GEOGRAPHY type we can do things like check to see what urban area the geo is within – using either ST_WITHIN or ST_INTERSECTS to account for partial coverage. Here, I am using the customer’s zip code to find all metropolitan divisions where the zip code polygon and the metropolitan polygon intersect. I am then selecting the metropolitan area that has the most overlap (or the intersection has the largest area) to be the customer’s metro that we use for reporting.
SELECTcust.id as customer_id,ARRAY_AGG(metro.name order by ST_AREA(ST_INTERSECTION(zip.zip_code_geom,metro.metdiv_geom)) desc limit 1)[offset(0)] as metro_nameFROM`looker-private-demo.retail.customers` as custJOIN `bigquery-public-data.geo_us_boundaries.zip_codes` as zip on cust.zip=zip.zip_code,`bigquery-public-data.geo_us_boundaries.metropolitan_divisions` as metroWHERE ST_INTERSECTS(zip.zip_code_geom,metro.metdiv_geom)GROUP BY cust.id
The same ideas can be applied to the other tables in the dataset including the county, urban areas and National Weather Service forecast regions (which can also be useful if you want to join your datasets onto weather data).
Correcting for data discrepancy
One problem that we may run into when working with geospatial data is that different data sources may have different representations of the same information. For example, you might have one system that records state as a two letter abbreviation and another using the full name. Here, we can use the state table to join the different datasets.
SELECTst.state_name,sum(ab.sales+fn.sales) as total_salesFROM `bigquery-public-data.geo_us_boundaries.states` as stLEFT JOIN abbreviated_table as ab on ab.state = st.stateLEFT JOIN fullname_table as fn on fn.state = st.state_nameWHERE COALESCE(ab.state, fn.state) IS NOT NULLGROUP BY 1
Another example might be using the tables as a source of truth for fuzzy matching. If the address is a manually entered field somewhere in your application, there is a good chance that things will be misspelled. Different representations of the same name may prevent tables from joining with each other or lead to duplicate entries when performing aggregations. Here, I use a simple Soundex algorithm to generate a code for each county name, using helper functions from this blog post. We can see that even though some are misspelled they have the same Soundex code.

Next, we can join back onto our counties table so we make sure to use the correct spelling of the county name. Then, we can simply aggregate our data for more accurate reporting.
SELECTc.county_name,sum(sales) as total_salesFROMtableJOIN `bigquery-public-data.geo_us_boundaries.counties` as con testing.dq_fm_Soundex(table.county) = testing.dq_fm_Soundex(c.county_name)WHERE c.state_fips_code = cast(36 as string)GROUP BY 1
Note that fuzzy matching definitely isn’t perfect and you might need to try different methods or apply certain filters for it to work best depending on the specifics of your data.
The US Geo Boundary datasets allow you to perform meaningful geographic analysis without needing to worry about extracting, transforming or loading additional datasets into BigQuery. These datasets, along with all the other Google Cloud Public Datasets, will be available in the Analytics Hub. Please sign up for the Analytics Hub preview, which is scheduled to be available in the third quarter of 2021, by going to g.co/cloud/analytics-hub.
FAQs: Everything Your Need to Know About Cloud Computing

6613
Of your peers have already read this article.
1:30 Minutes
The most insightful time you'll spend today!
There are a number of terms and concepts in cloud computing, and not everyone is familiar with all of them. To help, we’ve put together a list of common questions, and the meanings of a few of those acronyms. You can find all these, and many more, in our learning resources.
What are containers?
Containers are packages of software that contain all of the necessary elements to run in any environment. In this way, containers virtualize the operating system and run anywhere, from a private data center to the public cloud or even on a developer’s personal laptop. Containerization allows development teams to move fast, deploy software efficiently, and operate at an unprecedented scale. Read more.
Containers vs. VMs: What’s the difference?
You might already be familiar with VMs: a guest operating system such as Linux or Windows runs on top of a host operating system with access to the underlying hardware. Containers are often compared to virtual machines (VMs). Like virtual machines, containers allow you to package your application together with libraries and other dependencies, providing isolated environments for running your software services. However, the similarities end here as containers offer a far more lightweight unit for developers and IT Ops teams to work with, carrying a myriad of benefits. Containers are much more lightweight than VMs, virtualize at the OS level while VMs virtualize at the hardware level, and share the OS kernel and use a fraction of the memory VMs require. Read more.
What is Kubernetes?
With the widespread adoption of containers among organizations, Kubernetes, the container-centric management software, has become the de facto standard to deploy and operate containerized applications. Google Cloud is the birthplace of Kubernetes—originally developed at Google and released as open source in 2014. Kubernetes builds on 15 years of running Google’s containerized workloads and the valuable contributions from the open source community. Inspired by Google’s internal cluster management system, Borg, Kubernetes makes everything associated with deploying and managing your application easier. Providing automated container orchestration, Kubernetes improves your reliability and reduces the time and resources attributed to daily operations. Read more.
What is microservices architecture?
Microservices architecture (often shortened to microservices) refers to an architectural style for developing applications. Microservices allow a large application to be separated into smaller independent parts, with each part having its own realm of responsibility. To serve a single user request, a microservices-based application can call on many internal microservices to compose its response. Containers are a well-suited microservices architecture example, since they let you focus on developing the services without worrying about the dependencies. Modern cloud-native applications are usually built as microservices using containers. Read more.
What is ETL?
ETL stands for extract, transform, and load and is a traditionally accepted way for organizations to combine data from multiple systems into a single database, data store, data warehouse, or data lake. ETL can be used to store legacy data, or—as is more typical today—aggregate data to analyze and drive business decisions. Organizations have been using ETL for decades. But what’s new is that both the sources of data, as well as the target databases, are now moving to the cloud. Additionally, we’re seeing the emergence of streaming ETL pipelines, which are now unified alongside batch pipelines—that is, pipelines handling continuous streams of data in real time versus data handled in aggregate batches. Some enterprises run continuous streaming processes with batch backfill or reprocessing pipelines woven into the mix. Read more.
What is a data lake?
A data lake is a centralized repository designed to store, process, and secure large amounts of structured, semistructured, and unstructured data. It can store data in its native format and process any variety of it, ignoring size limits. Read more.
What is a data warehouse?
Data-driven companies require robust solutions for managing and analyzing large quantities of data across their organizations. These systems must be scalable, reliable, and secure enough for regulated industries, as well as flexible enough to support a wide variety of data types and use cases. The requirements go way beyond the capabilities of any traditional database. That’s where the data warehouse comes in. A data warehouse is an enterprise system used for the analysis and reporting of structured and semi-structured data from multiple sources, such as point-of-sale transactions, marketing automation, customer relationship management, and more. A data warehouse is suited for ad hoc analysis as well custom reporting and can store both current and historical data in one place. It is designed to give a long-range view of data over time, making it a primary component of business intelligence. Read more.
What is streaming analytics?
Streaming analytics is the processing and analyzing of data records continuously rather than in batches. Generally, streaming analytics is useful for the types of data sources that send data in small sizes (often in kilobytes) in a continuous flow as the data is generated. Read more.
What is machine learning (ML)?
Today’s enterprises are bombarded with data. To drive better business decisions, they have to make sense of it. But the sheer volume coupled with complexity makes data difficult to analyze using traditional tools. Building, testing, iterating, and deploying analytical models for identifying patterns and insights in data eats up employees’ time. Then after being deployed, such models also have to be monitored and continually adjusted as the market situation or the data itself changes. Machine learning is the solution. Machine learning allows businesses to enable the data to teach the system how to solve the problem at hand with machine learning algorithms—and how to get better over time. Read more.
What is natural language processing (NLP)?
Natural language processing (NLP) uses machine learning to reveal the structure and meaning of text. With natural language processing applications, organizations can analyze text and extract information about people, places, and events to better understand social media sentiment and customer conversations. Read more.
Learn more
This is just a sampling of frequently asked questions about cloud computing. To learn more, visit our resources page at cloud.google.com/learn.
5367
Of your peers have already watched this video.
44:30 Minutes
The most insightful time you'll spend today!
How Go-Jek, Indonesia’s First Billion-dollar Startup, Improved the Productivity of Data Scientists
Go-Jek, Indonesia’s first billion-dollar startup, has seen an incredible amount of growth in both users and data over the past two years. Many of the ride-hailing company’s services are backed by machine learning models hosted on Google Cloud Platform.
Models range from driver
But senior executives at Go-Jek realized something: One of their most important and expensive resources, data scientists, were spending far too much time cleaning data. That wasn’t part of their remit and resulted in a waste of time and money.
As a COO, this a major concern for any company undertaking a machine learning initiative. Data scientists are hard to come by and their salaries have been on the rise for the last few years. Yet according to some reports data scientists spend upto 80% of their time just preparing data—not creating models.
Watch how operational teams at Go-Jek combined the right Google tools and processes to improve the productivity of their data scientists.
More Relevant Stories for Your Company


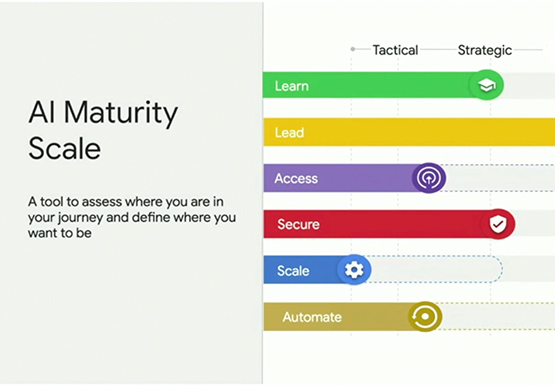

Google Cloud’s AI Adoption Framework: Helping You Build a Transformative AI Capability
AI can help organizations improve the decision-making process across most business functions. However, building an effective AI capability encompasses more than just creating a technology platform. To do this effectively requires alignment to business objectives, strong executive sponsorship, and collaboration between skilled employees and strategic partners. Additionally, you need your

Making Your Pictures Worth a Thousand Labels! (with Cloud Vision API)
In this post, I'll be showing some amazing ways the Vision API can extract meaning from your images - keep reading, or jump directly into a tutorial using Python, Node.js, Go, or Java! This tutorial can be completed at no cost within the Google Cloud Free Tier. They say a picture is worth a

Spark on Google Cloud: How this Helps Customers with Agility, Cost Reduction and Time Spent on Spark
Apache Spark has become a popular platform as it can serve all of data engineering, data exploration, and machine learning use cases. However, Spark still requires the on-premises way of managing clusters and tuning infrastructure for each job. Also, end to end use cases require Spark to be used along with
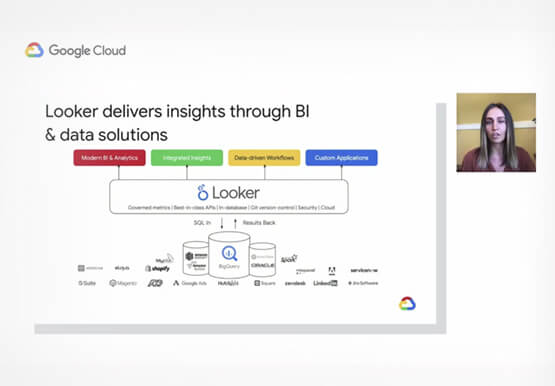
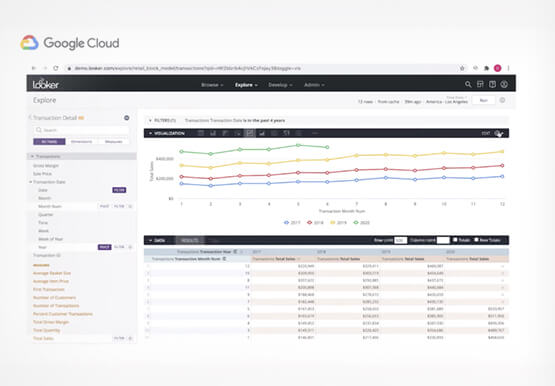
Technical deep dive on Looker: The enterprise BI solution for Google Cloud
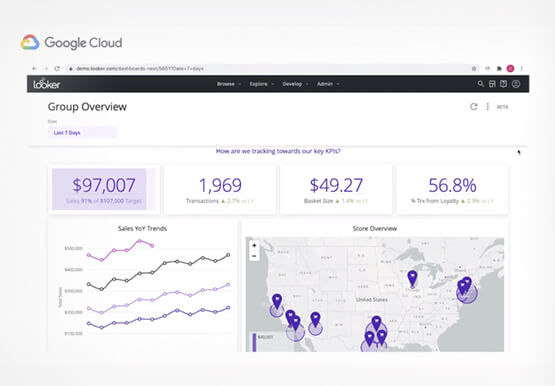
Thousands of users accessing petabytes of data on a daily basis: This is a challenging proposition for enterprises, without a doubt. But Looker makes it possible. Beyond just accessing data though, Looker’s platform transforms your company’s relationship with data. Go under the hood of Looker, with Olivia Morgan, Enterprise CE,
