





4917
Of your peers have already watched this video.
9:37 Minutes
The most insightful time you'll spend today!
L’Oréal: Managing Big-data Complexity with Google Cloud
L’Oreal is a global company with a presence in 150 countries worldwide. Between managing all of its brands and requirements for different countries, L’Oreal looks to data to make insightful business decisions. How does L’Oreal unify its data across all its systems and databases? How does L’Oreal make the data accessible to thousands of employees? In this video, Antoine Castex, Enterprise Architect at L’Oreal, discusses with Martin Omander how L’Oreal built a serverless, multi-cloud warehouse based on Google Cloud.
Chapters:
0:00 – Intro
0:23 – Why does L’Oreal need a new data warehouse?
0:51 – Who is the L’Oreal group?
1:35 – Which systems does L’Oreal use?
2:14 – How does L’Oreal manage complexity?
3:59 – What is ELT?
4:57 – Who are L’Oreal’s data consumers?
5:41 – How L’Oreal built the data warehouse
8:51 – L’Oreal’s future plans
9:10 – Wrap up
Google Cloud Workflows → https://goo.gle/3q20M1V
Cloud Run → https://goo.gle/3CSWbXG
Eventarc → https://goo.gle/3B7qhFy
BigQuery → https://goo.gle/3KHgyJ3
Looker → https://goo.gle/3Rx4Ind
Checkout more episodes of Serverless Expeditions → https://goo.gle/ServerlessExpeditions
Subscribe to Google Cloud Tech → https://goo.gle/GoogleCloudTech
2841
Of your peers have already watched this video.
30:00 Minutes
The most insightful time you'll spend today!
How Major League Baseball Migrated from Teradata to BigQuery
Ever wondered how to jumpstart a migration from your legacy on-premises or cloud data warehouse to BigQuery?
In this video Robert Goretsky, VP, Data Engineering, Major League Baseball and Ryan McDowell, Cloud Data Engineer, Google Cloud show you how.
They offer a deep-dive into MLB’s Teradata to BigQuery migration journey. In the course of the session they share the lessons they learnt, and business insights that they achieved as a result of modernizing MLB’s analytics strategy.
Find out how to run a migration assessment, migrate a subset of the data and schema with BigQuery DTS, and transform the SQL queries from Teradata into BigQuery dialect with CompilerWorks. Watch this video to get a deep understanding of your enterprise data warehouse migration journey.
The Query Execution Graph: Your Key to Better BigQuery Analytics

3092
Of your peers have already read this article.
2:30 Minutes
The most insightful time you'll spend today!
BigQuery offers strong query performance, but it is also a complex distributed system with many internal and external factors that can affect query speed. When your queries are running slower than expected or are slower than prior runs, understanding what happened can be a challenge.
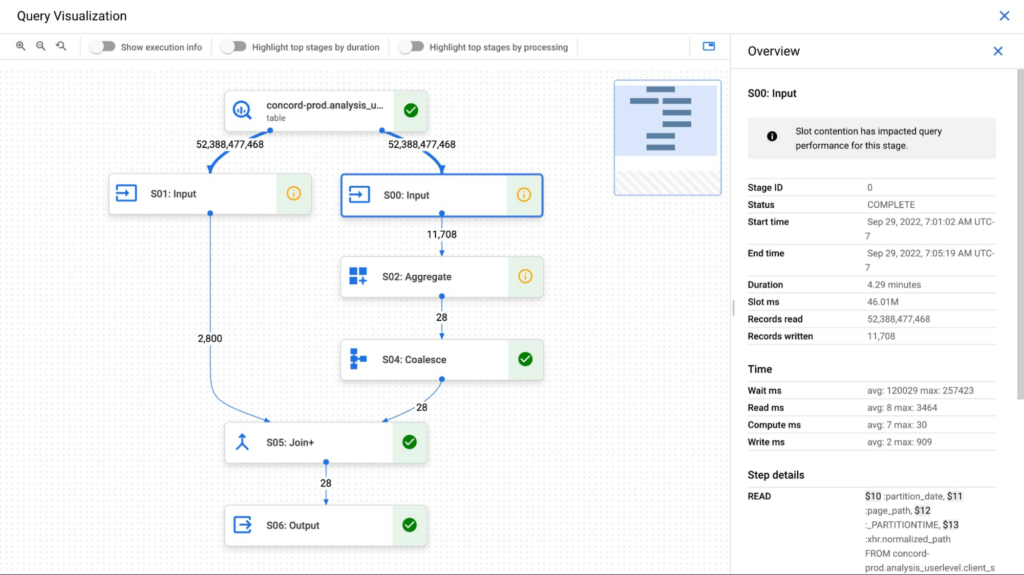
The query execution graph provides an intuitive interface for inspecting query execution details. By using it, you can review the query plan information in graphical format for any query, whether running or completed.
You can also use the query execution graph to get performance insights for queries. Performance insights provide best-effort suggestions to help you improve query performance. Since query performance is multi-faceted, performance insights might only provide a partial picture of the overall query performance.
Execution graph
When BigQuery executes a query job, it converts the declarative SQL statement into a graph of execution, broken up into a series of query stages, which themselves are composed of more granular sets of execution steps. The query execution graph provides a visual representation of the execution stages and shows the corresponding metrics. Not all stages are made equal. Some are more expensive and time consuming than others. The execution graph provides toggles for highlighting critical stages, which makes it easier to spot the potential performance bottlenecks in the query.
Query performance insights
In addition to the detailed execution graph BigQuery also provides specific insights on possible factors that might be slowing query performance.
Slot contention
When you run a query, BigQuery attempts to break up the work needed by your query into tasks. A task is a single slice of data that is input into and output from a stage. A single slot picks up a task and executes that slice of data for the stage. Ideally, BigQuery slots execute tasks in parallel to achieve high performance. Slot contention occurs when your query has many tasks ready for slots to start executing, but BigQuery can’t get enough available slots to execute them.
Insufficient shuffle quota
Before running your query, BigQuery breaks up your query’s logic into stages. BigQuery slots execute the tasks for each stage. When a slot completes the execution of a stage’s tasks, it stores the intermediate results in shuffle. Subsequent stages in your query read data from shuffle to continue your query’s execution. Insufficient shuffle quota occurs when you have more data that needs to get written to shuffle than you have shuffle capacity.
Data input scale change
Getting this performance insight indicates that your query is reading at least 50% more data for a given input table than the last time you ran the query and hence experiencing query slowness. You can use table change history to see if the size of any of the tables used in the query has recently increased.
What’s next?
We continue to work on improving the visualization of the graph. We are working on adding additional metrics to each step and adding more performance insights that will make query diagnosis significantly easier. We are just getting started.

5203
Of your peers have already downloaded this article
2:30 Minutes
The most insightful time you'll spend today!
For as long as business intelligence (BI) has been around, visualization tools have played an important role in helping analysts and decision-makers quickly get insights from data.
In our current era of big data analytics, that premise still holds. To provide an integrated platform for building BI dashboards on top of big data, GCP offers the combination of Google BigQuery, a cloud-native data warehouse that helps you analyze petabytes of data quickly, and Google Data Studio, a free tool that helps you quickly create beautiful reports.
First, imagine that you work for an online retailer that bases important decisions on customer interaction data in the form of large amounts (multiple TBs) of usage logs stored as date-partitioned tables in a BigQuery dataset called usage. To get business value out of that data as quickly as possible, you want to build a dashboard for analysts that will provide visualizations of trends and patterns in your data.
The good news is that a connector is available that lets you query data stored in BigQuery directly from Data Studio.
Learn how to build a BI dashboard with Data Studio as the front end, and powered by BigQuery on the back end (with some help from Google App Engine for added efficiency). Download this how-to now.
7478
Of your peers have already watched this video.
1:15 Minutes
The most insightful time you'll spend today!
An Indian Example of How to Really Up Your Customer Experience Game and Increase Conversion Rates With AI
How about selfie analysis of users to recommend them the right lipstick color?
That’s just one of the many ideas folks at Purplle.com came up with to improve the buying experience of Indian consumers.
And without the power of Google Cloud, it would probably have remained just that…an idea.
But today, thanks to Google Cloud, “Nothing seems impossible,” says Suyash Katyayani, CTO, Purplle.
Purplle.com is an online e-commerce company in India and one of the pioneers in creating a digitally-native beauty brands in India.
“The beauty industry is so data intensive that we needed to have a strong data strategy and we were looking out for solutions which would enable us to have a strong data pipeline and a strong data warehousing solution,” says Katyayani.
That’s when it turned to Google Cloud.
Additionally, Purplle.com, says Katyayani, does not have to worry about at what scale the company operates at because they have access to state-of-the-art infrastructure from Google Cloud available to them so that their developers can run experiments.
“The biggest plus point for us has been the agility that Google Cloud has added,” says Katyayani.
3020
Of your peers have already watched this video.
24:00 Minutes
The most insightful time you'll spend today!
New Capabilities in Google Cloud Dataprep: A Must-Read for Data Teams
In this video, Bertrand Cariou, Sr. Director Product Marketing, Trifacta and Sean Ma, Sr. Director, Product Management, Trifacta take a deep dive into new capabilities for Cloud Dataprep.
They walk us through several new features to enable a wider range of use cases with Cloud Dataprep; and, major enhancements to existing features asked for by enterprises.
Some of the new capabilities include:
- New connectivity with Google Sheets, Microsoft Excel, Oracle, SQL Server, DB2, and Salesforce
- New Data Pipeline Orchestration & Alerting
- Advanced Performance Optimization
- Fine Grain Data Access through OAuth
The walkthrough will also host a demonstration that exemplifies the new capabilities in the product itself.
Finally, Bertrand and Sean show an end-to-end data pipeline example that connects diverse data sources from multiple flows into a sequence that can be designed in Cloud Dataprep and integrated with Cloud Functions.
More Relevant Stories for Your Company



How to Build and Maintain Spark and Hadoop Clusters Quickly, Easily and Inexpensively
How often have you struggled to create Spark and Hadoop clusters only to have them become unstable? Building and maintaining clusters that are the building blocks of big data analytics should not be a time-consuming, repetitive, and expensive process. But with the current set of tools, it often is. Google
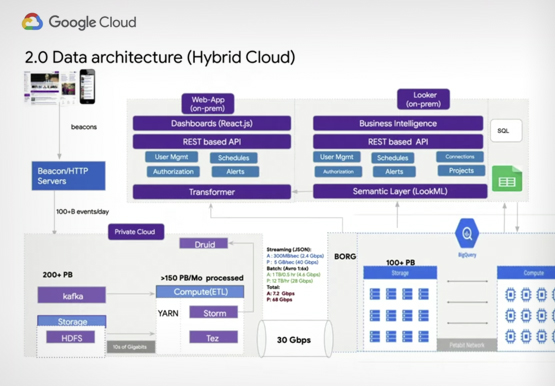
Verizon Media Shows the Solution Architecture it Uses for a 100+ PB Analytics Platform
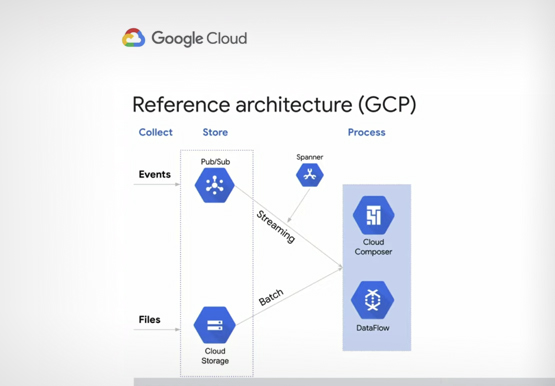
Verizon Media owns and operates more than a dozen brands including Yahoo Mail, Yahoo News, AOL, Huffington Post, TechCrunch, and Engadget among others. These web properties are visited by millions of users on a daily basis. In this session, Shakil Memon, Customer Engineer, Google Cloud and Nikhil Mishra, Sr Director,

Google Cloud Celebrates Journey of 3 Inspiring Founders for the Asian Pacific American Heritage Month
May is Asian Pacific American Heritage Month —a time for us to come together to celebrate and remember the important people and history of Asian and Pacific Island heritage. This feature highlights three AAPI founders from the Google For Startups community. Read on to learn how these three founders built



Video: How AI is Helping Biologists Protect Wildlife
According to the World Wildlife Fund, vertebrate populations have shrunk an average of 60 percent since the 1970s. And a recent UN global assessment found that we’re at risk of losing one million species to extinction, many of which may become extinct within the next decade. To better protect wildlife, seven organizations, led
