





Google Cloud Helps Northwell Health to Boost Caregiver Productivity and Access to Right Care Using AI

7961
Of your peers have already read this article.
2:00 Minutes
The most insightful time you'll spend today!
Lung cancer is the leading cause of cancer death in the United States and like any cancer, early detection is crucial to survival. Screening at-risk populations is an important part of reducing mortality, and if concerning nodules are found on imaging, further testing may be required. Today, we’ll share how Northwell Health uses Google Cloud products such as Cloud Healthcare APIs and BigQuery to increase caregiver productivity and deliver better care for patients with findings that indicate potential development of lung cancer.
Northwell is New York’s largest healthcare provider
Northwell Health is New York’s largest healthcare provider with 23 hospitals and nearly 800 outpatient facilities. Northwell’s nearly 4,000 doctors care for millions of patients each year, and at this scale, there is an immense amount of healthcare data to manage. To better manage and leverage this data, Northwell Health partnered with Google Cloud starting in 2018.
Enabling caregivers to spend more time with patients
Nic Lorenzen, the lead developer of Northwell Emerging Technology and Innovation team, has a mission to put together data for caregivers in a way that makes sense. It is no secret that inefficient electronic health records systems have a negative impact on a physician’s ability to deliver quality care. Traditional EHRs have information distributed across many tabs, which forces caregivers to spend considerable time at the computer trying to find information. Moreover, speed of care matters. If care is delayed, patients may have to spend more time in the hospital and may suffer worse health outcomes.
To solve this problem, Nic’s team focused on giving caregivers the most relevant pieces of data at the right time by developing an intelligent clinician rounding app. The data needed to derive these insights can depend on the caregiver’s role–a nurse cares about different things than a cardiologist. This system aggregates multiple data sources, and provides patient-specific insights to caregivers.
This system would not have been possible before with traditional EHRs and data warehouses that have proprietary data models and rarely sync data in real time. Now with data easily accessible through Google Cloud’s Healthcare solutions, Nic’s team can deliver the right clinical information to the right people instantly. These days, Nic says, “instead of spending 75% of our time dealing with architecting the underlying platforms, we spend 75% of our time focused on higher value use cases for clinicians and patients. Google Cloud’s Healthcare solutions have greatly improved our developer productivity and time to value.”
Caregivers have found this new system to be a game changer.Before the implementation of this system, caregivers would spend, on average, seven to nine minutes finding the data needed to make medical decisions for one patient. Now, that aggregated information is delivered to a caregiver’s mobile device in less than a second.
Ensuring patients get the right care with the power of AI
There are a number of reasons why patients might not get the care that they need. For example, patients today can go to multiple hospitals and clinics settings, and coordinating care across multiple facilities is complex. Regional hospitals and clinics have their own siloed view of their data, so pertinent information gathered by one clinic might not be seen by another. These gaps in clinical data lead to gaps in patient care.
When a patient gets radiologic imaging, they may have findings unrelated to the reason they initially got the imaging. For example, a chest CT for a car accident might reveal an incidental lung nodule that could be cancerous. Unfortunately, research shows that a large portion of patients do not get follow up for these incidental findings because it isn’t the primary reason why the patient is seeing a doctor. Moreover, social determinants of health are a factor that affects which patients receive follow-up care. Identifying these patients and providing the necessary follow up care prevents adverse events related to delayed detection of cancer.

With Cloud Healthcare solutions, Northwell built an AI model to identify these patients so that oncologists can appropriately follow up with patients who have findings suspicious for lung cancer. The AI model detects incidental pulmonary nodules in radiology reports so that doctors can then contact the patients that need follow-up care. Nic says his team was able to build this system in a week: “Google Cloud did a lot of heavy-lifting for us and allowed us to get to the AI applications much faster. It allowed us to build a platform that just works.”
Healthcare systems can now rapidly generate healthcare insights with one end-to-end solution, Google Cloud Healthcare Data Engine. It builds on and extends the core capabilities of the Google Cloud Healthcare API to make healthcare data more immediately useful by enabling an interoperable, longitudinal record of patient data. Northwell Health uses Google Cloud as the core of their platform, enabling their developers to create solutions to the most pressing healthcare problems.
Special thanks to Kalyan Pamarthy, Product Management Lead on Cloud Healthcare and Natural Language APIs for contributing to this blog post.
3273
Of your peers have already watched this video.
5:00 Minutes
The most insightful time you'll spend today!
What is Dataflow?
What is Dataflow, and how can you use it for your data processing needs?
In this episode of Google Cloud Drawing Board, Priyanka Vergadia walks you through Dataflow, a serverless system for processing and enriching data, supporting both streaming and batch models.
Here’s what’s inside:
0:00 – 0:14 Video snapshot
0:15 – 0:57 What is Dataflow
0:58 – 2:23 How does Dataflow work
2:24 – 3:34 How to use Dataflow
3:35 – 3:58 Dataflow security
3:58 – 4:24 What does it cost to use Dataflow
4:25 – 4:55 Dataflow use cases
STAC-M3 Tick History Analytics in Google Cloud Benchmark Results Reveals it is 18X Faster than Previous Version

4756
Of your peers have already read this article.
5:00 Minutes
The most insightful time you'll spend today!
The Securities Technology Analysis Center (STAC®), an organization that improves technology discovery and assessment in the finance industry through dialog and research, recently audited the STAC-M3™ benchmark suite on Google Cloud (SUT ID KDB211210). These enterprise tick-analytics benchmarks assess the ability of a solution stack such as database software, servers, and storage, to perform a variety of I/O-intensive and compute-intensive operations on historical market data.
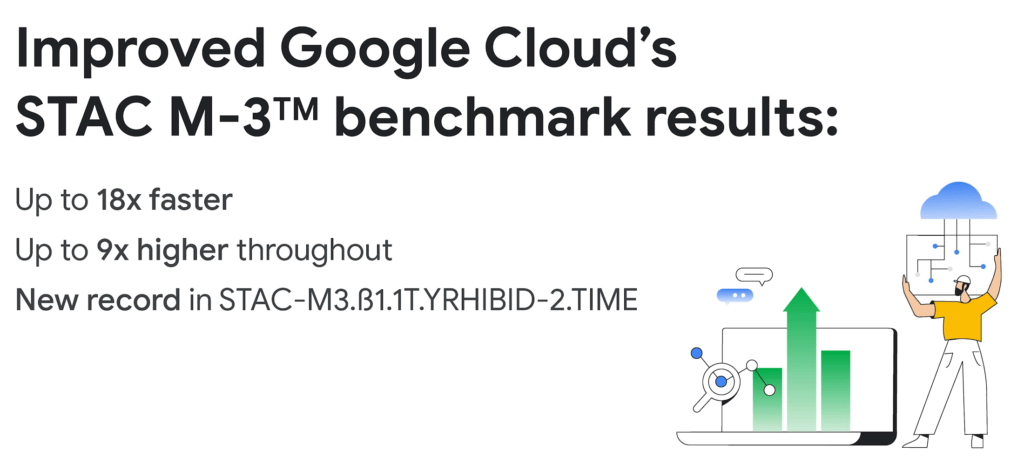
Following up on our previous STAC-M3 benchmark audit (SUT ID KDB181001), a redesigned Google Cloud architecture leveraged the most recent version of kdb+ 4.0, the time-series database from KX, and achieved significant improvements: 35 out of 41 benchmarks ran faster in the new cluster – by up to 18x faster than Google Cloud’s prior results. Key highlights include the following:
Compared to the previous STAC-M3 Antuco suite results on Google Cloud:
- Was faster in 13 of 17 mean response-time benchmarks
- Was 18x faster – a 94% reduction in run time – in the version of Year-High Bid that allows caching (STAC-M3.ß1.1T.YRHIBID-2.TIME), which also set an overall record for all published results
- Had 9x higher throughput in Year-High Bid (STAC-M3.ß1.1T.YRHIBID.MBPS)
Compared to the previous STAC-M3 Kanaga suite results on Google Cloud:
- Was faster in 22 of 24 mean response-time benchmarks
- Was over 10x faster in all four Market Snapshot workloads (STAC-M3.ß1.10T.YR[2,3,4,5]-MKTSNAP.TIME)
- Had 5x the throughput in Year-High Bid involving 2 years of data (STAC-M3.ß1.1T.2YRHIBID.MBPS)
“The STAC-M3 standard was designed by financial firms to reveal the performance of tick analytics stacks. Generational improvements like those exhibited by Google Cloud’s most recent STAC-M3 audit, are important data points for firms evaluating new architectures for performance and scale,” said Peter Nabicht, President of STAC.
These performance results may translate to real-world advantages that may be difficult for investment firms to achieve in static and costly on-premises environments: immediate answers in high data velocity markets, more thoroughly explored research theories by adding data or new quantitative approaches, and reduced costs by releasing cloud resources more quickly.
STAC-M3: High-speed tick analytics
Designing for record-breaking results
In our STAC-M3 audit, the stack under test (SUT) was designed to take advantage of horizontal scalability in the cloud by sharding data across independent compute nodes. The cluster of 12 Google Compute Engine N2 instances was powered by Intel Cascade Lake, with each node using 32 vCPUs, 160GiB of memory, and 9TiB of local NVMe SSDs. The full STAC-M3 Antuco and Kanaga data set was split across the cluster and kdb+ scripts distributed queries between nodes.
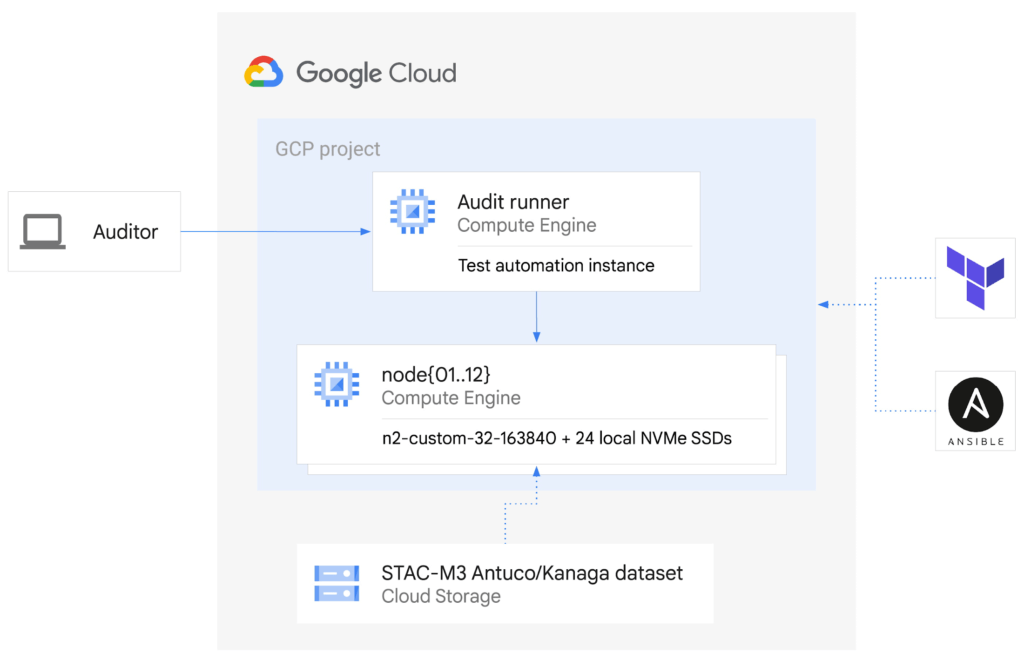
This configuration was the sweet spot for this particular workload, but this architecture does not need to be limited to 12 nodes for other workloads – the data sharding algorithm could scale to any number of nodes as required by workload demands. Since scaling out the cluster in this manner increases the total pool of available storage, this architecture can continue scaling out to petabytes of storage across hundreds of nodes.
The ability to spawn large clusters with hundreds of thousands of processors on demand at low cost, and to delete the resources when jobs complete, not only changes the economics of running computations on large financial data sets, it also opens up opportunities to explore solutions to new types of problems that were previously overlooked due to the constraints of fixed hardware on-premises. You can check the pricing of this VM configuration using the Google Cloud Pricing Calculator. The costs can be reduced even further by using preemptible VMs.
While the new cluster used a similar number of nodes, cores, and total memory as the previously-audited cluster, the redesigned architecture allowed us to harness the low latency and high throughput of Local NVMe SSDs.
Resources on demand
The cluster was created on demand using Terraform and Ansible during testing and auditing. The use of infrastructure as code (IaC) techniques ensured that the cluster, fully loaded with the STAC-M3 data set, could be created when needed and then removed when benchmarking was complete. It also meant that the cluster configuration was enforced by code on each deployment, eliminating configuration variance and drift. The full IaC definition to create the cluster can be retrieved from the report in the STAC Vault.
Each time the cluster was created, data was streamed to Local SSDs from Google Cloud Storage, our reliable and secure object storage, at up to the line rate of 32Gbps per node. The entire 57TiB STAC-M3 Antuco and Kanaga data was replicated from Cloud Storage to local storage in approximately 20 minutes.
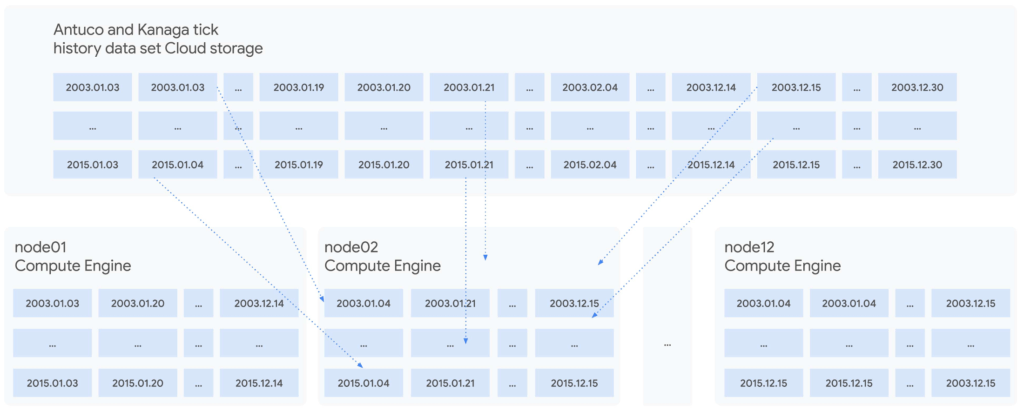
Since each node was independent and responsible for its own shard of data, doubling the cluster size would cut the synchronization time in half, or copy twice as much data in the same amount of time. Using higher bandwidth options of up to 100Gbps would triple the possible throughput for a relatively small incremental cost, trading an approximately 11%-23% price increase at current list prices for a 200% data synchronization performance increase. Taking advantage of fast networking to cache sharded data in parallel to a large cluster makes storing bulk data in Cloud Storage viable for even the largest workloads.
For quants working on vast data sets in sprawling compute clusters, the ability to fully describe infrastructure as declarative code, create elastic resources on demand, cache data quickly from cheap bulk storage, and turn resources off when computations complete is a dramatic change compared to waiting months to grow on-premises clusters – and a compelling reason to use cloud infrastructure.
To see how we designed and optimized the cluster for API-driven cloud resources, read our new whitepaper.
STAC-A2™: Calculating derivatives risk
In 2018, we showed that cloud instances can outperform bare metal when analyzing large tick history data sets in the demanding suite of STAC-M3 benchmarks. Last year, Google Cloud’s partner Appsbroker showed that the same was true for calculating derivatives risk in STAC-A2 on Google Cloud. You can read about how Appsbroker built its record-breaking STAC-A2 compute cluster on Google Cloud in its blog post, or access the STAC Report directly. Here are the highlights:
Compared to all other publicly reported solutions, this solution, based on a cluster of 10 virtual machines, had:
- The highest throughput (STAC-A2.β2.HPORTFOLIO.SPEED)
- The fastest cold time in the large problem size (STAC-A2.β2.GREEKS.10-100k-1260.TIME.COLD)
Compared to a solution involving an 8-node, on-premises cluster (SUT ID INTC181012), this 10-node, cloud-based solution:
- Had 5 times the maximum paths (STAC-A2.β2.GREEKS.MAX_PATHS)
- Had 10% greater throughput (STAC-A2.β2.HPORTFOLIO.SPEED)
- Was 18% faster in cold runs of the large problem size (STAC-A2.β2.GREEKS.10-100k-1260.TIME)
- Was 9% faster in cold runs of the baseline problem size (STAC-A2.β2.GREEKS.TIME.COLD)
Finding market advantages with Google Cloud
Across the investment management industry, every firm is seeking many of the same competitive advantages. However, finding unique opportunities and managing larger and larger data sets is becoming a major strain. Cloud is fundamentally changing how quants tackle the problem while empowering them to manage risk and generate higher returns.
Building on-premises computing clusters with tens or hundreds of thousands of cores and petabytes of storage requires huge up-front investments and lead time measured in months or years. Google Cloud makes the same scale available to its customers, provisioned on demand and paid per use. More importantly, the elasticity of cloud resources enables agility that is simply not available in a fixed data center cluster – the agility to explore, experiment, iterate, and respond to markets faster than before.
Scaling out to tens of thousands of cores in minutes and then removing the resources immediately not only changes the speed at which questions can be answered; it encourages different and more frequent questions, asked simultaneously on many independent clusters, free from the constraints of fixed on-premises hardware.
It is this flexibility and power that enables financial services firms to leverage larger data sets and get results, backtest, research, and analyze large amounts of data, faster and whenever they need it.
Download our whitepaper to learn more about our latest STAC-M3 tick history analytics benchmark results and how to optimize cloud infrastructure for high-speed market data analysis.
3131
Of your peers have already watched this video.
36:30 Minutes
The most insightful time you'll spend today!
Don’t sweat the big stuff. Make it Google’s problem
Need to interpolate new time series data values over 5 billion rows? Don’t reach for python. Make that Google’s problem and do it in BigQuery.
Need to aggregate petabytes of geospatial data across arbitrary polygons and put it on a map for analysis? Make that Google’s problem and use BQ-GIS.
Great – your map was awesome and now we need it every hour. Roll your own Airflow server? Nope. Make that Google’s problem. You see the pattern.
Geotab, which operates in in the telematics space, applies instrumenting to vehicles to learn how to optimize fleet maintenance, routes and costs, and even find way to optimize city infrastructure.
Geotab has been a long-time customer of Google Cloud products. They leverage the entire GCP suite to empower data scientists to efficiently ingest, process, and analyze petabytes of IoT data.
One of the keys to their pace of innovation and growth has been to focus on their key competencies and partner with others to fill in the gaps.
For Geotab’s data scientists this means focusing on the data and model-building and whenever possible making the processing, storage, and orchestration, well Google’s problem.
Making Streaming Analytics Simpler and More Cost-Effective With Cloud Dataflow

3885
Of your peers have already read this article.
8:30 Minutes
The most insightful time you'll spend today!
Streaming analytics helps businesses to understand their customers in real time and adjust their offerings and actions to better serve customer needs. It’s an important part of modern data analytics, and can open up possibilities for faster decisions.
For streaming analytics projects to be successful, the tools have to be easy to use, familiar, and cost-effective. Since its launch in 2015, Cloud Dataflow, Google’s fully managed streaming analytics service, has been known for its powerful API available in Java and Python. Businesses have almost unlimited customization capabilities for their streaming pipelines when they use these two languages, but these capabilities come at the cost of needing programming skills that are sometimes hard to find.
To advance Google Cloud’s streaming analytics further, Google Cloud is announcing new features available in the public preview for Cloud Dataflow SQL, as well as the general availability of Cloud Dataflow Flexible Resource Scheduling (FlexRS) for a very cost-effective way of batch processing of events. These new features make streaming analytics easier and more accessible to data engineers, particularly those with database experience.
Here’s more detail about each of these new features:
Cloud Dataflow SQL to create streaming (and batch) pipelines using SQL
We know that SQL is the standard for defining data transformations, and that you want more GUI-based tools for creating pipelines. With that in mind, several months ago we launched a public preview of Cloud Dataflow SQL, an easy way to use SQL queries to develop and run Cloud Dataflow jobs from the BigQuery web UI. Today, we are launching several new features in Cloud Dataflow SQL, including Cloud Storage file support and a visual schema editor.
Cloud Dataflow SQL allows you to join Cloud Pub/Sub streams with BigQuery tables and Cloud Storage files. It also provides several additional features:
- Using Streaming SQL extensions for defining time windows and calculating window-based statistics;
- Integration with Cloud Data Catalog for storing the schema of Cloud Pub/Sub topics and Cloud Storage file sets—a key enabler for using SQL with streaming messages;
- A simple-to-use graphical editor available in the BigQuery web UI. If you are familiar with BigQuery’s SQL editor, you can create Cloud Dataflow SQL jobs.
To switch the BigQuery web UI to Cloud Dataflow SQL editing mode, open the BigQuery web UI, go to More>Query settings and select “Cloud Dataflow” as the query engine.
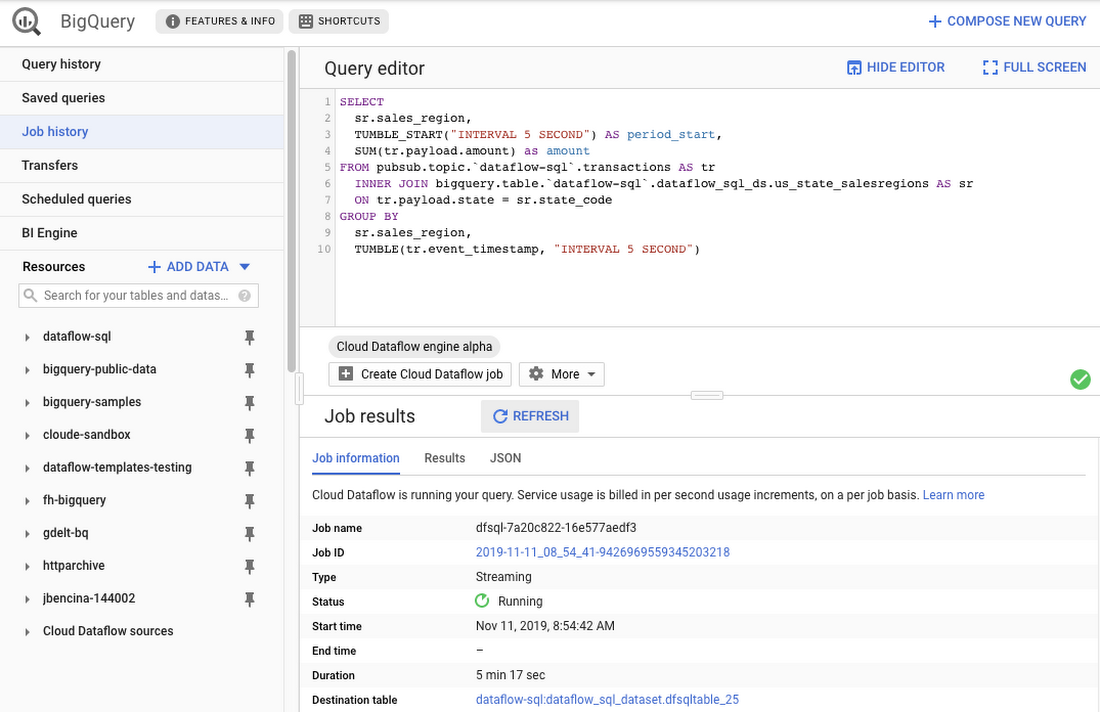
As an example, let’s say you have a Cloud Pub/Sub stream of sales transactions, and you want to build a real-time dashboard for the sales managers of your organization showing them the up-to-date stats of the sales in their regions. You can accomplish this in a few steps: write a SQL statement like the following one, launch a Cloud Dataflow SQL job, direct the output to a BigQuery table, then use one of the many supported dashboarding tools, including Google Sheets, Data Studio, and others, to visualize the results.
SELECTsr.sales_region,TUMBLE_START("INTERVAL 5 SECOND") AS period_start,SUM(tr.payload.amount) as amountFROM pubsub.topic.`dataflow-sql`.transactions AS trINNER JOIN bigquery.table.`dataflow-sql`.dataflow_sql_ds.us_state_salesregions AS srON tr.payload.state = sr.state_codeGROUP BYsr.sales_region,TUMBLE(tr.event_timestamp, "INTERVAL 5 SECOND")
In this example, we are joining the “transactions” Cloud Pub/Sub topic in the “dataflow-sql” project with a metadata table in BigQuery called “us_state_salesregions.” This table contains a mapping between the state codes (present in the “transactions” Cloud Pub/Sub topic) and the sales regions “Region_1”, “Region_2”, .., “Region_N” that are relevant to the sales managers in our example organization. In addition to the join, we’ll do a streaming aggregation of our data, using one of the several windowing functions supported by Cloud Dataflow. In our case, we will use TUMBLE windows, which will divide our stream into fixed five-second time intervals, group all the data in those time windows by the sales_region field, and calculate the sum of sales in the sales region. We also want to preserve the start of each time window, via TUMBLE_START("INTERVAL 5 SECOND"), to plot sales amounts as a time series.
To start a Cloud Dataflow job, click on “Create Cloud Dataflow job” in the BigQuery web UI.
When data starts flowing into the destination table, it will contain three fields: the sales_region, the timestamp of the period start, and the amount of sales.
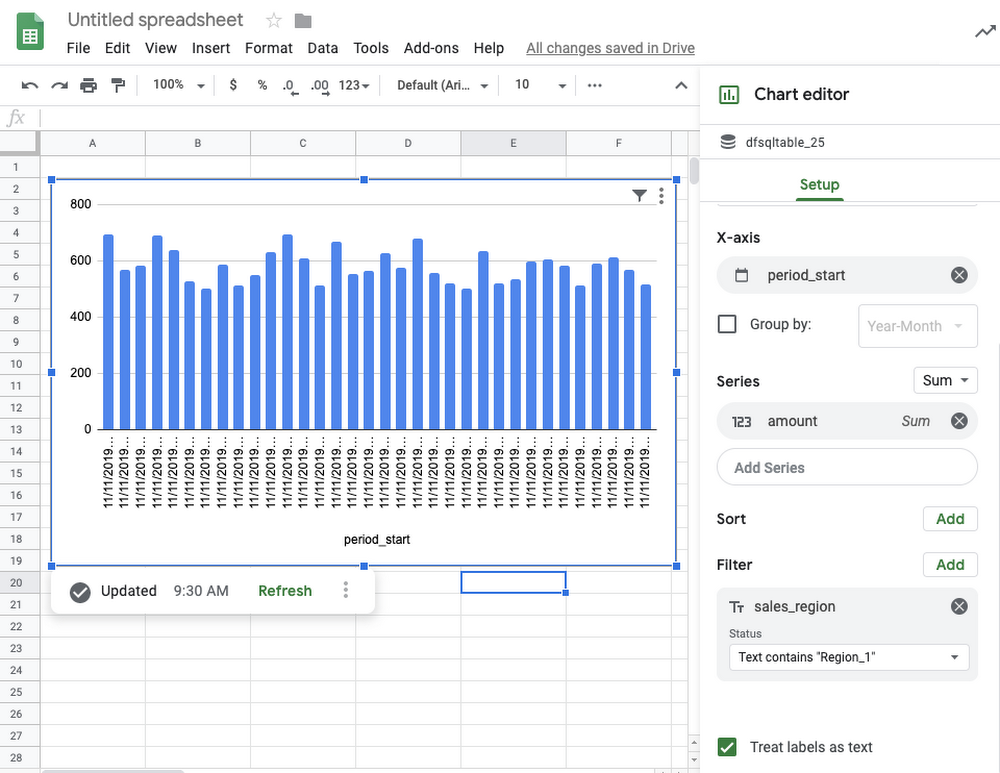
In the next step, we will create a BigQuery Connected Sheet that shows a column chart of sales in “Region_1” over time. Select the destination BigQuery table in the nav tree. In our case, it’s the dfsqltable_25 table.
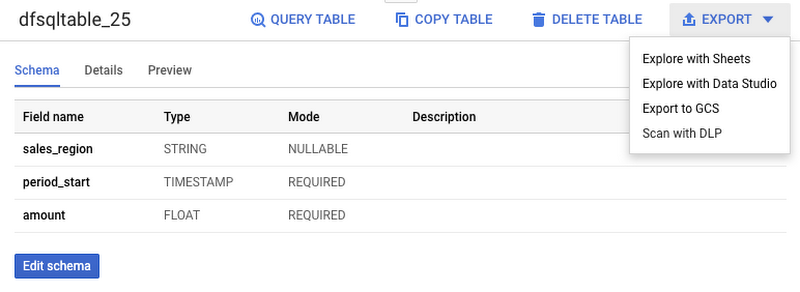
Then, select Export>Explore with Sheets to chart your data. Do it from the tab where your BigQuery table is shown, and not from the tab where your original Cloud Dataflow SQL was. In Sheets, create the column chart using the data connection to BigQuery, and choose period_start for the X-axis, amount as your data series, and add a sales_region filter. This is all you have to do to build a chart in Sheets that visualizes streaming data.
Mixing and joining data in Cloud Pub/Sub and BigQuery helps solve many real-time dashboarding cases, but quite a few customers have also asked for support of their Cloud Storage files to join those files with events in Cloud Pub/Sub or with tables in BigQuery. This is now possible in Dataflow SQL, enabled by our integration with Data Catalog’s Cloud Storage file sets.
In the following example, you’ll see an archive of transactions stored in CSV files in the “transactions_archive” Cloud Storage bucket.
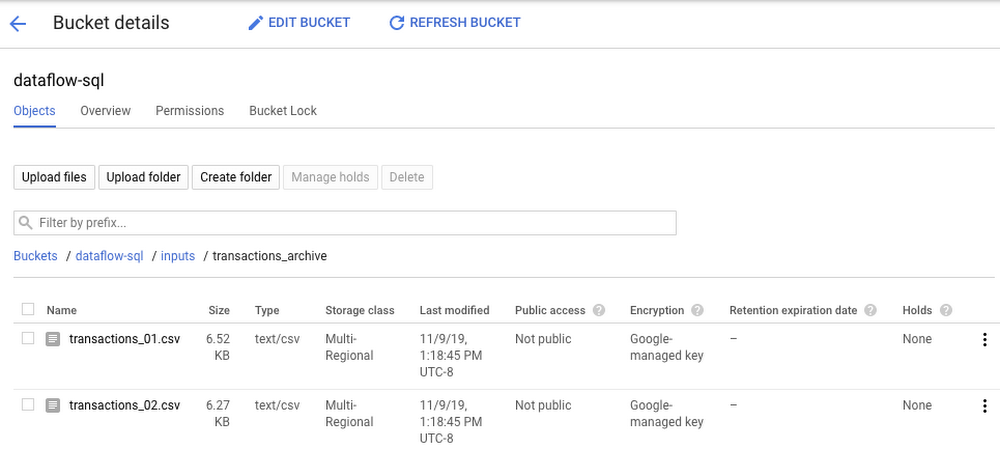
Two gcloud commands can define a Cloud Storage file set and entry group in Data Catalog.
#Create a GCS entrygroupgcloud beta data-catalog entry-groups create transactions_archive_eg --location=us-central1#Create the filesetgcloud beta data-catalog entries create transactions_archive_fs --location=us-central1 --entry-group=transactions_archive_eg --gcs-file-patterns=gs://dataflow-sql/inputs/transactions_archive/*.csv --description="Historical Archive of Transactions"
Notice how we defined the file pattern “gs://dataflow-sql/inputs/transactions_archive/*.csv” as part of the file set entry definition. This pattern is what will allow Cloud Dataflow to find the CSV files once we write the SQL statement that references this file set.
We can even specify the schema of this transactions_archive_fs file set using a GUI editor. For that, go to the BigQuery web UI (make sure it is running in Cloud Dataflow mode), select “Add Data” in the left navigation and choose “Cloud Dataflow sources.” Search for your newly added Cloud Storage file set and add it to your active datasets in the BigQuery UI.
This will allow you to edit the schema of your file set after you select it in the nav tree. The “Edit schema” button is right there on the “Schema” tab. The visual schema editor is new and works for both Cloud Storage file sets as well as for Cloud Pub/Sub topics.
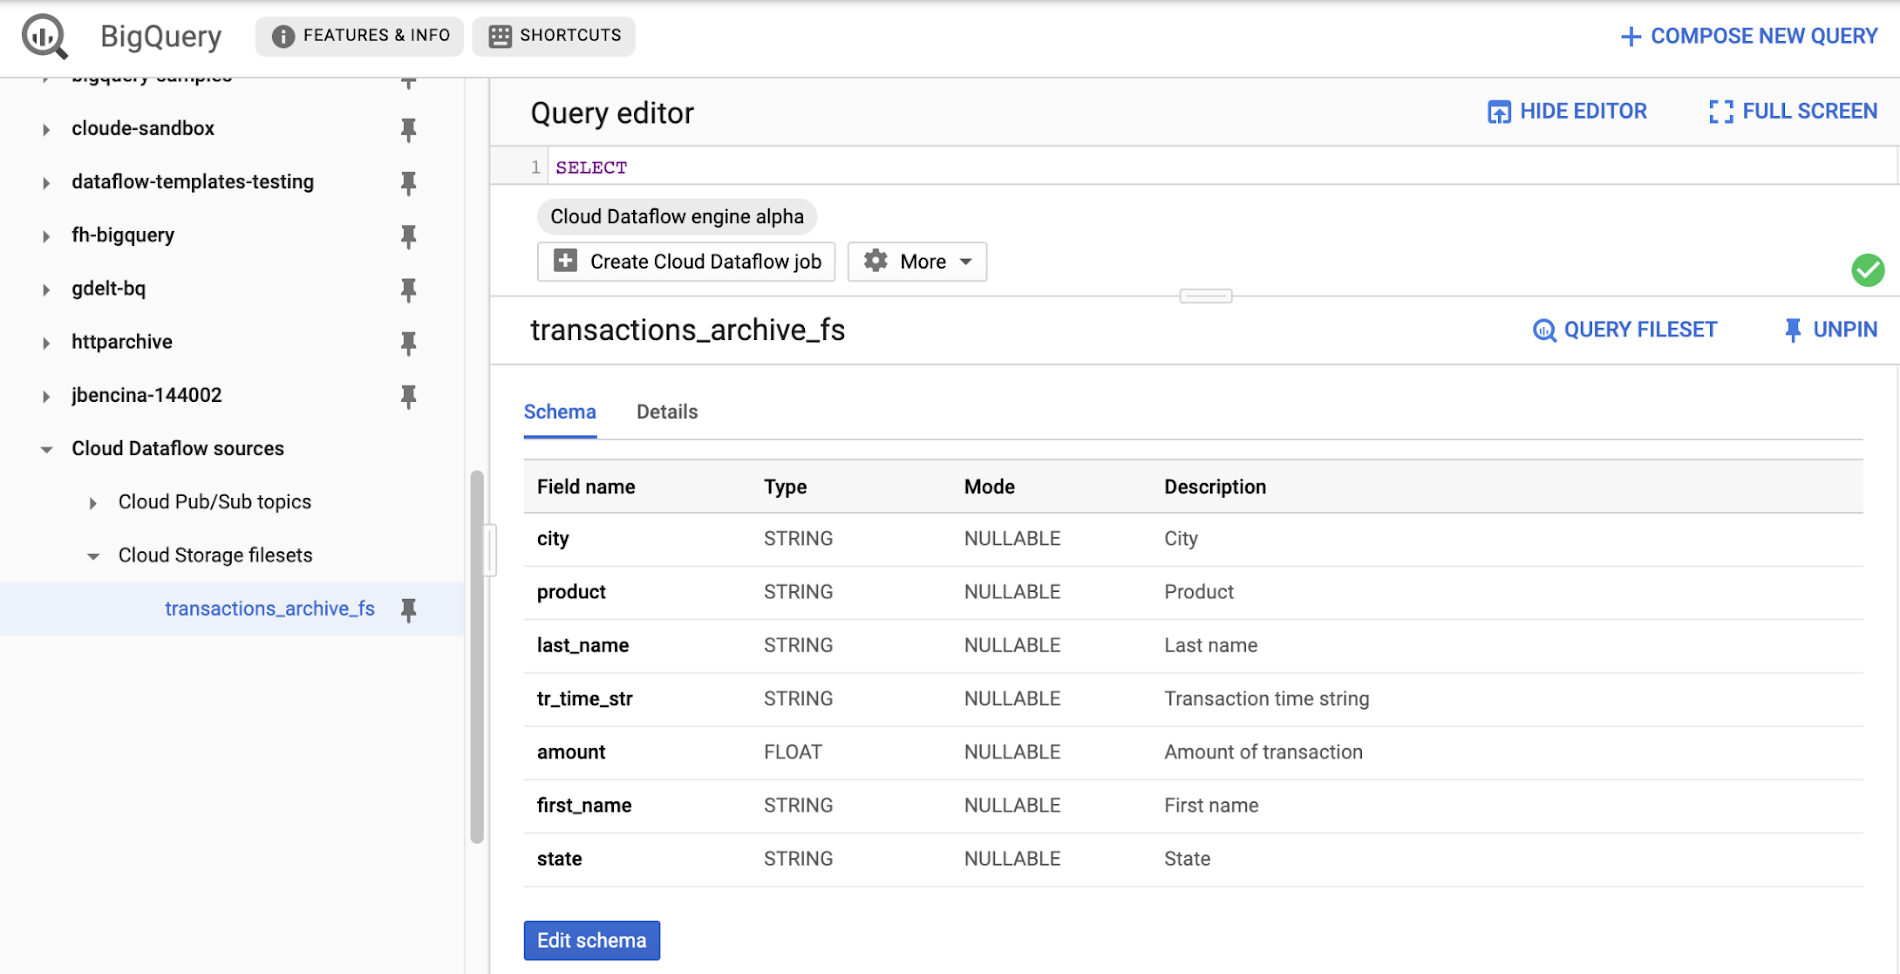
Once you’ve registered the file set in Data Catalog and defined a schema for it, you can query it in Cloud Dataflow SQL. In the next example, we’ll join the transactions archive in Cloud Storage with the metadata mapping table in BigQuery.
SELECTsr.sales_region,TUMBLE_START("INTERVAL 5 SECOND") AS period_start,SUM(tr.amount) as amountFROM datacatalog.entry.`dataflow-sql`.`us-central1`.transactions_archive_eg.transactions_archive_fs AS trINNER JOIN bigquery.table.`dataflow-sql`.dataflow_sql_ds.us_state_salesregions AS srON tr.state = sr.state_codeGROUP BYsr.sales_region,TUMBLE(CAST(tr.tr_time_str AS TIMESTAMP), "INTERVAL 5 SECOND")
Notice how similar this SQL statement is to the one that queries Cloud Pub/Sub. The TUMBLE window function even works on Cloud Storage files, although we will define the windows based on a field “tr_time_str” that is inside the files (the Cloud Pub/Sub SQL statement used the tr.event_timestamp attribute of the Cloud Pub/Sub stream). The only other difference is the reference to the Cloud Storage file set. We accomplish this by specifying datacatalog.entry.`dataflow-sql`.`us-central1`.transactions_archive_eg.transactions_archive_fs AS tr
Because both of the job inputs are bounded (batch) sources, Cloud Dataflow SQL will create a batch job (instead of a streaming job created for the first SQL statement using a Cloud Pub/Sub source) which will join your Cloud Storage files with the BigQuery table, and write the results back to BigQuery.
And now you have both a streaming pipeline feeding your real-time dashboard from a Cloud Pub/Sub topic, as well as a batch pipeline capable of onboarding historical data from CSV files. Check out the SQL Pipelines tutorial to start applying your SQL skills for developing streaming (and batch) Cloud Dataflow pipelines.
FlexRS for cost-effective batch processing of events
While real-time streaming processing is an exciting use case that’s growing rapidly, many streaming practitioners know that every stream processing system needs a sprinkle of batch processing (as you saw in the SQL example). When you bootstrap a streaming pipeline, you usually need to onboard historical data, and this data tends to reside in files stored in Cloud Storage. When streaming events need to be reprocessed due to changes in business logic (i.e., time windows get readjusted, or new fields are added), this reprocessing is also better done in batch mode.
The Apache Beam SDK and the Cloud Dataflow managed service are well-known in the industry for their unified API approach to batch and streaming analytics. The same Cloud Dataflow code can run in either mode with just minimal changes (usually replacing the data source from Cloud Pub/Sub to Cloud Storage). Remember our SQL example, where switching the SQL statement from a streaming source to a batch source was no trouble at all? And while it’s easy to go back and forth between streaming and batch processing in Cloud Dataflow, an important factor influencing the processing choice is cost. Customers who gravitate to batch processing have always looked to find the right balance between the speed of execution and costs. In many cases, that may mean you can be flexible with the amount of time it takes to process a dataset if the overall cost of processing is reduced in a significant fashion.
Our new Cloud Dataflow FlexRS feature reduces batch processing costs by up to 40% using advanced resource scheduling techniques and a mix of different virtual machine (VM) types (including the preemptible VM instances) to decrease processing costs while providing the same job completion guarantees as regular Cloud Dataflow jobs. FlexRS uses the Cloud Dataflow Shuffle service, which allows it to handle the preemption of worker VMs better because the Cloud Dataflow service does not have to redistribute unprocessed data to the remaining workers.
Using FlexRS requires no code changes in your pipeline and can be accomplished by simply specifying the following pipeline parameter:
--flexRSGoal=COST_OPTIMIZED
Running Cloud Dataflow jobs with FlexRS requires autoscaling, a regional endpoint in the intended region, and specific machine types, so you should review the recommendations for other pipeline settings. While Cloud Dataflow SQL does not yet support FlexRS, it will in the future.
Simultaneously with launching FlexRS in general availability, we are also extending its availability to five additional regions, covering all regions now where we have regional endpoints and Cloud Dataflow Shuffle:
- us-central1
- us-east1
- us-west1
- europe-west1
- europe-west4
- asia-east1
- asia-northeast1
To learn more about Cloud Dataflow SQL, check out our tutorial and try creating your SQL pipeline using the BigQuery web UI. Visit our documentation site for additional FlexRS usage and pricing information.
Check out other recently launched streaming and batch processing features:
- We deployed Cloud Dataflow Shuffle and Cloud Dataflow Streaming Engine to three additional regions, bringing total availability to seven regions.
- We launched the ability to protect your pipeline state with customer-managed encryption keys.
Python streaming support from Cloud Dataflow is now generally available.
2843
Of your peers have already watched this video.
22:00 Minutes
The most insightful time you'll spend today!
Deploying Real-time AI: A Walkthrough
Enterprises are increasingly looking to leverage streaming data (customer interactions, sales transactions, machine logs) for building new innovative features, increasing sales, and protecting against risks.
AI/ML (artificial intelligence/machine learning) technologies make it possible to amp up the detection of insights in large volumes of data: insights that otherwise would be impossible to gain with manual inspection.
Learn how Dataflow together with TensorFlow Extended (TFX) and Cloud AI are enabling the extraction of label and classification information from video clips and natural text, predicting probabilities and detecting anomalies, fraud, and patterns in streams of business data.
More Relevant Stories for Your Company
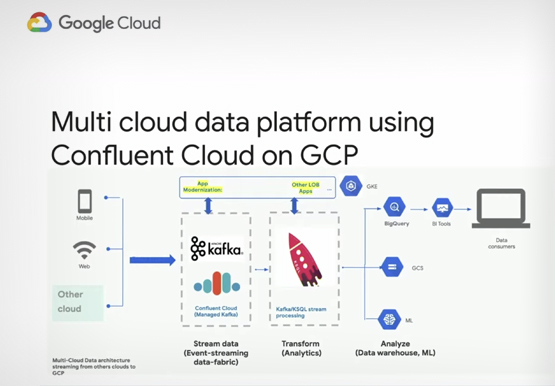
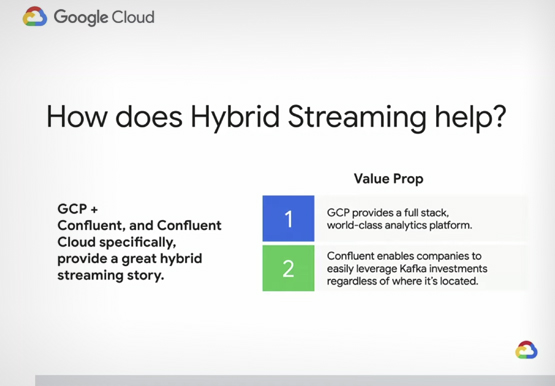

How to Build a Data Pipeline Across Hybrid and Multi-region Infrastructures
Building a data pipeline on Google Cloud is one of the most common things enterprises do. Increasingly, organizations want to build these data pipelines across hybrid infrastructures. Using Apache Kafka as a way to stream data across hybrid and multi-region infrastructures is a common pattern to create a consistent data

How Eventrac and Workflows Integration Helps Implement Hybrid Architecture in Google Cloud
I previously talked about Eventarc for choreographed (event-driven) Cloud Run services and introduced Workflows for orchestrated services. Eventarc and Workflows are very useful in strictly choreographed or orchestrated architectures. However, you sometimes need a hybrid architecture that combines choreography and orchestration. For example, imagine a use case where a message to a Pub/Sub topic
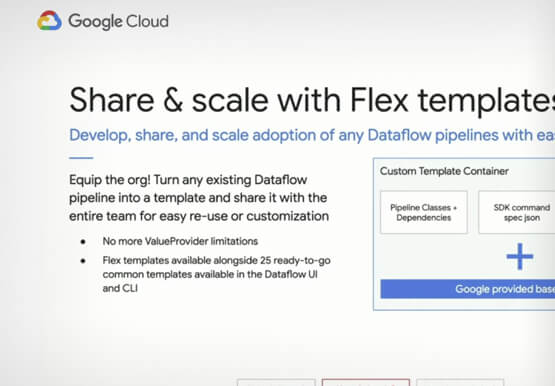
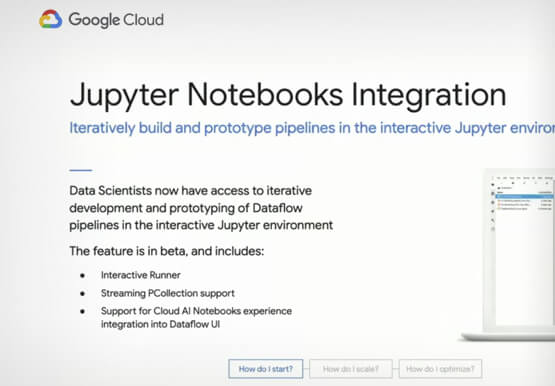

Tools to Simplify Streaming Analytics
Streaming analytics is transforming how companies interact with their customers and operate with agility. Dataflow supports a number of features to guide you through your journey to adopt streaming, including notebooks for writing your first pipeline, SQL to accelerate your streaming deployments, Flex Templates to scale streaming in your organization,

Fairygoodboss and Google Cloud Tied to Advancing Diversity and Female Leadership at Workplaces
May is Asian American Pacific Islander Heritage Month — a time for us to come together to celebrate and remember the important people and history of Asian and Pacific Island heritage. This feature highlights founder Georgene Huang and how her startup Fairygodboss uses easy to use Google Cloud tools to
