





3017
Of your peers have already watched this video.
25:00 Minutes
The most insightful time you'll spend today!
Data Catalog for Data Discovery and Metadata Management
Data discovery and metadata management is a common pain point for most enterprises. Data Catalog is a managed service that addresses this pain point with a scalable and performant solution.
“Data catalog, simply put, enables users to discover, understand, and manage all their data assets,” says Shekhar Bapat, Product Manager, Google Cloud.
Data Catalog also offers integration with DLP for auto detection and tagging of sensitive data and facilitates better data governance. Data Catalog provides support for non-Google Cloud data assets and enables customers to discover, understand, and manage ALL their data.
The session is co-presented with Shruti Thaker, Head of Alt Vendor Data and Alpha Capture, BlackRock, which has invested in Data Catalog. Thaker will share how BlackRock is using Data Catalog to create an effective metadata solution for BlackRock data assets.
Google Cloud Helps Northwell Health to Boost Caregiver Productivity and Access to Right Care Using AI

7994
Of your peers have already read this article.
2:00 Minutes
The most insightful time you'll spend today!
Lung cancer is the leading cause of cancer death in the United States and like any cancer, early detection is crucial to survival. Screening at-risk populations is an important part of reducing mortality, and if concerning nodules are found on imaging, further testing may be required. Today, we’ll share how Northwell Health uses Google Cloud products such as Cloud Healthcare APIs and BigQuery to increase caregiver productivity and deliver better care for patients with findings that indicate potential development of lung cancer.
Northwell is New York’s largest healthcare provider
Northwell Health is New York’s largest healthcare provider with 23 hospitals and nearly 800 outpatient facilities. Northwell’s nearly 4,000 doctors care for millions of patients each year, and at this scale, there is an immense amount of healthcare data to manage. To better manage and leverage this data, Northwell Health partnered with Google Cloud starting in 2018.
Enabling caregivers to spend more time with patients
Nic Lorenzen, the lead developer of Northwell Emerging Technology and Innovation team, has a mission to put together data for caregivers in a way that makes sense. It is no secret that inefficient electronic health records systems have a negative impact on a physician’s ability to deliver quality care. Traditional EHRs have information distributed across many tabs, which forces caregivers to spend considerable time at the computer trying to find information. Moreover, speed of care matters. If care is delayed, patients may have to spend more time in the hospital and may suffer worse health outcomes.
To solve this problem, Nic’s team focused on giving caregivers the most relevant pieces of data at the right time by developing an intelligent clinician rounding app. The data needed to derive these insights can depend on the caregiver’s role–a nurse cares about different things than a cardiologist. This system aggregates multiple data sources, and provides patient-specific insights to caregivers.
This system would not have been possible before with traditional EHRs and data warehouses that have proprietary data models and rarely sync data in real time. Now with data easily accessible through Google Cloud’s Healthcare solutions, Nic’s team can deliver the right clinical information to the right people instantly. These days, Nic says, “instead of spending 75% of our time dealing with architecting the underlying platforms, we spend 75% of our time focused on higher value use cases for clinicians and patients. Google Cloud’s Healthcare solutions have greatly improved our developer productivity and time to value.”
Caregivers have found this new system to be a game changer.Before the implementation of this system, caregivers would spend, on average, seven to nine minutes finding the data needed to make medical decisions for one patient. Now, that aggregated information is delivered to a caregiver’s mobile device in less than a second.
Ensuring patients get the right care with the power of AI
There are a number of reasons why patients might not get the care that they need. For example, patients today can go to multiple hospitals and clinics settings, and coordinating care across multiple facilities is complex. Regional hospitals and clinics have their own siloed view of their data, so pertinent information gathered by one clinic might not be seen by another. These gaps in clinical data lead to gaps in patient care.
When a patient gets radiologic imaging, they may have findings unrelated to the reason they initially got the imaging. For example, a chest CT for a car accident might reveal an incidental lung nodule that could be cancerous. Unfortunately, research shows that a large portion of patients do not get follow up for these incidental findings because it isn’t the primary reason why the patient is seeing a doctor. Moreover, social determinants of health are a factor that affects which patients receive follow-up care. Identifying these patients and providing the necessary follow up care prevents adverse events related to delayed detection of cancer.

With Cloud Healthcare solutions, Northwell built an AI model to identify these patients so that oncologists can appropriately follow up with patients who have findings suspicious for lung cancer. The AI model detects incidental pulmonary nodules in radiology reports so that doctors can then contact the patients that need follow-up care. Nic says his team was able to build this system in a week: “Google Cloud did a lot of heavy-lifting for us and allowed us to get to the AI applications much faster. It allowed us to build a platform that just works.”
Healthcare systems can now rapidly generate healthcare insights with one end-to-end solution, Google Cloud Healthcare Data Engine. It builds on and extends the core capabilities of the Google Cloud Healthcare API to make healthcare data more immediately useful by enabling an interoperable, longitudinal record of patient data. Northwell Health uses Google Cloud as the core of their platform, enabling their developers to create solutions to the most pressing healthcare problems.
Special thanks to Kalyan Pamarthy, Product Management Lead on Cloud Healthcare and Natural Language APIs for contributing to this blog post.
10190
Of your peers have already watched this video.
1:00 Minutes
The most insightful time you'll spend today!
Predict User Churn on Gaming Apps with Google Analytics Data using BigQuery ML
User retention can be a major challenge for mobile game developers. According to the Mobile Gaming Industry Analysis in 2019, most mobile games only see a 25% retention rate for users after the first day. To retain a larger percentage of users after their first use of an app, developers can take steps to motivate and incentivize certain users to return. But to do so, developers need to identify the propensity of any specific user returning after the first 24 hours.
In this blog post, we will discuss how you can use BigQuery ML to run propensity models on Google Analytics 4 data from your gaming app to determine the likelihood of specific users returning to your app.
You can also use the same end-to-end solution approach in other types of apps using Google Analytics for Firebase as well as apps and websites using Google Analytics 4. To try out the steps in this blogpost or to implement the solution for your own data, you can use this Jupyter Notebook.
Using this blog post and the accompanying Jupyter Notebook, you’ll learn how to:
- Explore the BigQuery export dataset for Google Analytics 4
- Prepare the training data using demographic and behavioural attributes
- Train propensity models using BigQuery ML
- Evaluate BigQuery ML models
- Make predictions using the BigQuery ML models
- Implement model insights in practical implementations
Google Analytics 4 (GA4) properties unify app and website measurement on a single platform and are now default in Google Analytics. Any business that wants to measure their website, app, or both, can use GA4 for a more complete view of how customers engage with their business. With the launch of Google Analytics 4, BigQuery export of Google Analytics data is now available to all users. If you are already using a Google Analytics 4 property, you can follow this guide to set up exporting your GA data to BigQuery.
Once you have set up the BigQuery export, you can explore the data in BigQuery. Google Analytics 4 uses an event-based measurement model. Each row in the data is an event with additional parameters and properties. The Schema for BigQuery Export can help you to understand the structure of the data.
In this blogpost, we use the public sample export data from an actual mobile game app called “Flood It!” (Android, iOS) to build a churn prediction model. But you can use data from your own app or website.
Here’s what the data looks like. Each row in the dataset is a unique event, which can contain nested fields for event parameters.
SELECT *FROM `firebase-public-project.analytics_153293282.events_*`TABLESAMPLE SYSTEM (1 PERCENT)

This dataset contains 5.7M events from over 15k users.
SELECTCOUNT(DISTINCT user_pseudo_id) as count_distinct_users,COUNT(event_timestamp) as count_eventsFROM`firebase-public-project.analytics_153293282.events_*

Our goal is to use BigQuery ML on the sample app dataset to predict propensity to user churn or not churn based on users’ demographics and activities within the first 24 hours of app installation.

In the following sections, we’ll cover how to:
- Pre-process the raw event data from GA4
- Identify users & the label feature
- Process demographic features
- Process behavioral features
- Train classification model using BigQuery ML
- Evaluate the model using BigQueryML
- Make predictions using BigQuery ML
- Utilize predictions for activation
Pre-process the raw event data
You cannot simply use raw event data to train a machine learning model as it would not be in the right shape and format to use as training data. So in this section, we’ll go through how to pre-process the raw data into an appropriate format to use as training data for classification models.
This is what the training data should look like for our use case at the end of this section:

Notice that in this training data, each row represents a unique user with a distinct user ID (user_pseudo_id).
Identify users & the label feature
We first filtered the dataset to remove users who were unlikely to return the app anyway. We defined these ‘bounced’ users as ones who spent less than 10 mins with the app. Then we labeled all remaining users:
- churned: No event data for the user after 24 hours of first engaging with the app.
- returned: The user has at least one event record after 24 hours of first engaging with the app.
For your use case, you can have a different definition of bounce and churning. Also you can even try to predict something else other than churning, e.g.:
- whether a user is likely to spend money on in-game currency
- likelihood of completing n-number of game levels
- likelihood of spending n amount of time in-game etc.
In such cases, label each record accordingly so that whatever you are trying to predict can be identified from the label column.
From our dataset, we found that ~41% users (5,557) bounced. However, from the remaining users (8,031), ~23% (1,883) churned after 24 hours:
SELECTbounced,churned,COUNT(churned) as count_usersFROMbqmlga4.returningusersGROUP BY 1,2ORDER BY bounced

To create these bounced and churned columns, we used the following snippet of SQL code.
...#churned = 1 if last_touch within 24 hr of app installation, else 0IF (user_last_engagement < TIMESTAMP_ADD(user_first_engagement,INTERVAL 24 HOUR),1,0 ) AS churned,#bounced = 1 if last_touch within 10 min, else 0IF (user_last_engagement <= TIMESTAMP_ADD(user_first_engagement,INTERVAL 10 MINUTE),1,0 ) AS bounced,...
You can view the Jupyter Notebook for the full query used for materializing the bounced and churned labels.
Process demographic features
Next, we added features both for demographic data and for behavioral data spanning across multiple columns. Having a combination of both demographic data and behavioral data helps to create a more predictive model.
We used the following fields for each user as demographic features:
geo.countrydevice.operating_systemdevice.language
A user might have multiple unique values in these fields — for example if a user uses the app from two different devices. To simplify, we used the values from the very first user engagement event.
CREATE OR REPLACE VIEW bqmlga4.user_demographics AS (WITH first_values AS (SELECTuser_pseudo_id,geo.country as country,device.operating_system as operating_system,device.language as language,ROW_NUMBER() OVER (PARTITION BY user_pseudo_id ORDER BY event_timestamp DESC) AS row_numFROM `firebase-public-project.analytics_153293282.events_*`WHERE event_name="user_engagement")SELECT * EXCEPT (row_num)FROM first_valuesWHERE row_num = 1 #first engagement);
Process behavioral features
There is additional demographic information present in the GA4 export dataset, e.g. app_info, device, event_params, geo etc. You may also send demographic information to Google Analytics through each hit via user_properties. Furthermore, if you have first-party data on your own system, you can join that with the GA4 export data based on user_ids.
To extract user behavior from the data, we looked into the user’s activities within the first 24 hours of first user engagement. In addition to the events automatically collected by Google Analytics, there are also the recommended events for games that can be explored to analyze user behavior. For our use case, to predict user churn, we counted the number of times the follow events were collected for a user within 24 hours of first user engagement:
user_engagementlevel_start_quickplaylevel_end_quickplaylevel_complete_quickplaylevel_reset_quickplaypost_scorespend_virtual_currencyad_rewardchallenge_a_friendcompleted_5_levelsuse_extra_steps
The following query shows how these features were calculated:
WITHevents_first24hr AS (SELECTe.*FROM`firebase-public-project.analytics_153293282.events_*` eJOINbqmlga4.returningusers rONe.user_pseudo_id = r.user_pseudo_idWHERETIMESTAMP_MICROS(e.event_timestamp) <= r.ts_24hr_after_first_engagement)SELECTuser_pseudo_id,SUM(IF(event_name = 'user_engagement', 1, 0)) AS cnt_user_engagement,# ... repeated for all behavior data ...SUM(IF(event_name = 'use_extra_steps', 1, 0)) AS cnt_use_extra_steps,FROMevents_first24hrGROUP BY1
View the notebook for the query used to aggregate and extract the behavioral data. You can use different sets of events for your use case. To view the complete list of events, use the following query:
SELECTevent_name,COUNT(event_name) as event_countFROM`firebase-public-project.analytics_153293282.events_*`GROUP BY 1ORDER BYevent_count DESC
After this we combined the features to ensure our training dataset reflects the intended structure. We had the following columns in our table:
- User ID:
user_pseudo_id
- Label:
churned
- Demographic features
countrydevice_osdevice_language
- Behavioral features
cnt_user_engagementcnt_level_start_quickplaycnt_level_end_quickplaycnt_level_complete_quickplaycnt_level_reset_quickplaycnt_post_scorecnt_spend_virtual_currencycnt_ad_rewardcnt_challenge_a_friendcnt_completed_5_levelscnt_use_extra_stepsuser_first_engagement
At this point, the dataset was ready to train the classification machine learning model in BigQuery ML. Once trained, the model will output a propensity score between churn (churned=1) or return (churned=0) indicating the probability of a user churning based on the training data.
Train classification model
When using the CREATE MODEL statement, BigQuery ML automatically splits the data between training and test. Thus the model can be evaluated immediately after training (see the documentation for more information).
For the ML model, we can choose among the following classification algorithms where each type has its own pros and cons:

Often logistic regression is used as a starting point because it is the fastest to train. The query below shows how we trained the logistic regression classification models in BigQuery ML.
CREATE OR REPLACE MODEL bqmlga4.churn_logregTRANSFORM(EXTRACT(MONTH from user_first_engagement) as month,EXTRACT(DAYOFYEAR from user_first_engagement) as julianday,EXTRACT(DAYOFWEEK from user_first_engagement) as dayofweek,EXTRACT(HOUR from user_first_engagement) as hour,* EXCEPT(user_first_engagement, user_pseudo_id))OPTIONS(MODEL_TYPE="LOGISTIC_REG",INPUT_LABEL_COLS=["churned"]) ASSELECT*FROMbqmlga4.train
We extracted month, julianday, and dayofweek from datetimes/timestamps as one simple example of additional feature preprocessing before training. Using TRANSFORM() in your CREATE MODEL query allows the model to remember the extracted values. Thus, when making predictions using the model later on, these values won’t have to be extracted again. View the notebook for the example queries to train other types of models (XGBoost, deep neural network, AutoML Tables).
Evaluate model
Once the model finished training, we ran ML.EVALUATE to generate precision, recall, accuracy and f1_score for the model:
SELECT*FROMML.EVALUATE(MODEL bqmlga4.churn_logreg)

The optional THRESHOLD parameter can be used to modify the default classification threshold of 0.5. For more information on these metrics, you can read through the definitions on precision and recall, accuracy, f1-score, log_loss and roc_auc. Comparing the resulting evaluation metrics can help to decide among multiple models.Furthermore, we used a confusion matrix to inspect how well the model predicted the labels, compared to the actual labels. The confusion matrix is created using the default threshold of 0.5, which you may want to adjust to optimize for recall, precision, or a balance (more information here).
SELECTexpected_label,_0 AS predicted_0,_1 AS predicted_1FROMML.CONFUSION_MATRIX(MODEL bqmlga4.churn_logreg)

This table can be interpreted in the following way:

Make predictions using BigQuery ML
Once the ideal model was available, we ran ML.PREDICT to make predictions. For propensity modeling, the most important output is the probability of a behavior occurring. The following query returns the probability that the user will return after 24 hrs. The higher the probability and closer it is to 1, the more likely the user is predicted to return, and the closer it is to 0, the more likely the user is predicted to churn.
SELECTuser_pseudo_id,returned,predicted_returned,predicted_returned_probs[OFFSET(0)].prob as probability_returnedFROMML.PREDICT(MODEL bqmlga4.churn_logreg,(SELECT * FROM bqmlga4.train)) #can be replaced with a proper test dataset
Utilize predictions for activation
Once the model predictions are available for your users, you can activate this insight in different ways. In our analysis, we used user_pseudo_id as the user identifier. However, ideally, your app should send back the user_id from your app to Google Analytics. In addition to using first-party data for model predictions, this will also let you join back the predictions from the model into your own data.
- You can import the model predictions back into Google Analytics as a user attribute. This can be done using the Data Import feature for Google Analytics 4. Based on the prediction values you can Create and edit audiences and also do Audience targeting. For example, an audience can be users with prediction probability between 0.4 and 0.7, to represent users who are predicted to be “on the fence” between churning and returning.
- For Firebase Apps, you can use the Import segments feature. You can tailor user experience by targeting your identified users through Firebase services such as Remote Config, Cloud Messaging, and In-App Messaging. This will involve importing the segment data from BigQuery into Firebase. After that you can send notifications to the users, configure the app for them, or follow the user journeys across devices.
- Run targeted marketing campaigns via CRMs like Salesforce, e.g. send out reminder emails.
You can find all of the code used in this blogpost in the Github repository:
What’s next?
Continuous model evaluation and re-training
As you collect more data from your users, you may want to regularly evaluate your model on fresh data and re-train the model if you notice that the model quality is decaying.
Continuous evaluation—the process of ensuring a production machine learning model is still performing well on new data—is an essential part in any ML workflow. Performing continuous evaluation can help you catch model drift, a phenomenon that occurs when the data used to train your model no longer reflects the current environment.
To learn more about how to do continuous model evaluation and re-train models, you can read the blogpost: Continuous model evaluation with BigQuery ML, Stored Procedures, and Cloud Scheduler
More resources
If you’d like to learn more about any of the topics covered in this post, check out these resources:
- BigQuery export of Google Analytics data
- BigQuery ML quickstart
- Events automatically collected by Google Analytics 4
- Qwiklabs: Create ML models with BigQuery ML
Or learn more about how you can use BigQuery ML to easily build other machine learning solutions:
- How to build demand forecasting models with BigQuery ML
- How to build a recommendation system on e-commerce data using BigQuery ML
Let us know what you thought of this post, and if you have topics you’d like to see covered in the future! You can find us on Twitter at @polonglin and @_mkazi_.Thanks to reviewers: Abhishek Kashyap, Breen Baker, David Sabater Dinter.
3078
Of your peers have already watched this video.
15:30 Minutes
The most insightful time you'll spend today!
What’s New and What’s Next in Smart Analytics
Data platform architectures that were designed 20 years ago struggle to solve the business problems of 2020 and beyond.
Learn how the latest innovations in Google Cloud’s smart analytics platform can help strip out layers of complexity and analyze data seamlessly in a multi-cloud world.
In this keynote, Debanjan Saha, GM & VP, Engineering, Google Cloud and Vittorio Cretella, Chief Information Officer, The Procter & Gamble Company, share a compelling vision of what’s next in our smart analytics platform and demonstrate our newest solution innovations.
Plus, Luminary customers share how they are using Google Cloud to accelerate their data-driven digital transformations.
An Expert’s Opinion on What Early-stage Startups Must Know

6474
Of your peers have already read this article.
3:00 Minutes
The most insightful time you'll spend today!
As lead for analytics and AI solutions at Google Cloud, my team works with startups building on Google Cloud. This puts us in the fortunate position to learn from founders and engineers about how early-stage startups’ investments can either constrain them or position them for success, even at the seed level. In this post, I want to share a few of the best practices to keep in mind as you’re building.
Understand your value proposition before diving into a technology stack
If you’re launching a startup in the cloud, you’re no doubt thinking about a technology stack, but it’s important to step back a bit and think carefully about the major value proposition that your startup offers to your customers. That value proposition is going to fundamentally drive the kind of technology that you should pick.
For example, does your system need processing in real time, or can it be done in a batch mode? Can you rely on once-a-day insights or do the insights have to come in as events happen?
Additionally, what kind of latency will your customers face? That latency makes your value proposition either usable or unusable. Early on in Google’s development, leaders realized that no one was going to wait more than a few hundred milliseconds for a web page to show them their results, and that realization drove the technology decisions that have allowed Google to scale from being a startup in a garage to being a trillion dollar company. Your startup needs to define its value to customers with this level of specificity before it can build a technology stack suited to its needs.
Focus on customer interactions
A few companies have gracefully pulled off big IT pivots that reshaped their value proposition. Netflix, for example, moved from mostly sending DVDs through the mail to becoming a streaming service and major content producer. That’s a huge shift in the user experience and the technology stack necessary to support it, even if the underlying value proposition (i.e., get content to customers) was broadly the same. But it’s also an outlier. If you’re planning for potential changes of this magnitude, rather than focused on getting your value proposition to users, you probably need to sharpen what that value proposition is.
Specifically, you need a clear vision of how customers will access and interact with your business. Typically, they’ll do so over a website or a mobile app, but there are still so many variables.
Are customers going to transmit documents? If so, in what format? Is handwriting supported or is input limited to typing? Can they use images for optical character recognition? Will it mostly be forms? Will the data be structured or unstructured? If all that sounds a little overwhelming, don’t worry, it’ll seem simpler by the end of this article—but also be aware: we’re just getting warmed up.
Imagine that most of your customers will access your business via voice, so you know you’ll want to prioritize conversational workflows. That’s a start—but dig deeper. Even if we suppose you’re usingDialogflow, a Google Cloud conversational AI platform that lets you build and deploy virtual agents, we’re still not really seeing the value proposition. How will all this work, from the beginning of a typical full customer interaction to the resolution? How many interactions will have to be facilitated over low-bandwidth connections, for example? When it comes to user interactions, make sure you can see an end-to-end use case.
Another example: you’re building a retail website, and one of your end-to-end use cases involves the customer asking if a certain amount of a given product is in stock, whether it’s one unit of the product, ten or hundreds. If the product is not sufficiently stocked, you want your app to offer similar items that are. Will your technology stack support this end-to-end use case?
These considerations are not an argument for premature optimization. There’s value in moving fast, getting minimum viable products to users, and then iterating. But in the early stages, you only get one chance to start on the right foot—and how you navigate that chance will influence a lot of dollars and effort down the road. You need to make sure you have business use cases, not just an idea, before you can start designing a technology stack.
Here’s how to get in the right frame of mind. Pick three use cases: two that are “bread and butter” and one that is technologically complex. Make sure your proposed technology stack can support all three, end to end.
Default toward higher levels of abstraction
Now that we’re in the right frame of mind, we’re ready to think about the technology stack more directly.
As a startup, you’ll need to conserve resources, and to do that, you’ll want to build at the highest level of abstraction possible for your value proposition. For example, you probably don’t want your people setting up clusters. You don’t want them configuring things if they can use a fully managed service. You want them focused on building your prototype, not managing infrastructure.
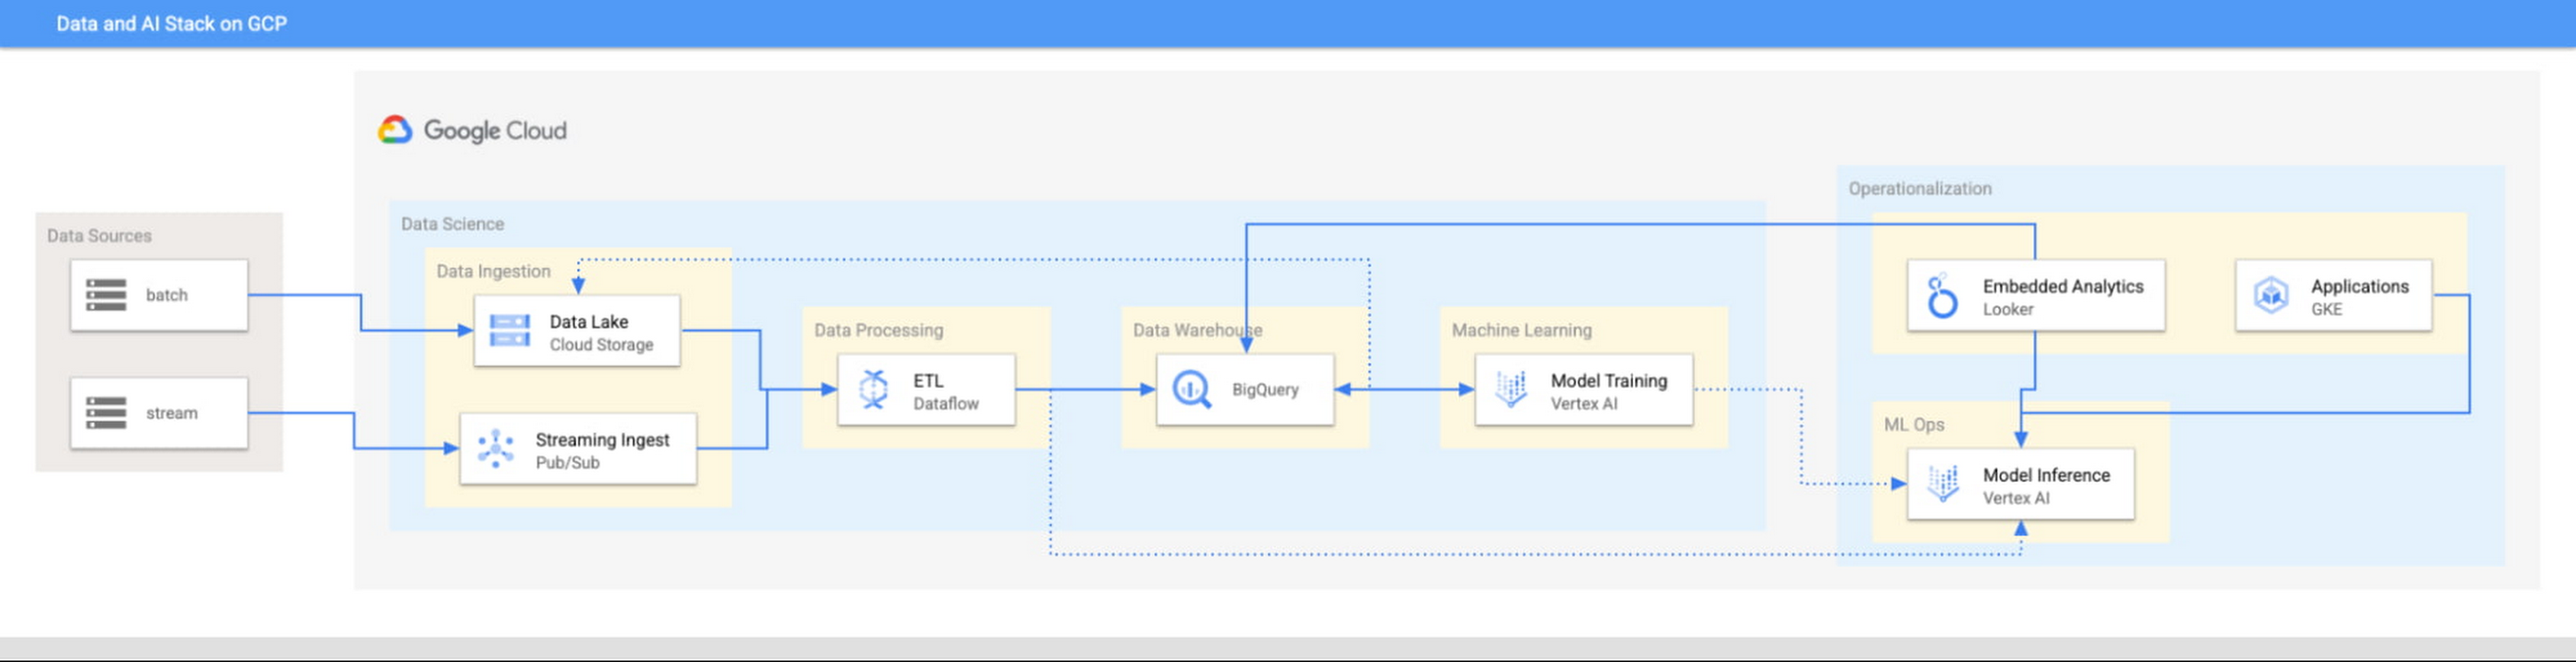
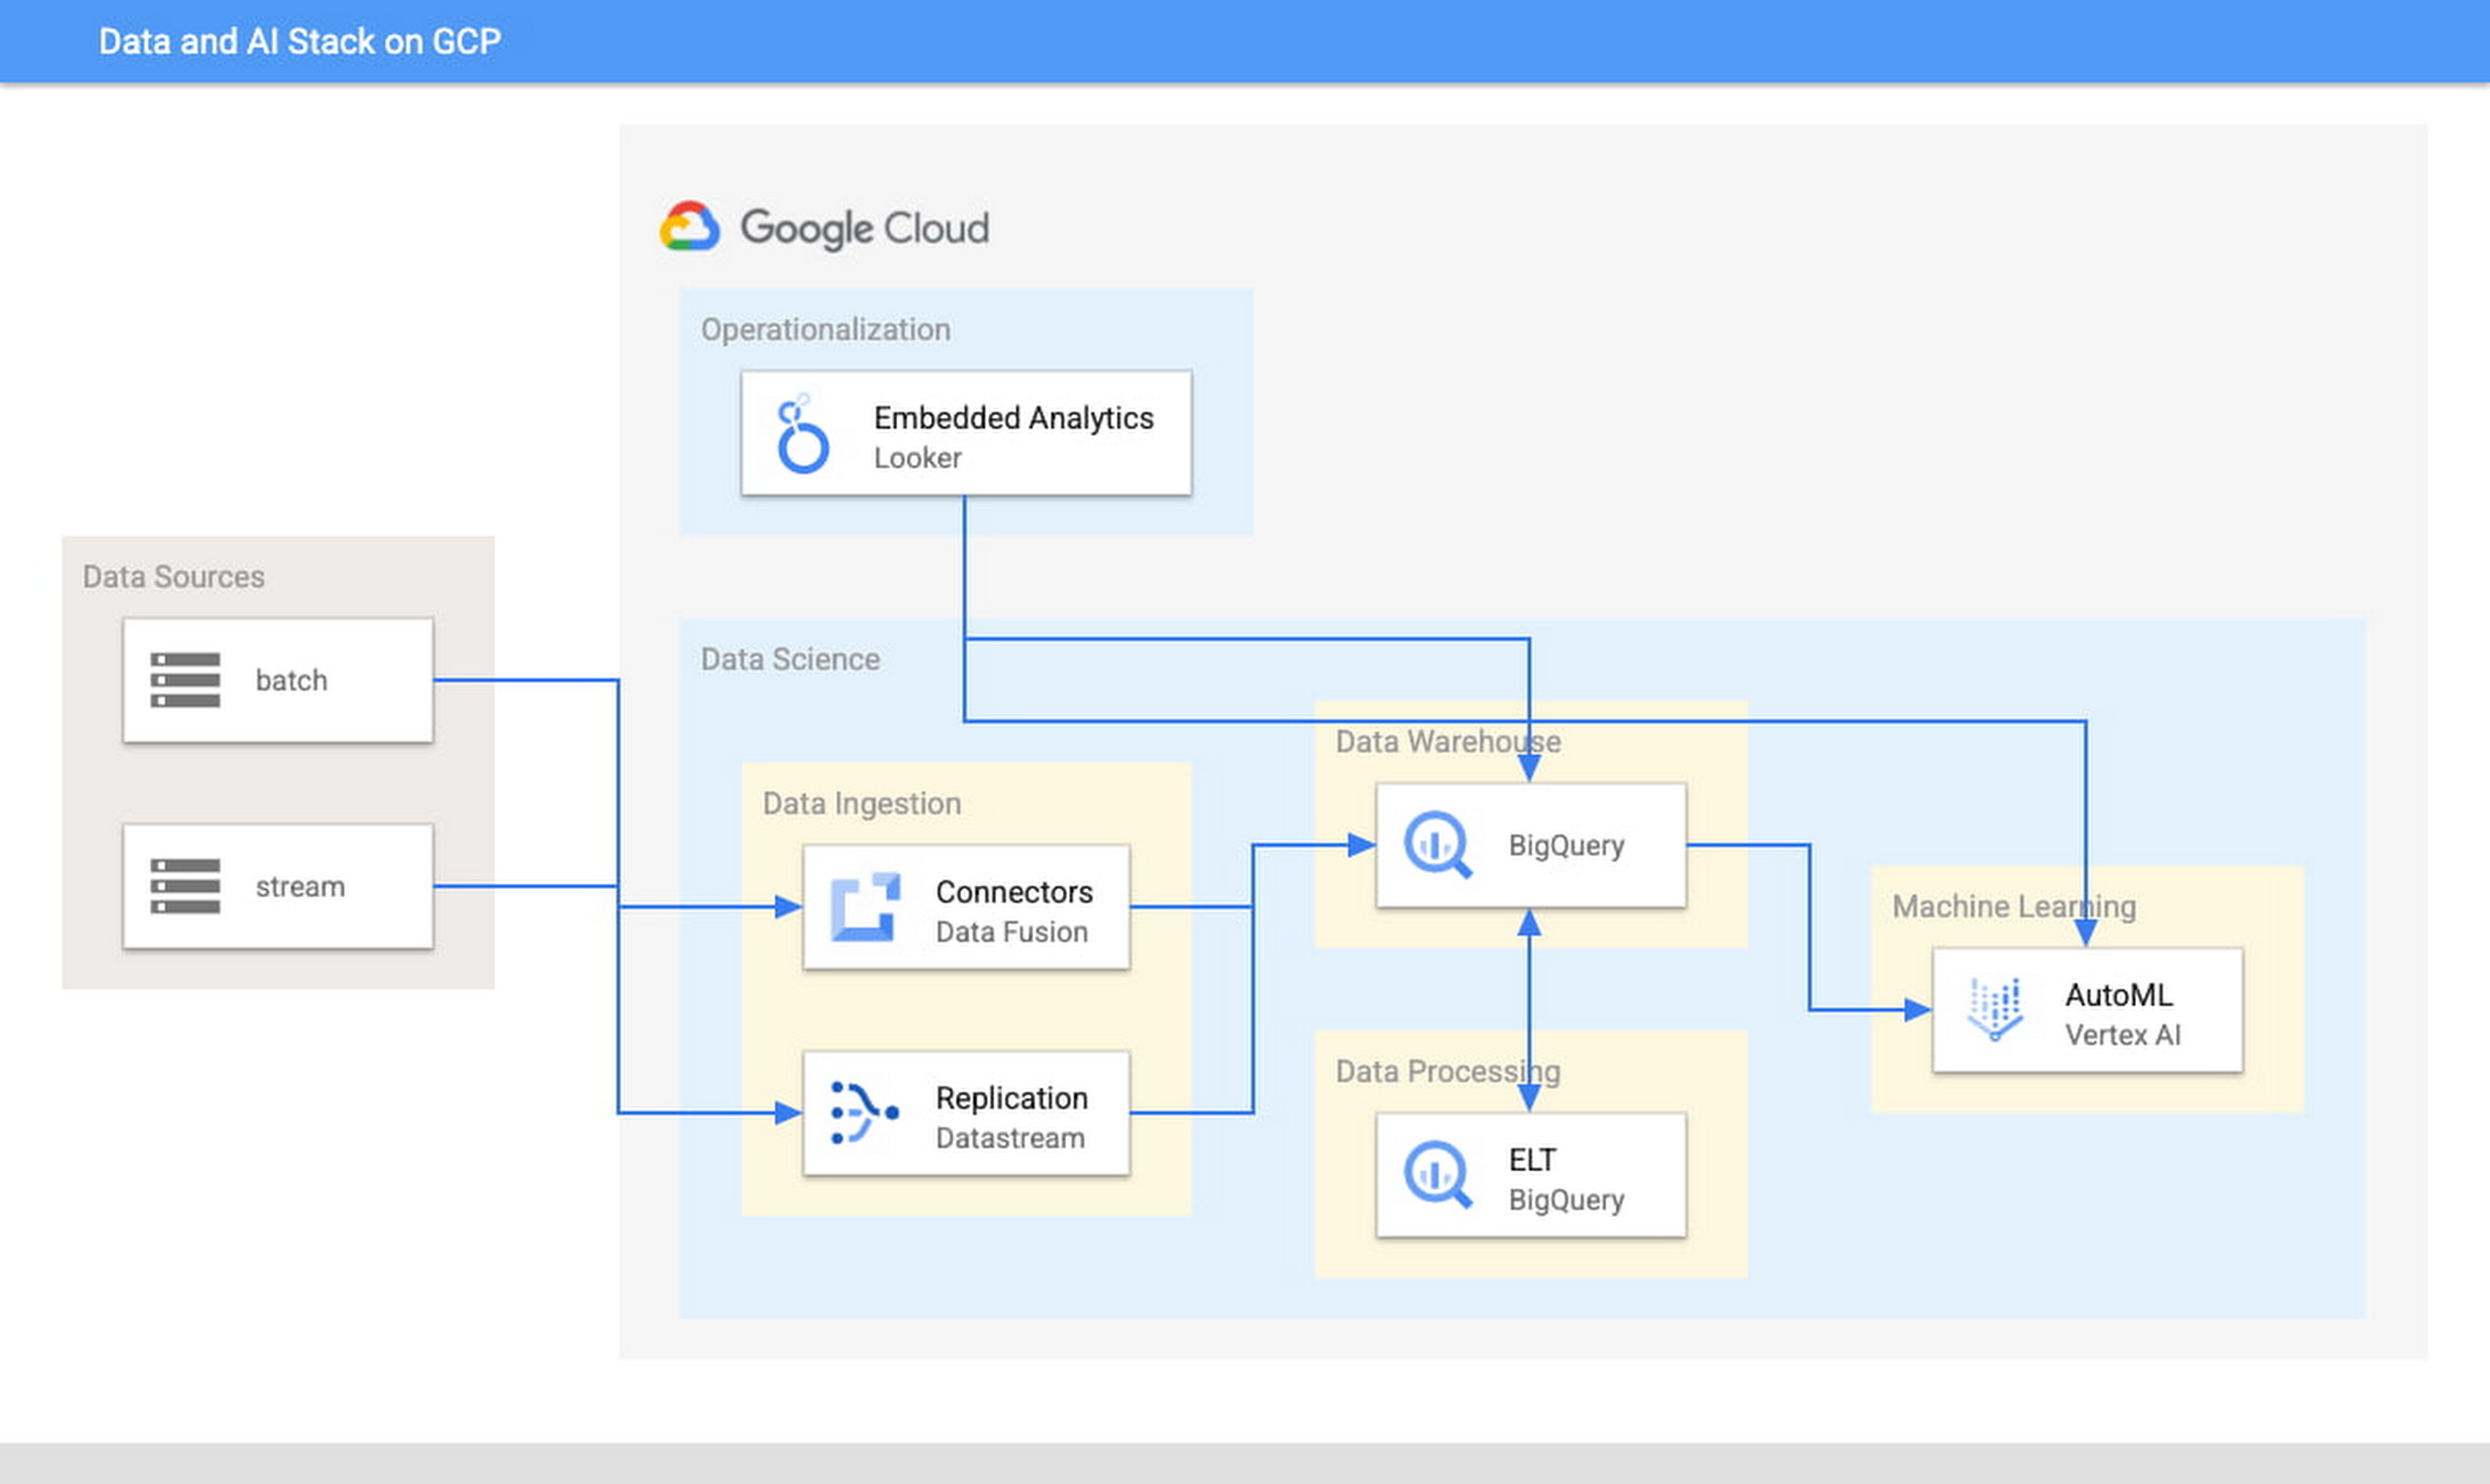
This focus has definitely informed how we create products at Google Cloud, as our canonical data stack—Pub/Sub, Dataflow, BigQuery, and Vertex AI—consists of auto-scaling and serverless products.
But management of infrastructure is not the only place where you should err toward a less-is-more philosophy.
When it comes to architecture, choose no-code over low-code and low-code over writing custom code. For example, rather than writing ETL pipelines to transform the data you need before you land it into BigQuery, you could use pre-built connectors to directly land the raw data into BigQuery. That’s no code right there. Then, transform the data into the form you need using SQL views directly in the data warehouse. This is called ELT, and it is low code. You will be a lot more agile if you choose an ELT approach over an ETL approach.
Another place is when you choose your ML modeling framework. Don’t start with custom TensorFlow models. Start with AutoML. That’s no-code. You can invoke AutoML directly from BigQuery, avoiding the need to build complex data and ML pipelines. If necessary, move on to pre-built models from TensorFlow Hub, HuggingFace, etc. That’s low-code. Build your own custom ML models only as a last resort.
Focus on getting your vision to market, not chasing technology hype
The goal is to pick the right technology stack for bringing your vision to market, generating value for customers, conserving resources, and maintaining flexibility for growth. Early IT investments should usually gravitate toward things that preserve flexibility, such as managed services built on standard protocols or open APIs, but they needn’t always rush to the flashiest technologies. The answer isn’t always ML, for example. The answer might be heuristics to start, with a path to ML once you have collected enough data. You want to make sure that your intelligence layer has enough abstraction so you can mark it up with simple rules at first, but then replace it with a more robust system as you go along.
Launch and iterate fast with these principles
The preceding discussion is a reminder that your most expensive resource is your people—and that you really want them to be focused on building your prototype, minimum viable product or production app You want to launch fast and iterate fast, and the only way you can do that is by focusing on the things that differentiate you.
But regardless of the technologies you use, the bottom line is the same: follow these four principles.
- Figure out your major value proposition and design your tech stack around it.
- Be very careful about user interactions. User experience is super important; you need to make sure you deliver the kind of experience that your customers have grown to expect.
- When you’re building, pick the highest possible level of abstraction possible—the most fully managed tools and no-code/low-code frameworks that give you the functionality that you need.
- Instead of choosing new or flashy technologies, consider if you can build a “good enough” minimum viable product quickly and come back to a better implementation later.
To learn more about why startups are choosing Google Cloud, click here.
Predictive Model Built on Google Cloud Helps You Get a 7-day Mosquito Forecast Report!
4777
Of your peers have already read this article.
3:00 Minutes
The most insightful time you'll spend today!
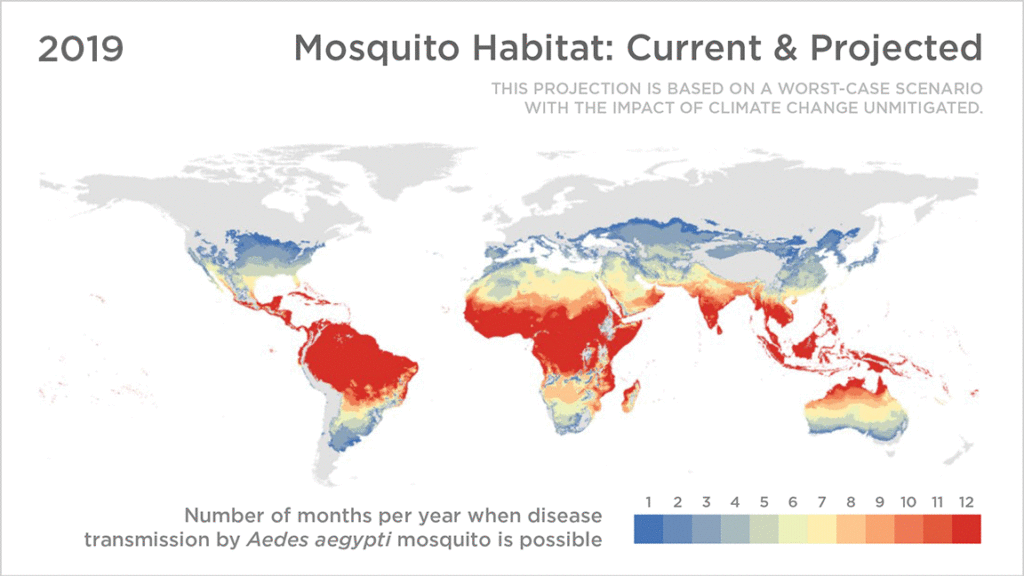
Mosquitoes aren’t just the peskiest creatures on Earth; they infect more than 700 million people a year with dangerous diseases like Zika, Malaria, Dengue Fever, and Yellow Fever. Prevention is the best protection, and stopping mosquito bites before they happen is a critical step.
SC Johnson—a leading developer and manufacturer of pest control products, consumer packaged goods, and other professional products—has an outsized impact in reducing the transmission of mosquito-borne diseases. That’s why Google Cloud was honored to team up with one of the company’s leading pest control brands, OFF!®, to develop a new publicly available, predictive model of when and where mosquito populations are emerging nationwide.
As the planet warms and weather changes, OFF! noticed month-to-month and year-to-year fluctuations in consumer habits at a regional level, due to changes in mosquito populations. Because of these rapid changes, it’s difficult for people to know when to protect themselves. The OFF!Cast Mosquito Forecast™, built on Google Cloud and available today, will predict mosquito outbreaks across the United States, helping communities protect themselves from both the nuisance of mosquitoes and the dangers of mosquito-borne diseases—with the goal of expanding to other markets, like Brazil and Mexico, in the near future.
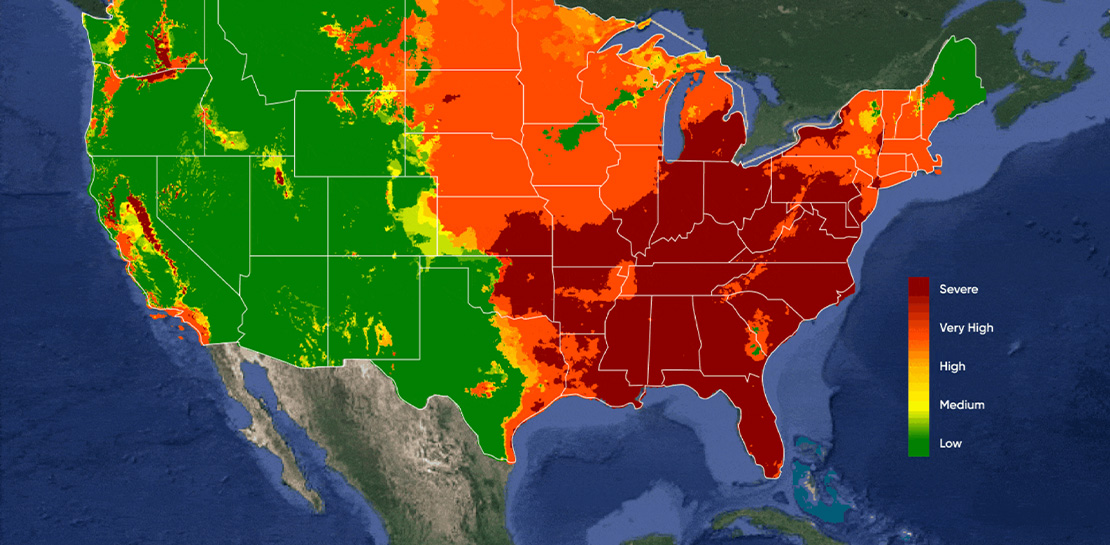
With the OFF!Cast Mosquito Forecast™, anyone can get their local mosquito prediction as easily as a daily weather update. Powered by Google Cloud’s geospatial and data analytics technologies, OFF!Cast Mosquito Forecast is the world’s first public technology platform that predicts and shares mosquito abundance information. By applying data that is informed by the science of mosquito biology, OFF!Cast accurately predicts mosquito behavior and mosquito populations in specific geographical locations.
Starting today, anyone can easily explore OFF!Cast on a desktop or mobile device and get their local seven-day mosquito forecast for any zip code in the continental United States. People can also sign up to receive a weekly forecast. To make this forecasting tool as helpful as possible, OFF! modeled its user interface after popular weather apps, a familiar frame of reference for consumers.

The technology behind the OFF!Cast Mosquito Forecast
To create this first-of-its-kind forecast, OFF! stood up a secure and production-scale Google Cloud Platform environment and tapped into Google Earth Engine, our cloud-based geospatial analysis platform that combines satellite imagery and geospatial data with powerful computing to help people and organizations understand how the planet is changing.
The OFF!Cast Mosquito Forecast is the result of multiple data sources coming together to provide consumers with an accurate view of mosquito activity. First, Google Earth Engine extracts billions of individual weather data points. Then, a scientific algorithm co-developed by the SC Johnson Center for Insect Science and Family Health and Climate Engine experts translates that weather data into relevant mosquito information. Finally, the collected information is put into the model and distilled into a color-coded, seven-day forecast of mosquito populations. The model is applied to the lifecycle of a mosquito, starting from when it lays eggs to when it could bite a human.
The SC Johnson Center for Insect Science and Family Health is one the world’s leading entomology research centers, studying advanced science of insect biology, insect-borne disease prevention and effective product solutions for consumer use. The science behind brands like OFF! is grounded in knowledge from world-class entomologists who have devoted their careers to SC Johnson’s mission of eradicating diseases like Malaria and Zika.
“We are putting the power in consumers’ hands in providing them with a tool to help predict their exposure and prevent mosquito bites,” said Maude Meier, SC Johnson entomologist. “It’s an exciting time to be working in the field of insect science as we find new opportunities to combine science and technology, like Google Earth Engine, to be a force for good in our mission to prevent the spread of insect-borne diseases.”
It takes an ecosystem to battle mosquitos
Over the past decade, academics, scientists and NGOs have used Google Earth Engine and its earth observation data to make meaningful progress on climate research, natural resource protection, carbon emissions reduction and other sustainability goals. It has made it possible for organizations to monitor global forest loss in near real-time and has helped more than 160 countries map and protect freshwater ecosystems. Google Earth Engine is now available in preview with Google Cloud for commercial use.
Our partner, Climate Engine, was a key player in helping make the OFF!Cast Mosquito Forecast a reality. Climate Engine is a scientist-led company that works with Google Cloud and our customers to accelerate and scale the use of Google Earth Engine, in addition to those of Google Cloud Storage and BigQuery, among other tools. With Climate Engine, OFF! integrated insect data from VectorBase, an organization that collects and counts mosquitoes and is funded by the U.S. National Institute of Allergy and Infectious Diseases.
The model powering the OFF!Cast Mosquito Forecast combines three inputs—knowledge of a mosquito’s lifecycle, detailed climate data inputs, and mosquito population counts from more than 5,000 locations provided by VectorBase. The model’s accuracy was validated against precise mosquito population data collected over six years from more than 33 million mosquitoes across 141 different species at more than 5,000 unique trapping locations.
A better understanding of entomology, especially things like degree days and how they affect mosquito populations, and helping communities take action is critically important to improving public health. Learn more about OFF!Cast Mosquito Forecast and see here to learn more about Google Earth Engine on Google Cloud.
More Relevant Stories for Your Company
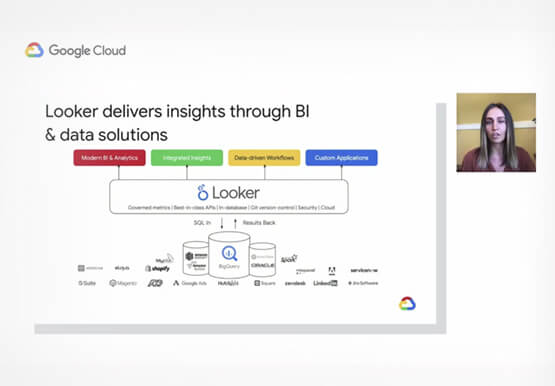
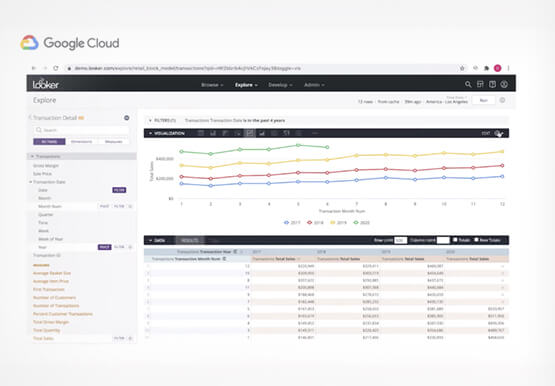
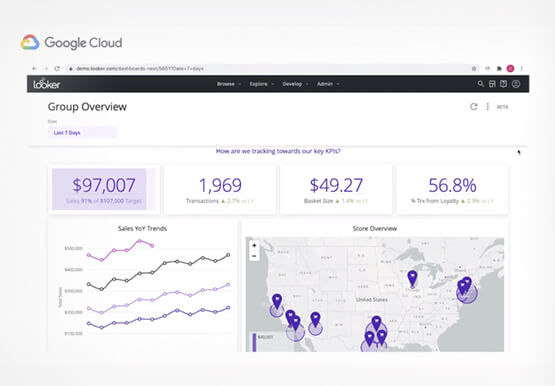

Technical deep dive on Looker: The enterprise BI solution for Google Cloud
Thousands of users accessing petabytes of data on a daily basis: This is a challenging proposition for enterprises, without a doubt. But Looker makes it possible. Beyond just accessing data though, Looker’s platform transforms your company’s relationship with data. Go under the hood of Looker, with Olivia Morgan, Enterprise CE,

Key Highlights on Data Analytics to Smooth Your Organization’s Data Journey
As the Olympics kicked off in Tokyo at the end of July, we found ourselves reflecting on the beauty of diverse countries and cultures coming together to celebrate greatness and sportsmanship. For this month’s blog, we’d like to highlight some key data and analytics performances that should help inspire you


Cloud Dataprep: The Easiest Way to Cleanse Data
Anyone who has worked with data has felt the pain of data preparation. It’s a struggle—if you are working with the wrong tools—to massage data or cleanse data of anomalies, outliers, and just plain old dirty data. Eric Anderson, a Product Manager at Google working on Cloud Dataprep and a

How the City of Memphis Uses Technology to Identify 75 Percent More Potholes
At 340 square miles, the City of Memphis is among the largest in the United States in terms of land area. Memphis has over 6,800 lane-miles of city streets, enough to drive back and forth to Los Angeles four times. Keeping these streets well maintained and safe for citizens and visitors is
