





3969
Of your peers have already watched this video.
1:30 Minutes
The most insightful time you'll spend today!
90-Sec Demos of Truly Incredible Customer Care Calls Powered By AI
How real, fast, and easy do you think an AI-powered call center experience is for customers today?
It’s likely you have seen AI-powered chatbots and are deeply unimpressed with the static nature of the interaction between customers and service representatives.
But that’s not how Google Cloud’s AI-powered contact centers are.
Here have a look yourself. Here’s what a customer from a bank or financial organisation would experience.
And here’s what a customer from a telecom company would experience.
NCR’s Emerald Leverages Google Cloud to Help Grocers Boost Operational Agility

8273
Of your peers have already read this article.
3:00 Minutes
The most insightful time you'll spend today!
In recent years, the grocery industry has had to shift to facilitate a wider variety of checkout journeys for customers. This has meant ensuring a richer transaction mix, including mobile shopping, online shopping, in-store checkout, cashierless checkout or any combination thereof like buy online, pickup in store (BOPIS).
What’s more, in the past year and a half alone grocers have had to enable consumers new ways to shop for essentials. This has included needing to rapidly integrate or build on-demand delivery apps, offer curbside pickup with near-instant fulfillment as well as support touchless and cashless checkout experiences. Searches on Google Maps for retailers in the US with curbside pickup options have increased by 9000% since March 2020, and we believe these trends from 2020 will continue to define the future of grocery shopping.
The future of grocery will require agility and openness
Firstly, the need to rapidly adapt to changing consumer habits will be the new normal. Grocers will increasingly look to digitally transform legacy retail systems and modernize point of sale (POS) platforms to deliver and scale omnichannel experiences as quickly as possible. This necessitates a more agile and open architectural approach to technology – one built on microservices and leverages APIs so that new applications and experiences can be built, integrated and delivered faster.
Automation and data-driven retailing will be table stakes
In order for retailers to blend what they’re offering in the store with digital experiences more efficiently, they will also need to automate more. For example, with automation and business intelligence, grocers can take labor that might have been tied up with tender operations and checkout and redistribute those resources to restocking shelves, curbside pick-up or improving customer experiences.
Automation and access to real-time in-store inventory & supply chain data can also help grocers avoid the supply chain challenges seen in the early days of COVID-19. Grocers will need to find ways to leverage automation to ingest, organize, and analyze data from physical store networks, digital channels, distribution centers to better forecast demand and manage future fluctuations.
How NCR and Google Cloud are helping grocers adapt to disruption with operational agility
Helping grocers improve operational agility to address changing consumer shopping habits and to thrive during times of disruption is something that NCR and Google Cloud have teamed up to do. NCR has over 135 years of experience in retail, having invented the cash register and are continuing to help grocers innovate. NCR Emerald builds upon the company’s leadership in POS software and has turned it into a unified platform that helps grocers operate the entire store from front to back. The solution supports cashier-led checkout, self-checkout, integrated payments, merchandising, and enables regional managers and corporate employees access to the analytics and tools needed to optimize loyalty programs and promotions.

NCR has invested in a comprehensive, agile, and API-led retail architecture that lets grocers continually innovate and design new experiences as customers and the industry evolve. By running Emerald on Google Cloud, NCR can offer the solution on a subscription basis, helping grocers lower upfront capital expenditures and ensuring scalability. What’s more, NCR can tap into Google Cloud’s strength in data, analytics, and openness to deliver three key imperatives. Let’s take a look at each of these below.
Run the way grocers need to while leveraging Google Cloud as a single source of logic
Traditionally the POS system lived in the store. If disaster strikes, people still need access to food and essentials so the grocery store still needs to operate. It hardly gets more mission-critical than that. NCR Emerald is built on microservices, leveraging Kubernetes for front-of-house compute, and VMs (See graphic 1 below). This makes it easy to support lightweight clients accessible by store employees via any range of mobile devices, computer terminals, self-service kiosks, peripheral devices like receipt printers as well as legacy applications.
What’s unique is that because Emerald runs on Google Cloud, it supports all those in-store and digital touchpoints mentioned above, but also allows grocers to run lean. Emerald leverages Google Cloud as a single source of truth and operates a lot of what it does out of logic. Every sales transaction coming from every channel, including e-commerce, can be logged via NCR’s Hosted Service and centralized in BigQuery and Bigtable as a transaction data master. This enables the grocer to manage any transactional use case very consistently, whether it e supporting customers who want to purchase in one store and return in another, offering digital receipts or the ability to exchange online purchases in store. Emerald on Google Cloud can help retailers extend capabilities through the power of the cloud but not need to live exclusively in the cloud. In other words, the solution allows grocers the ability to run the way they need to.

Enable data-driven and real-time decision making for grocers
Store managers, regional managers, category managers, and others all require different cuts of the data to do their jobs effectively. However, data silos persist and how data is formatted and arranged can still remain pretty static. Therefore allowing users with different roles the ability to view and analyze that data quickly and in different ways continues to be a challenge.
As mentioned above, Emerald leverages Google Cloud data management solutions as the central repository for transactional, behavioral, and merchandising data. Every transaction from every store and every channel can be stored via NCR Hosted Service on BigQuery and Bigtable. NCR Analytics then harnesses the advanced analytical and data visualization capabilities of Looker to help grocers get a consolidated view of their business across all channels and then allow employees to slice and dice the data they way they need to. NCR Analytics also leverages the power of Google Cloud AI and machine learning to add another level of intelligence to the retailer’s data. For example, store managers can visualize how well they’re using their real estate and see how productive lanes 1-3 are compared with 7-10 or compare self-service versus manned lanes. By mapping to the retailer’s own catalog, they can also break down category-level performance and trends.

NCR Analytics takes advantage of Google Cloud’s data pipeline to reduce processing time, with scaling and resource management provided out of the box. By letting the cloud store and process the data, NCR is providing the ability for retailers to analyze their data in near real-time across all platforms – a real game changer in the grocery business.
Open APIs let grocers continually enrich the retail experience
Finally, Emerald is built on an API-first architecture managed through Apigee. It uses the power of Apigee as an open API platform to expose how Emerald can work with other NCR applications like loyalty and promotions, and third party applications like mobile ordering and order delivery to enrich the grocery experience for employees and customers. Every API that Emerald uses is available on Apigee, allowing them to share code samples and giving developers the ability to run scripts. This approach can allow retailers the ability to innovate in a fraction of the time and cost, speeding up 3rd party integrations up front and as businesses grow.
Take, for example, Northgate Market, a chain of 40 stores in California, that were able to transform its digital operations and enable experiences that set it apart from competitors – quickly and simply with Emerald. It took less than 6 months to go from contract to live deployment in the first store. Since then, Northgate Market has been able to extend their intelligence by leveraging the power of Looker and NCR Analytics.
Learn more about how NCR has been able to leverage an open, cloud-enabled architecture to help customers innovate across the retail, hospitality, and banking industries on the webinar “Role of APIs in Digital Transformation”. You can also learn more about how Northgate uses e-commerce to transform customer experience and gain consumer insights.
Google Cloud’s Virtual Appointment Scheduling Tool (VAST) Helps State of Arizona Recover from Unemployment Situation

6565
Of your peers have already read this article.
2:00 Minutes
The most insightful time you'll spend today!
When the world was forced to go primarily online, state governments also faced the reality of needing to provide community services without the health risk of meeting in person. Old systems that relied on interpersonal contact could not keep up. An unprecedented number of displaced workers swamped every unemployment system. The capacity challenges weren’t limited to state labor departments either. Everything from birth certificates and marriage licenses to apostilles and court system services that could usually be handled by a simple walk-in had to be scheduled in advance. Both internal and external communication suffered.
To meet these challenges, many organizations turned to new technology solutions and innovative approaches.
How VAST helped Arizona get back to work
The State of Arizona had tens of thousands of constituents who relied on pandemic unemployment insurance and would also need tools to reenter the workforce.Tim Tucker, Deputy Administrator of the Workforce Development Administration for the Arizona Department of Economic Security, started preparing in late 2020. He collaborated with Google Cloud and SADA to introduce the Virtual Appointment Scheduling Tool (VAST) to State of Arizona staff members. Using VAST reduced the excessive workload taken on by the Workforce Development Administration as they got Arizona back to work. VAST lets constituents book an appointment, upload documents and forms, and conduct career counseling virtually. This helped constituents move through the system faster so they could successfully reenter the workforce.
That preparation paid off. As of September 2021, Arizona had recovered the majority of the jobs lost during the pandemic. It has also seen one of the smallest percent change in employment compared with pre-pandemic numbers. Even more impressive, Arizona is one of only five states where unemployment claims are now lower than pre-pandemic numbers. Using VAST helped them get people back to work faster and has become a permanent part of their unemployment program.
Bringing streamlined services to the community
To fully realize a solution to the challenges faced by our public sector customers, we focused on three key areas in which we knew we needed VAST to excel:
- Efficient staff allocation
- Streamlined internal meetings
- Confident constituent interactions
We also knew our customers needed to get VAST online fast, and it needed to work with existing infrastructure without requiring a total overhaul. These areas informed the design of VAST’s features and have allowed us to meet the challenges faced by agencies such as the Arizona Department of Economic Security.
Virtual Agent support and integrations
VAST gives constituents 24×7 virtual agent support powered by Google Cloud’s contact center AI virtual agents. Virtual agents are custom programmed to fit the specific needs of each agency and community they serve. It’s easy to add new options and information whenever an update is needed. Virtual agents can be designed to understand the user’s intent and serve up relevant content for a smooth user experience on both ends of the system. Virtual agents run at scale and offer multi-language support, ensuring they can serve everyone in the community. By pairing these with VAST, constituents can experience seamless self-service.
6 week deployment time
Most of our public sector clients needed a solution yesterday. VAST can be deployed rapidly, taking about six weeks from start to finish, which includes everything–even staff training time.
Integration with Google Workspace and Chrome
VAST securely integrates with other Google solutions, such as Google Workspace and Chromebooks. We work to ensure VAST is fully functional within your existing systems.
Collaboration and support
SADA collaborates with each organization to ensure that the design, development, and functionality of VAST align with their needs. SADA specializes in helping public sector customers migrate to Google Cloud.
Analytics
Application administrators have access to analytic data gathered by VAST and options to customize and add additional datasets.This data helps organizations find blind spots in coverage, fix service bottlenecks, and better organize internal resources. Leveraging this data gives organizations the power to make changes, resulting in everything from a smoother customer experience to cost savings.
To learn more about how Google Cloud has supported Arizona during the pandemic, check out this blog on how their vaccination distribution system leveraged Google Cloud to get the vaccine to more people. For more information on how VAST can streamline a customer experience.
Recommendations for Modelling SAP Data inside BigQuery

8449
Of your peers have already read this article.
4:00 Minutes
The most insightful time you'll spend today!
Over the past few years, many organizations have experienced the benefits of migrating their SAP solutions to Google Cloud. But this migration can do more than reduce IT maintenance costs and make data more secure. By leveraging BigQuery, SAP customers can complement their SAP investments and gain fresh insights by consolidating enterprise data and easily extending it with powerful datasets and machine learning from Google.
BigQuery is a leading cloud data warehouse, fully managed and serverless, and allows for massive scale, supporting petabyte-scale queries at super-fast speeds. It can easily combine SAP data with additional data sources, such as Google Analytics or Salesforce, and its built-in machine learning lets users operationalize machine learning models using standard SQL — all at a comparatively low cost.
If your SAP-powered organization is looking to supercharge its analytics with the strength of BigQuery, read on for considerations and recommendations for modeling with SAP data. These guidelines are based on our real-world implementation experience with customers and can serve as a roadmap to the analytics capabilities your business needs.
Considerations for data replication
Like most technology journeys, this one should start with a business objective. Keeping your intended business value and goals in mind is critical to making the right decisions in the early steps of the design process.
When it comes to replicating the data from an SAP system into BigQuery, there are multiple ways to do it successfully. Decide which method will work best for your organization by answering these questions:
- Does your business need real-time data? Will you need to time travel into past data?
- Which external datasets will you need to join with the replicated data?
- Are the source structures or business logic likely to change? Will you be migrating the SAP source systems any time soon? For instance, will you be moving from SAP ECC to SAP S/4HANA?
You’ll also need to determine whether replication should be done on a table-by-table basis or whether your team can source from pre-built logic. This decision, along with other considerations such as licensing, will influence which replication tool you should use.
Replicating on a table-by-table basis
Replicating tables, especially standard tables in their raw form, allows sources to be reused and ensures more stability of the source structure and functional output. For example, the SAP table for sales order headers (VBAK) is very unlikely to change its structure across different versions of SAP, and the logic that writes to it is also unlikely to change in a way that affects a replicated table.
Something else to consider: Reconciliation between the source system and the landing table in BigQuery is linear when comparing raw tables, which helps avoid issues in consolidation exercises during critical business processes, such as period-end closing. Since replicated tables aren’t aggregated or subject to process-specific data transformation, the same replicated columns can be reused in different BigQuery views. You can, for instance, replicate the MARA table (the material master) once and use it in as many models as needed.
Replicating pre-built logic
If you replicate pre-built models, such as those from SAP extractors or CDS views, you don’t need to build the logic in BigQuery, since you’re using existing logic. Some of these extraction objects have embedded delta mechanisms, which may complement a replication tool that can’t handle deltas. This will save initial development time, but it can also lead to challenges if you create new columns, or if customizations or upgrades change the logic behind the extraction.
It’s also important to note that different extraction processes may transform and load the same source columns multiple times, which creates redundancy in BigQuery and can lead to higher maintenance needs and costs. However, replicating pre-built models may still be a good choice, since doing so can be especially useful for logic that tends to be immutable, such as flattening a hierarchy, or logic that is highly complex.
How you approach replication will also depend on your long-term plans and other key factors — for example, the availability (and curiosity) of your developers, and the time or effort they can put into applying their SQL knowledge to a new data warehouse.
With either replication approach, bear in mind when designing your replication process that BigQuery is meant to be an append-always database — so post-processing of data and changes will be required in both cases.
Processing data changes
The replication tool you choose will also determine how data changes are captured (known as CDC – change data capture). If the replication tool allows for it (for example as SAP SLT does) the same patterns described in the CDC with BigQuery documentation also apply to SAP data.
Because some data, like transactions, are known to be less static than others (e.g., master data), you need to decide what should be scanned in real time, what will require immediate consistency, and what can be processed in batches to manage costs. This decision will be based on the reporting needs from the business.
Consider the SAP table BUT000, containing our example master data for business partners, where we have replicated changes from an SAP ERP system:
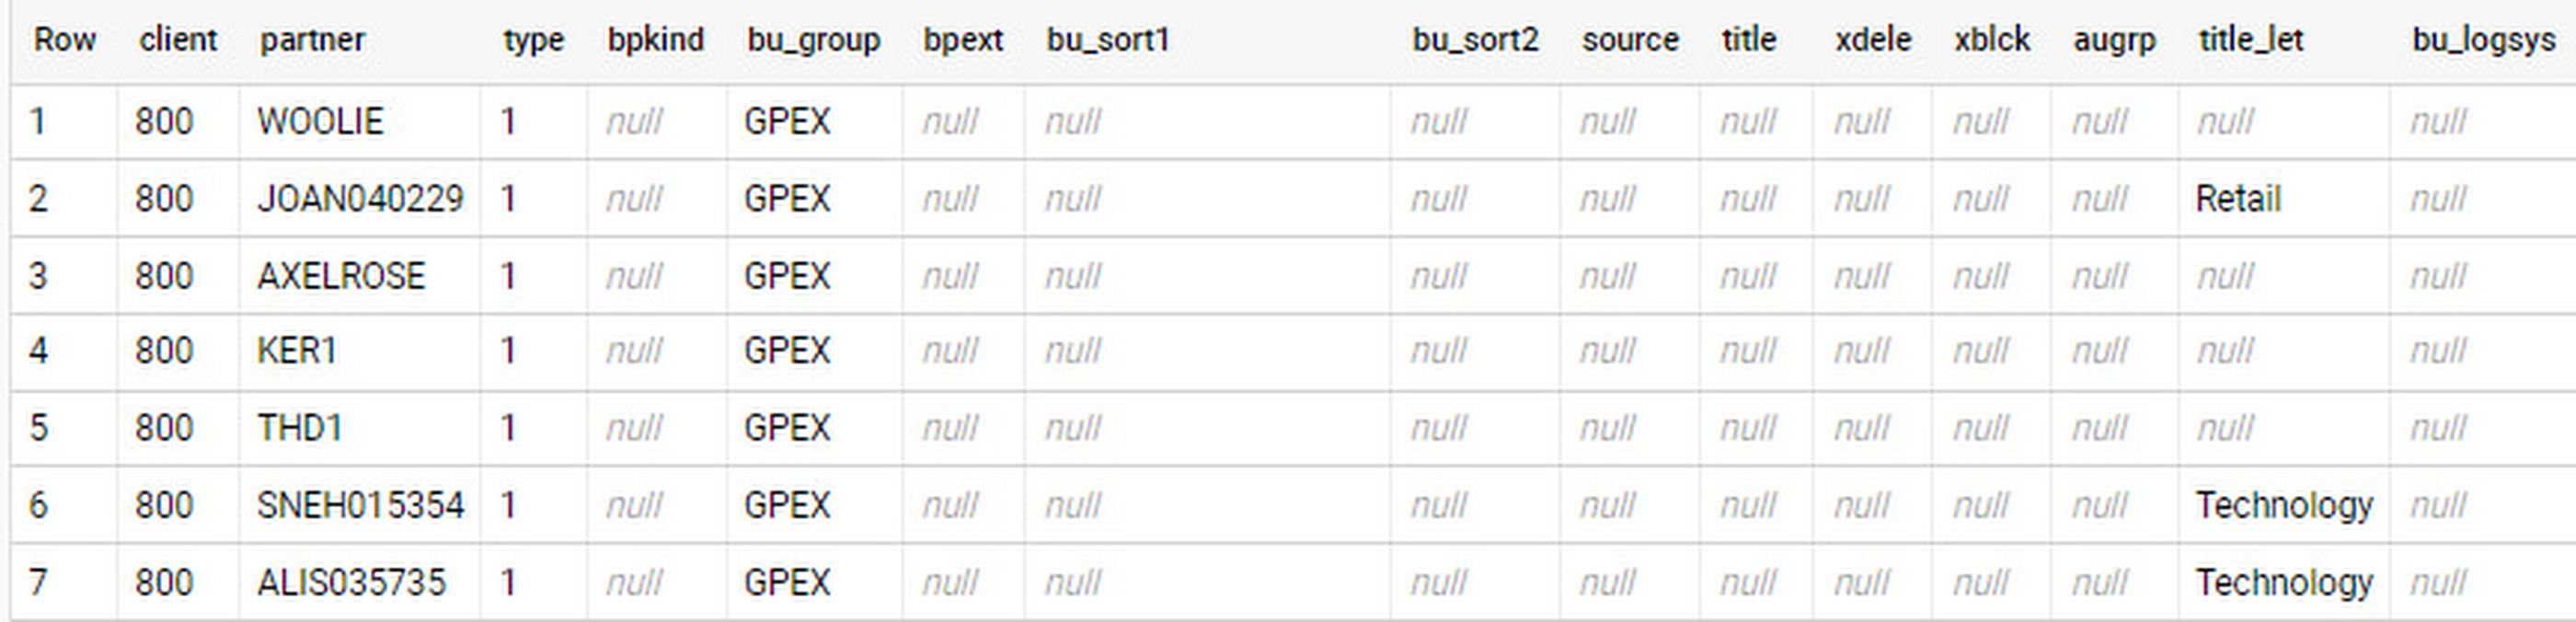
In an append-always replication in BigQuery, all updates are received as new records. For example, deleting a record in the source will be represented as a new record in BigQuery with a deletion flag. This applies to whether the records are coming from raw tables like BUT000 itself or pre-aggregated data, as from a BW extractor or a CDS view.
Let’s take a closer look at data coming particularly from the partners “LUCIA” and “RIZ”. The operation flag tells us whether the new record in BigQuery is an insert (I), update (U) or deletion (D), while the timestamps help us identify the latest version of our business partner.
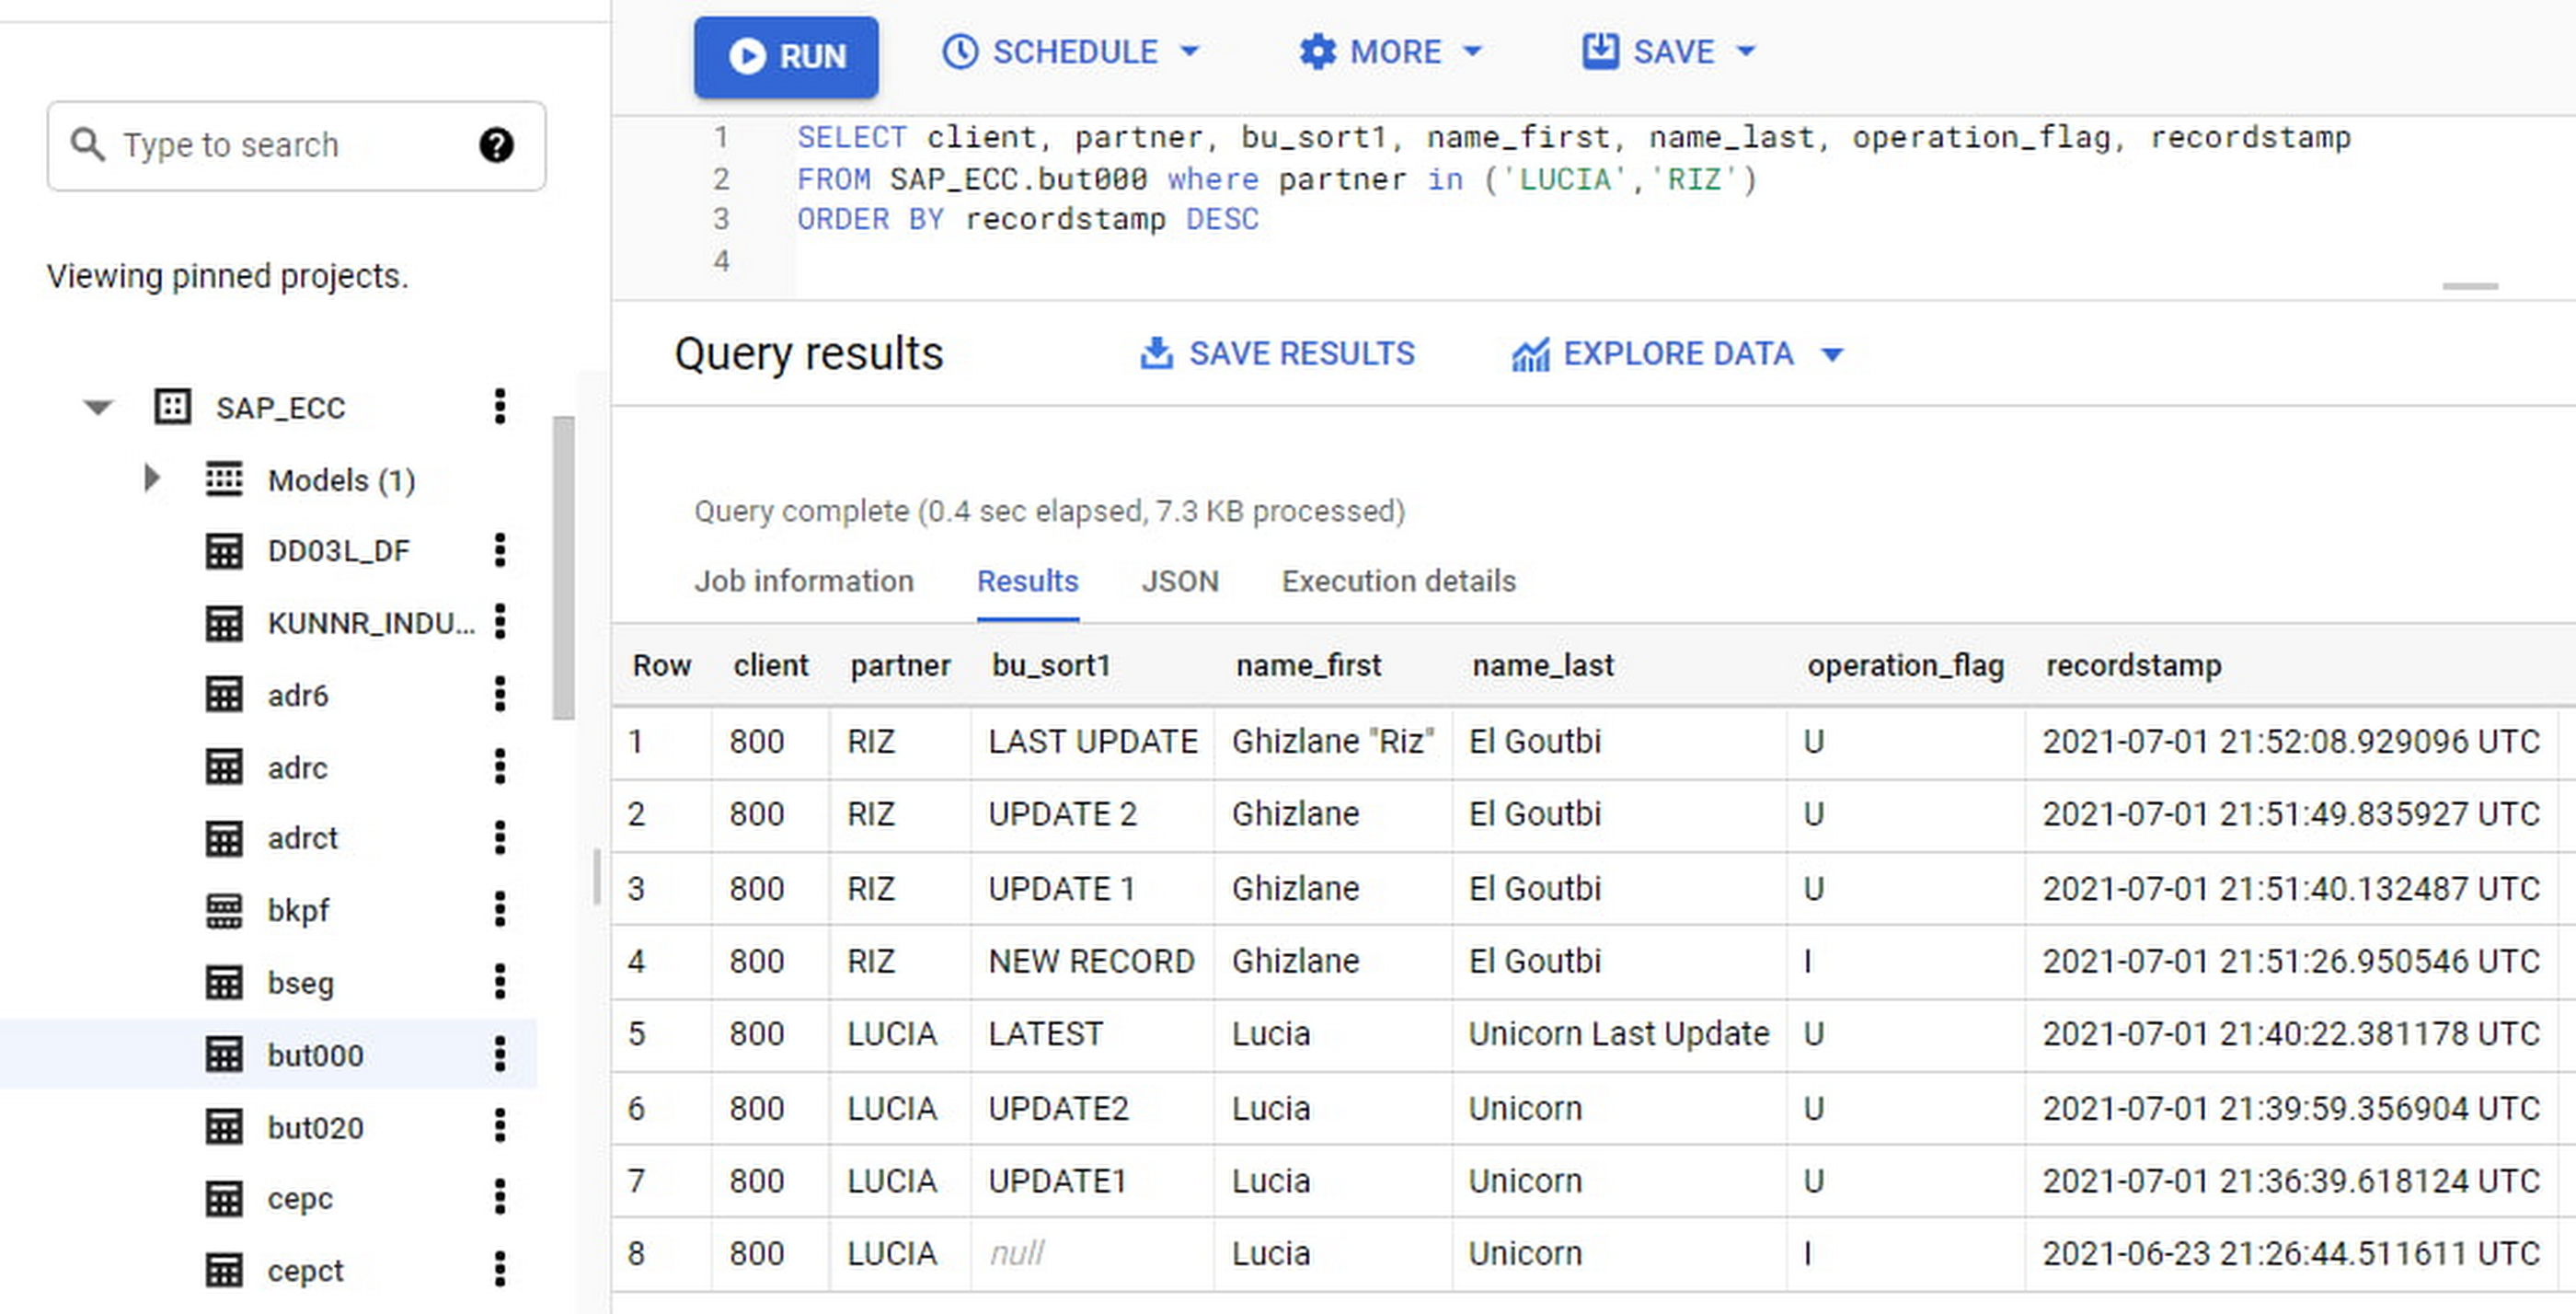
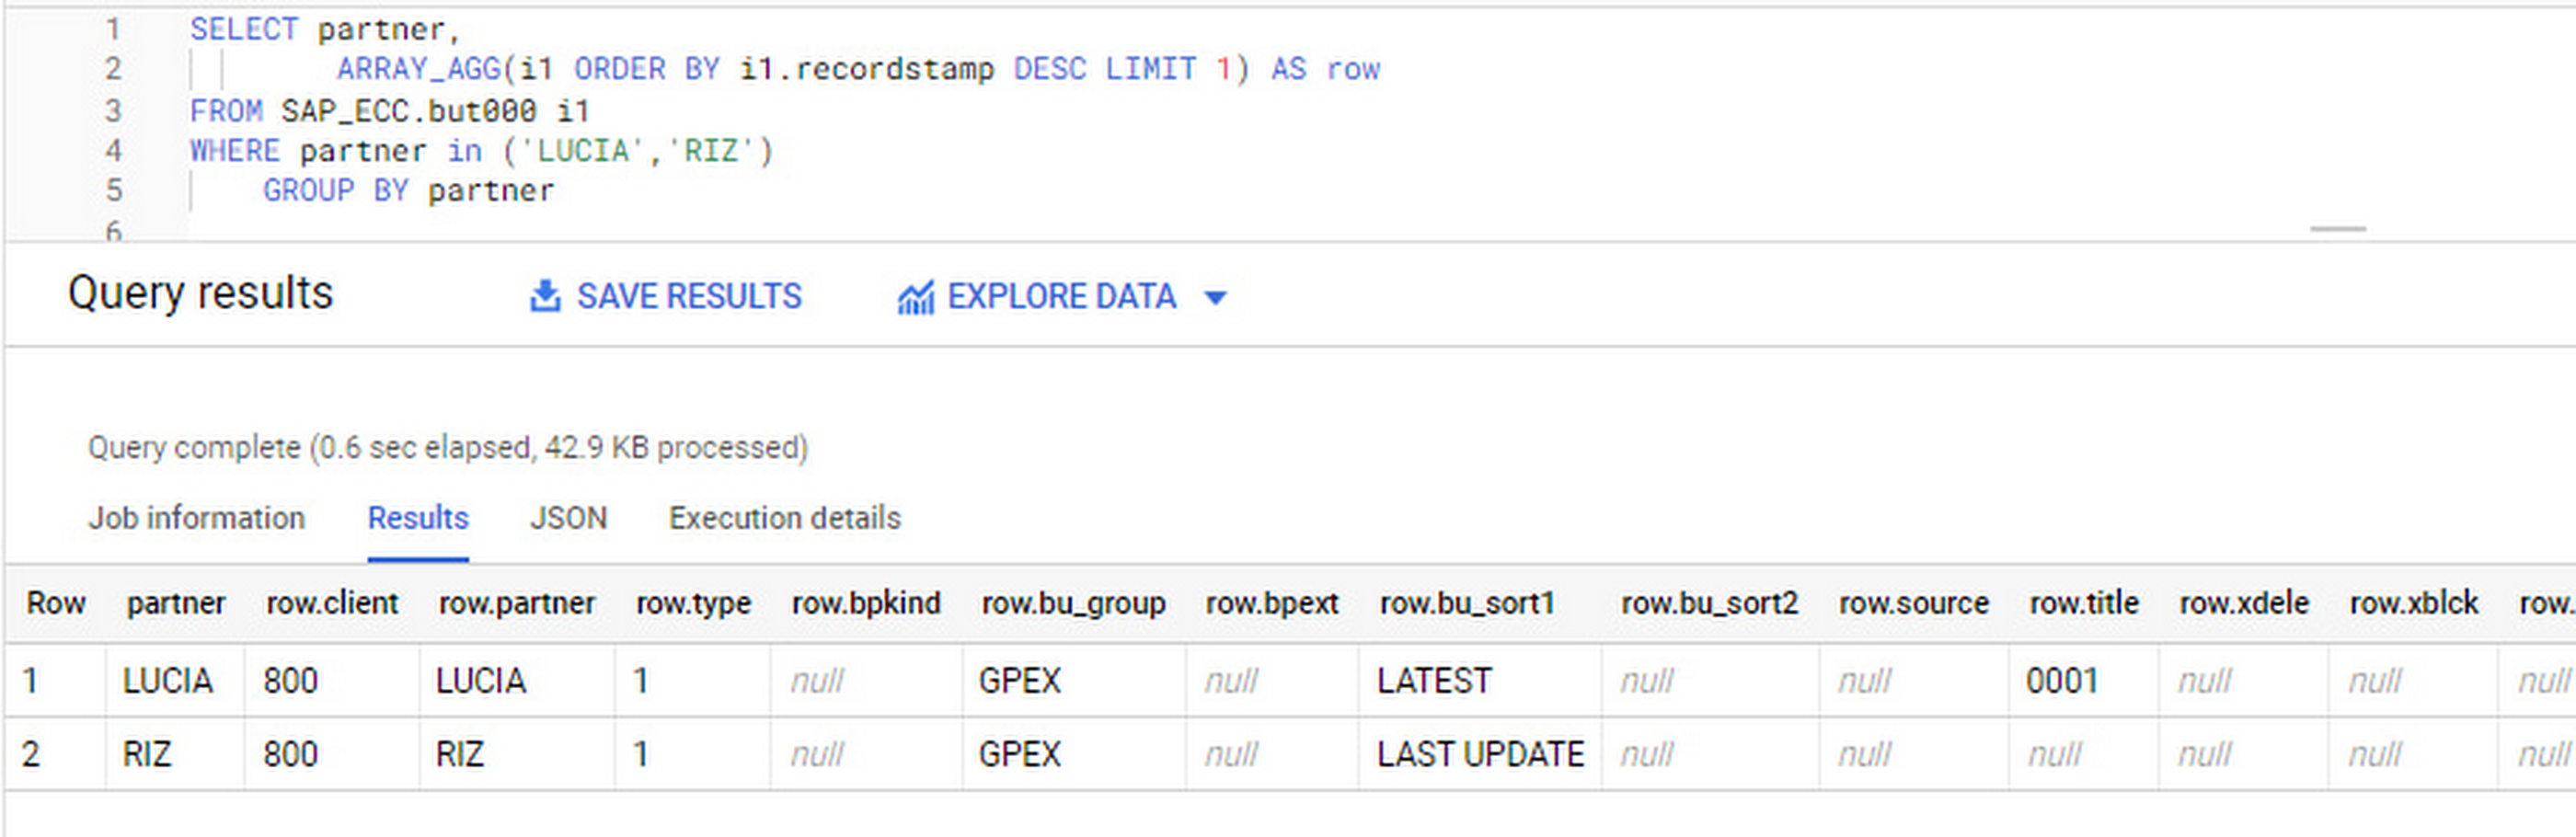
If we want to find the latest updated record for the partners LUCIA and RIZ, this is what the query would look like:
SELECT partner,ARRAY_AGG(i1 ORDER BY i1.recordstamp DESC LIMIT 1) AS rowFROM SAP_ECC.but000 i1WHERE partner in ('LUCIA','RIZ')GROUP BY partner
With the following result:
After identifying stale records for “LUCIA” and “RIZ” business partners, we can proceed to deleting all stale records for “LUCIA” if we do not want to retain the history. In this example, we are using a different table to which the same replication has been done, for the purpose of comparison and to check that all stale records have been deleted for the selection made and that we only kept last updated records. For example:
DELETE SAP_HANA.but000 i1WHEREi1.recordstamp < TIMESTAMP_SUB(CURRENT_TIMESTAMP(), INTERVAL 3 HOUR) ANDi1.recordstamp < (SELECT MAX(recordstamp) FROM SAP_HANA.but000 i2WHEREi1.partner = i2.partnerand partner="LUCIA")
You can also use the following query to retrieve stale records for “LUCIA” partner before moving forward with deletion
SELECT partner, operation_flag, recordstamp FROM SAP_HANA.but000 i1WHEREi1.recordstamp < TIMESTAMP_SUB(CURRENT_TIMESTAMP(), INTERVAL 3 HOUR)ANDi1.recordstamp < (SELECT MAX(recordstamp) FROM SAP_HANA.but000 i2WHEREi1.partner = i2.partnerand partner="LUCIA")
Which produces all of the records, except the latest update:

Partitioning and clustering
To limit the number of records scanned in a query, save on cost and achieve the best performance possible, you’ll need to take two important steps: determine partitions and create clusters.
Partitioning
A partitioned table is one that’s divided into segments, called partitions, which make it easier to manage and query your data. Dividing a large table into smaller partitions improves query performance and controls costs because it reduces the number of bytes read by a query.
You can partition BigQuery tables by:
- Time-unit column: Tables are partitioned based on a “timestamp,” “date,” or “datetime” column in the table.
- Ingestion time: Tables are partitioned based on the timestamp recorded when BigQuery ingested the data.
- Integer range: Tables are partitioned based on an integer column.
Partitions are enabled when the table is created, as in the example below. A great tip is to always include the partition filter as shown on the left-hand side of the query.

Clustering
Clustering can be created on top of partitioned tables by applying the fields that are likely to be used for filtering. When you create a clustered table in BigQuery, the table data is automatically organized based on the contents of one or more of the columns in the table’s schema. The columns you specify are then used to colocate related data.
Clustering can improve the performance of certain query types — for example, queries that use filter clauses or that aggregate data. It makes a lot of sense to use them for large tables such as ACDOCA, the table for accounting documents in SAP S/4HANA. In this case, the timestamp could be used for partitioning, and common filtering fields such as the ledger, company code, and fiscal year could be used to define the clusters.
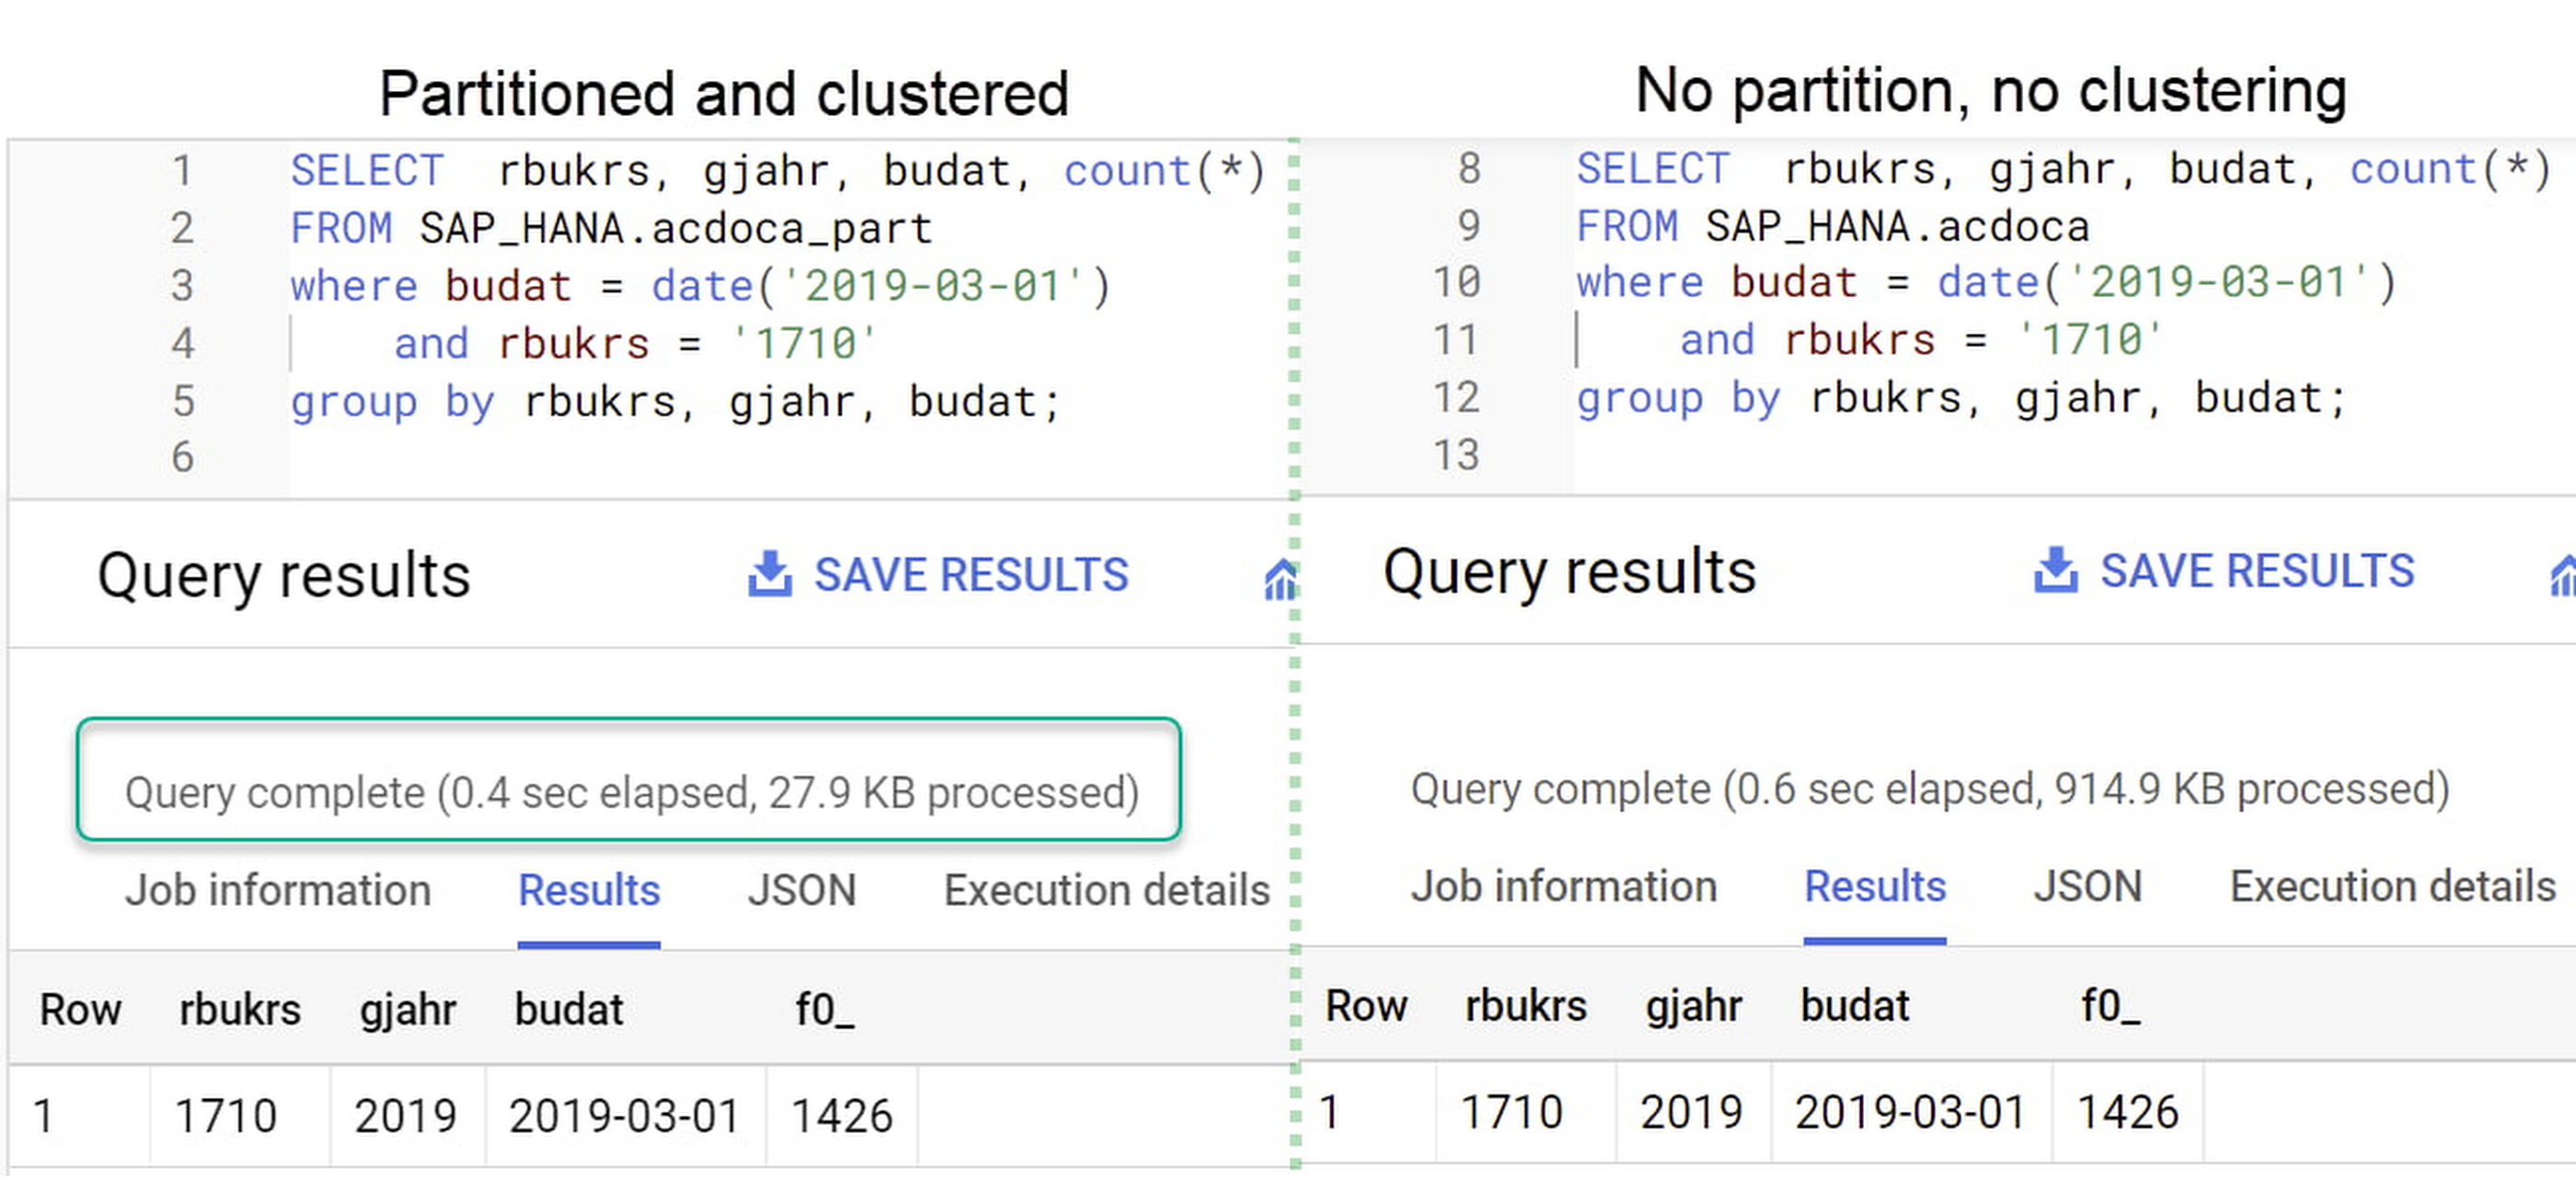
A great feature is that BigQuery will also periodically recluster the data automatically.
Materialized views
In BigQuery, materialized views are precomputed views that periodically cache the results of a query for better performance and efficiency. BigQuery uses precomputed results from materialized views and, whenever possible, reads only the delta changes from the base table to compute up-to-date results quickly. Materialized views can be queried directly or can be used by the BigQuery optimizer to process queries to the base table.
Queries that use materialized views are generally completed faster and consume fewer resources than queries that retrieve the same data only from the base table. If workload performance is an issue, materialized views can significantly improve the performance of workloads that have common and repeated queries. While materialized views currently only support single tables, they are very useful common and frequent aggregations like stock levels or order fulfillment.
Further tips on performance optimization while creating select statements can be found in the documentation for optimizing query computation.
Deployment pipeline and security
For most of the work you’ll do in BigQuery, you’ll normally have at least two delivery pipelines running — one for the actual objects in BigQuery and the other to keep the data staging, transforming, and updated as intended within the change-data-capture flows. Note that you can use most existing tools for your Continuous Integration / Continuous Deployment (CI/CD) pipeline — one of the benefits of using an open system like BigQuery. But, if your organization is new to CI/CD pipelines, this is a great opportunity to gradually gain experience. A good place to start is to read our guide for setting up a CI/CD pipeline for your data-processing workflow.
When it comes to access and security, most end-users will only have access to the final version of the BigQuery views. While row and column-level security can be applied, as in the SAP source system, separation of concerns can be taken to the next level by splitting your data across different Google Cloud projects and BigQuery datasets. While it’s easy to replicate data and structures across your datasets, it’s a good idea to define the requirements and naming conventions early in the design process so you set it up properly from the start.
Start driving faster and more insightful analytics
The best piece of advice we can give you is this: Try it yourself. Anyone with SQL knowledge can get started using the free BigQuery tier. New customers get $300 in free credits to spend on Google Cloud during the first 90 days. All customers get 10 GB storage and up to 1 TB queries/month, completely free of charge. In addition to discovering the massive processing capabilities, embedded machine learning, multiple integration tools, and cost benefits, you’ll soon discover how BigQuery can simplify your analytics tasks.
If you need additional assistance, our Google Cloud Professional Services Organization (PSO) and Customer Engineers will be happy to help show you the best path forward for your organization. For anything else, contact us at cloud.google.com/contact.
Analytics Hub for Secure Data Sharing and Analytics Unlocks True Data Value and Insights

6763
Of your peers have already read this article.
2:30 Minutes
The most insightful time you'll spend today!
Customers tell us that sharing and exchanging data with other organizations is a critical element of their analytics strategy, but it’s hamstrung by unreliable data and processes, and only getting harder with security threats and privacy regulations on the rise.
Furthermore, traditional data sharing techniques use batch data pipelines that are expensive to run, create late arriving data, and can break with any changes to the source data. They also create multiple copies of data, which brings unnecessary costs and can bypass data governance processes. These techniques do not offer features for data monetization, such as managing subscriptions and entitlements. Altogether, these challenges mean that organizations are unable to realize the full potential of transforming their business with shared data.
To address these limitations, we are introducing Analytics Hub, a new fully managed service, available in Q3, in preview, that helps you unlock the value of data sharing, leading to new insights and increased business value. With Analytics Hub you get:
- A rich data ecosystem by publishing and subscribing to analytics-ready datasets.
- Control and monitoring over how your data is being used, because data is shared in one place.
- A self-service way to access valuable and trusted data assets, including data provided by Google. For example, a unique dataset from Google Search Trends will be available, that you can query and combine with your own data.
- An easy way to monetize your data assets without the overhead of building and managing the infrastructure.
Built on a decade of cross-organizational sharing
While Analytics Hub is a new service, it builds on BigQuery, Google’s petabyte-scale, serverless cloud data warehouse. BigQuery’s unique architecture provides separation between compute and storage, enabling data publishers to share data with as many subscribers as you want without having to make multiple copies of your data. With BigQuery, there are no servers to deploy or manage, which means that data consumers get immediate value from shared data. Data can be provided and consumed in real-time using the streaming capabilities of BigQuery and you can leverage the built in machine learning, geospatial, and natural language capabilities of BigQuery or take advantage of the native business intelligence support with tools like Looker, Google Sheets, and Data Studio.
BigQuery has had cross-organizational, in-place data sharing capabilities since it was introduced in 2010. We took a look at usage metrics in BigQuery and found that over a 7 day period in April, we had over 3,000 different organizations sharing over 200 petabytes of data. These numbers don’t include data sharing between departments within the same organization.
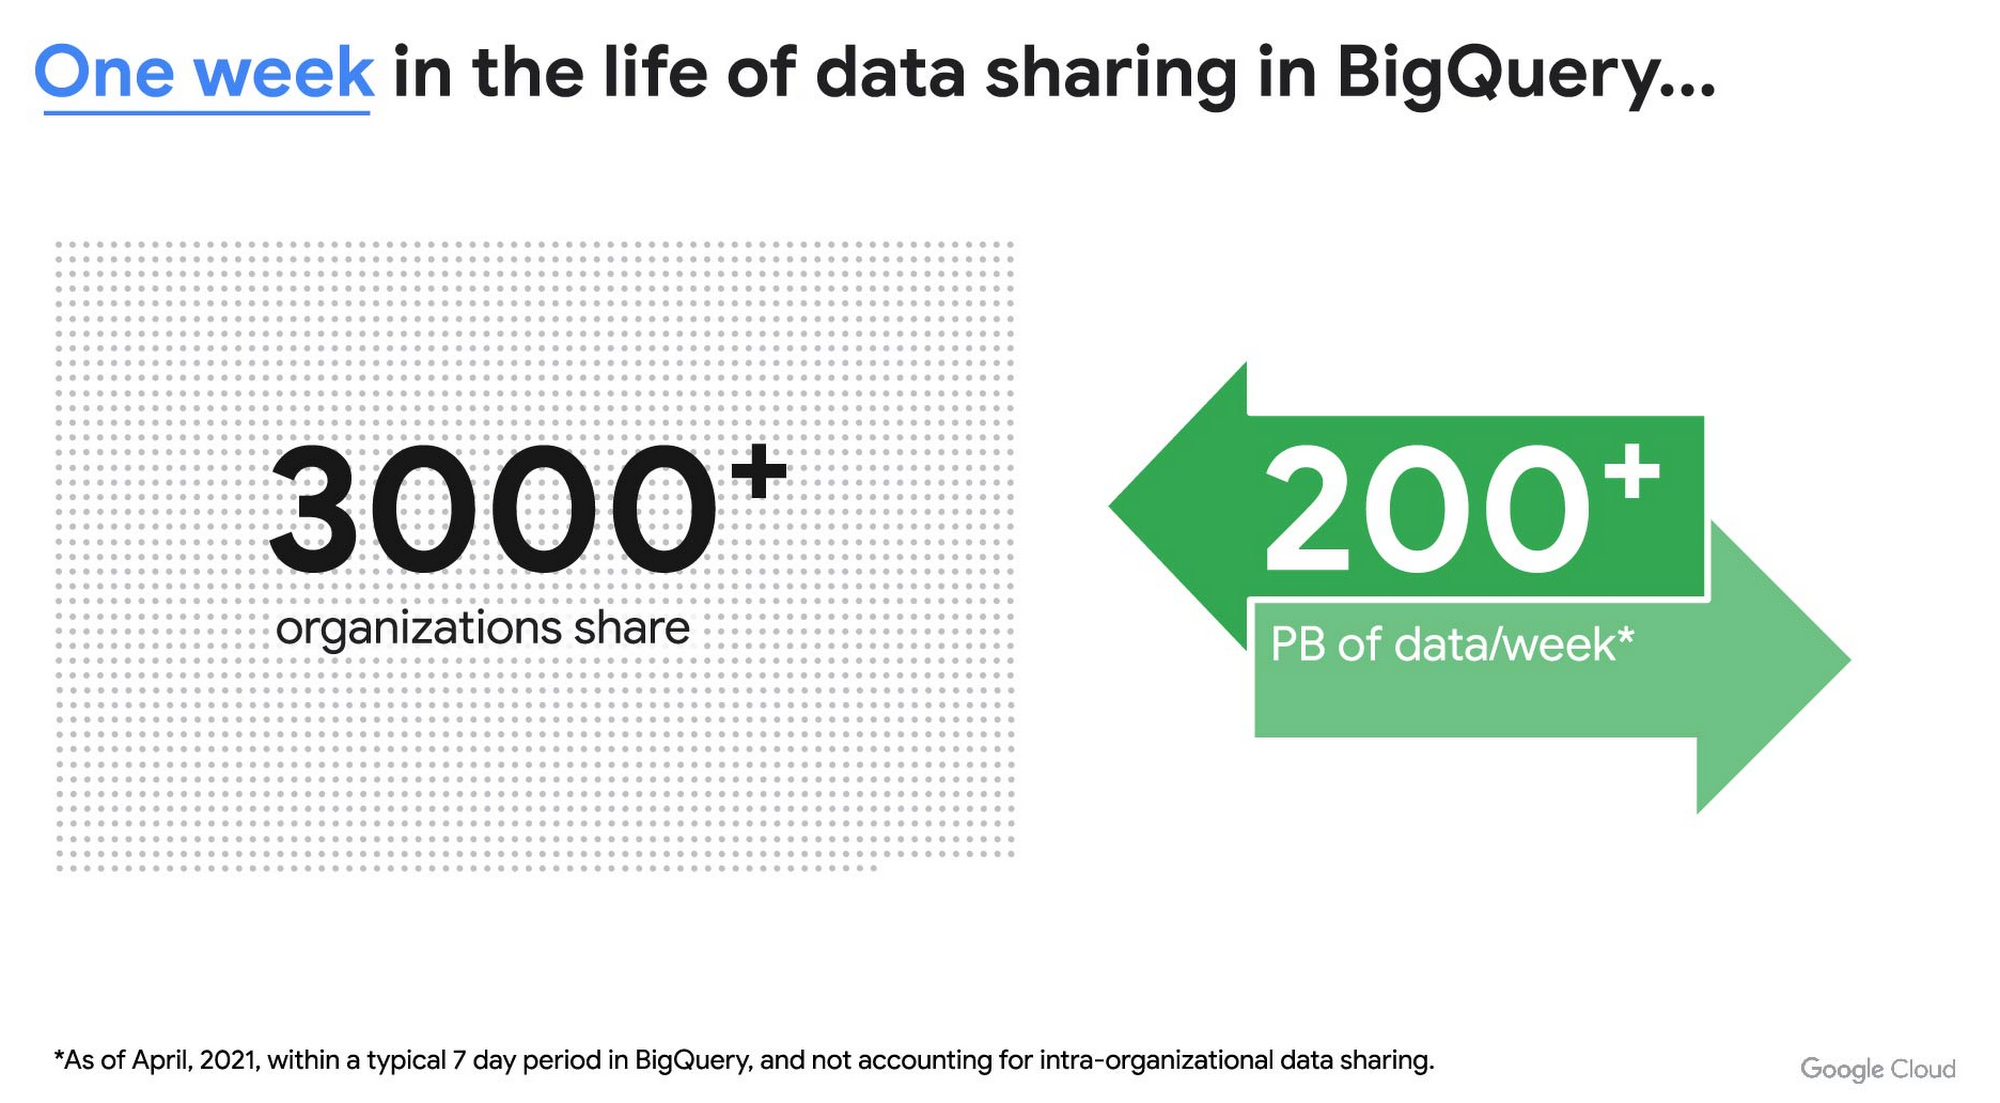
As you can see, data sharing in BigQuery is already popular. But we want to make it easier and even more scalable.
Raising the bar on data sharing
To make data sharing easier and more scalable in BigQuery, Analytics Hub introduces the concepts of shared datasets and exchanges. As a data publisher, you create shared datasets that contain the views of data that you want to deliver to your subscribers. Next, you create exchanges, which are used to organize and secure shared datasets. By default, exchanges are completely private, which means that only the users and groups that you give access to can view or subscribe to the data. You can also create internal exchanges or leverage public exchanges provided by Google. Finally, you publish shared datasets into an exchange to make them available to subscribers.
Data subscribers search through the datasets that are available across all exchanges for which they have access and subscribe to relevant datasets. This creates a linked dataset in their project that they can query and join with their own data. Subscribers pay for the queries that they run against the data while the publisher pays for the storage of the data. Data providers can add new data, new tables, or new columns to the shared dataset and these will be immediately available to subscribers. In addition, the publisher can track subscribers, disable subscriptions, and see aggregated usage information for the shared data.
Analytics Hub makes it easy for you to publish, discover, and subscribe to valuable datasets that you can combine with your own data to derive unique insights. Here are some types of data that will be available through Analytics Hub:
- Public datasets: Easy access to the existing repository of over 200 public datasets, including data about weather and climate, cryptocurrency, healthcare and life sciences, and transportation.
- Google datasets: Unique, freely-available datasets from Google. One example of this is the COVID-19 community mobility dataset. Another example is the forthcoming Google Trends dataset, which will provide the top 25 search terms and top 25 rising search terms over a 5 year window in 210 distinct locations in the US. Trends data can be used by everyone in the organization to gain insights into what customers care about.
- Commercial (paid for) datasets: We are working with leading commercial data providers to bring their data products to Analytics Hub. If you are interested in delivering your data via Analytics Hub, we’re also introducing Data Gravity, an initiative that provides storage benefits and new distribution paths for data published through Analytics Hub.
- Internal datasets: We know that data sharing can be challenging in larger organizations. Analytics Hub can be used for internal data, for example, to share standardized customer demographics with your sales engineering and data science teams.
Customers and partners using Analytics Hub

“Google Search Trends data has always been an important tool for our WPP agency data teams. At WPP we believe that data variety is a superpower which is why we are excited to use the new Trends dataset availability within BigQuery, plus the launch of Analytics Hub. The best creativity in the world is informed by data insights, and influenced by what people search for, so the operational efficiencies we’ll gain via the Analytics Hub and the insights we can drive with Trends data are just phenomenal.”
—Di Mayze Global Head of Data and AI, WPP

“Equifax Ignite is our shared data analytics environment within our Equifax data fabric. We are excited to partner with Google to leverage Analytics Hub and BigQuery to deliver data to over 400 statisticians and data modelers as well as securely sharing data with our partner financial institutions.”
—Kumar Menon, SVP Data Fabric and Decision Science, Equifax

“The flow of data and insights between our teams at Deloitte and our clients is paramount for building truly transformational data cultures. With its purpose-built architecture for secure data exchanges and sharing analytics resources, Google Cloud’s Analytics Hub can help provide significant operational efficiencies for how Deloitte teams support our clients’ data-driven initiatives within their industry ecosystems. It will also help minimize the worries about scale, privacy and security, or the administrative burden associated with each.”
—Navin Warerkar, Managing Director, Deloitte Consulting LLP, and US Google Cloud Data & Analytics GTM Lead

“Crux Informatics is proud to partner with Google to support the launch of Analytics Hub, removing friction for those who need access to analytics-ready data. With thousands of datasets from over 140 sources, Crux Informatics will accelerate access to data on Analytics Hub and together provide a more efficient and cost effective solution to deliver datasets in Google Cloud’s ecosystem.”
—Will Freiberg, CEO, Crux Informatics
Next steps for Analytics Hub
This is just the beginning for Analytics Hub. As we get to preview and general availability, we will be adding additional capabilities, including workflows for publishing and subscribing, publishing analytics assets (Looker Blocks, Data Studio reports, Connected Google Sheets) along with the shared data, the ability for data publishers to specify query restrictions on the usage of their data, and making it easy for data publishers to create sandbox environments for subscribers to work with their data, even if they are not yet on Google Cloud. We will provide features in Analytics Hub for monetization of data, including managing subscriptions, data entitlements, and billing.
Please sign up for the preview, which is scheduled to be available in the third quarter of 2021. In the meantime, you can learn more about BigQuery and how to leverage its built-in data sharing capabilities. Please go to g.co/cloud/analytics-hub to register your interest in Analytics Hub.
Streamline Your Business Processes with Google Cloud’s Custom Document Splitter
937
Of your peers have already read this article.
3:30 Minutes
The most insightful time you'll spend today!
Businesses rely on processing an inflow of documents to drive processes and make decisions. Many such documents are combined into a single file. For example, a loan application may have a driver’s license, paystub, W2, bank statement, and other document types within a single file. The complexity of handling many document types within a single file makes it difficult for businesses to manage at scale.
At Google Cloud, we’re committed to solving these challenges with continued investment in our Document AI solutions suite which offers machine learning products for document processing and insights. Document AI Workbench helps users quickly build ML models with world-class accuracy, trained for their specific use cases. In February 2023, we launched the Custom Document Extractor (CDE) in General Availability (GA) to help users extract structured data from documents in production use cases. In March 2023, we launched the Custom Document Classifier (CDC) in GA to help automatically classify document types. Today, we announce the newest feature of Document AI Workbench, Custom Document Splitter (CDS) in GA to help users automatically split and classify multiple documents within a single file.
CDS provides tangible business value to customers by helping them sort and classify documents. For example, businesses can validate if they have all the needed documents from an applicant. Furthermore, individually classified documents enable businesses to better automate downstream processes, including selecting the proper storage, analysis, or processing steps based on the document type. The efficiencies enabled by CDS helps businesses lower their document processing time and cost.
Benefits of splitting and classification models in Document AI Workbench
Document AI Workbench can save time and money by simplifying model training, from dataset management, to testing, to deployment. CDS helps businesses achieve higher automation rates to scale processes while lowering costs.
Sean Earley, VP of Delivery Services at Zencore said, “We completed a project for a large bank using Document AI Workbench to split, classify, and extract data from documents to automate Home Mortgage Disclosure Act reporting. Given the accuracy of the models we built, our client estimated increasing loan reporting coverage from 20% to 100% while eliminating thousands of errors per year, drastically reducing the operational cost of the bank’s compliance reporting procedures.”
Fabian Beckmann, Manager Artificial Intelligence & Data at Deloitte Consulting GmbH said, “By leveraging Document AI’s Custom Document Splitter, our client, Commerzbank, a large european bank, can effortlessly segment customer submissions tailored to their back-office requirements, significantly diminishing the need for extra manual sorting or routing. This integration paves the way towards seamless automation within the Document AI pipeline, delivering substantial business benefits.“
According to Kaïs Albichari – ML Tribe Tech Lead, G Cloud at IT services firm Devoteam, “Custom Document Splitter (CDS) has helped one of our clients in the financial services industry save significant time and improve data accuracy. By identifying which parts of documents they can discard and which they retain for entity extraction, CDS has helped the company automate its document processing tasks. The implementation resulted in a more efficient and streamlined workflow, freeing employees to focus on other tasks. Devoteam’s G Cloud team helped the company implement CDS and achieve these benefits.”
Frank Neugebauer, a Google Cloud Insurance Solutions Consultant, worked with a Fortune 100 insurance company and used CDS to create a model to split and classify millions of insurance documents with up to 98% accuracy. With this information, the insurer can better understand the nature of their unstructured data to inform business strategy, including volume for specific document types to inform extraction work. The customer considers this level of insight unprecedented in their 200+ year history.
How to use Custom Document Splitter
You can leverage a simple interface in the Google Cloud Console and a set of public APIs to prepare training data, create and evaluate models, deploy a model into production, and call an API endpoint to split and classify document types. You can follow the documentation for instructions to create, train, evaluate, deploy, and run predictions with models.
Import and prepare training data
To get started, import and label documents to train and evaluate an ML model.
To quickly build a training dataset, import single documents, one document per file, and bulk label them with the relevant document type. You can import one folder or multiple folders at once and choose the correct document type per folder. As shown in the next image, one import could have a folder with 200 bank statements, another folder with 200 W2s, another folder with 200 paystubs, etc., all of which are labeled at once while imported. Up to 30,000 documents and 100,000 pages can be inputted for training. This way, you can build a training dataset with hundreds of labeled documents per class in minutes. As always, if documents are already labeled using other tools, simply import labels with JSON in the Document format.
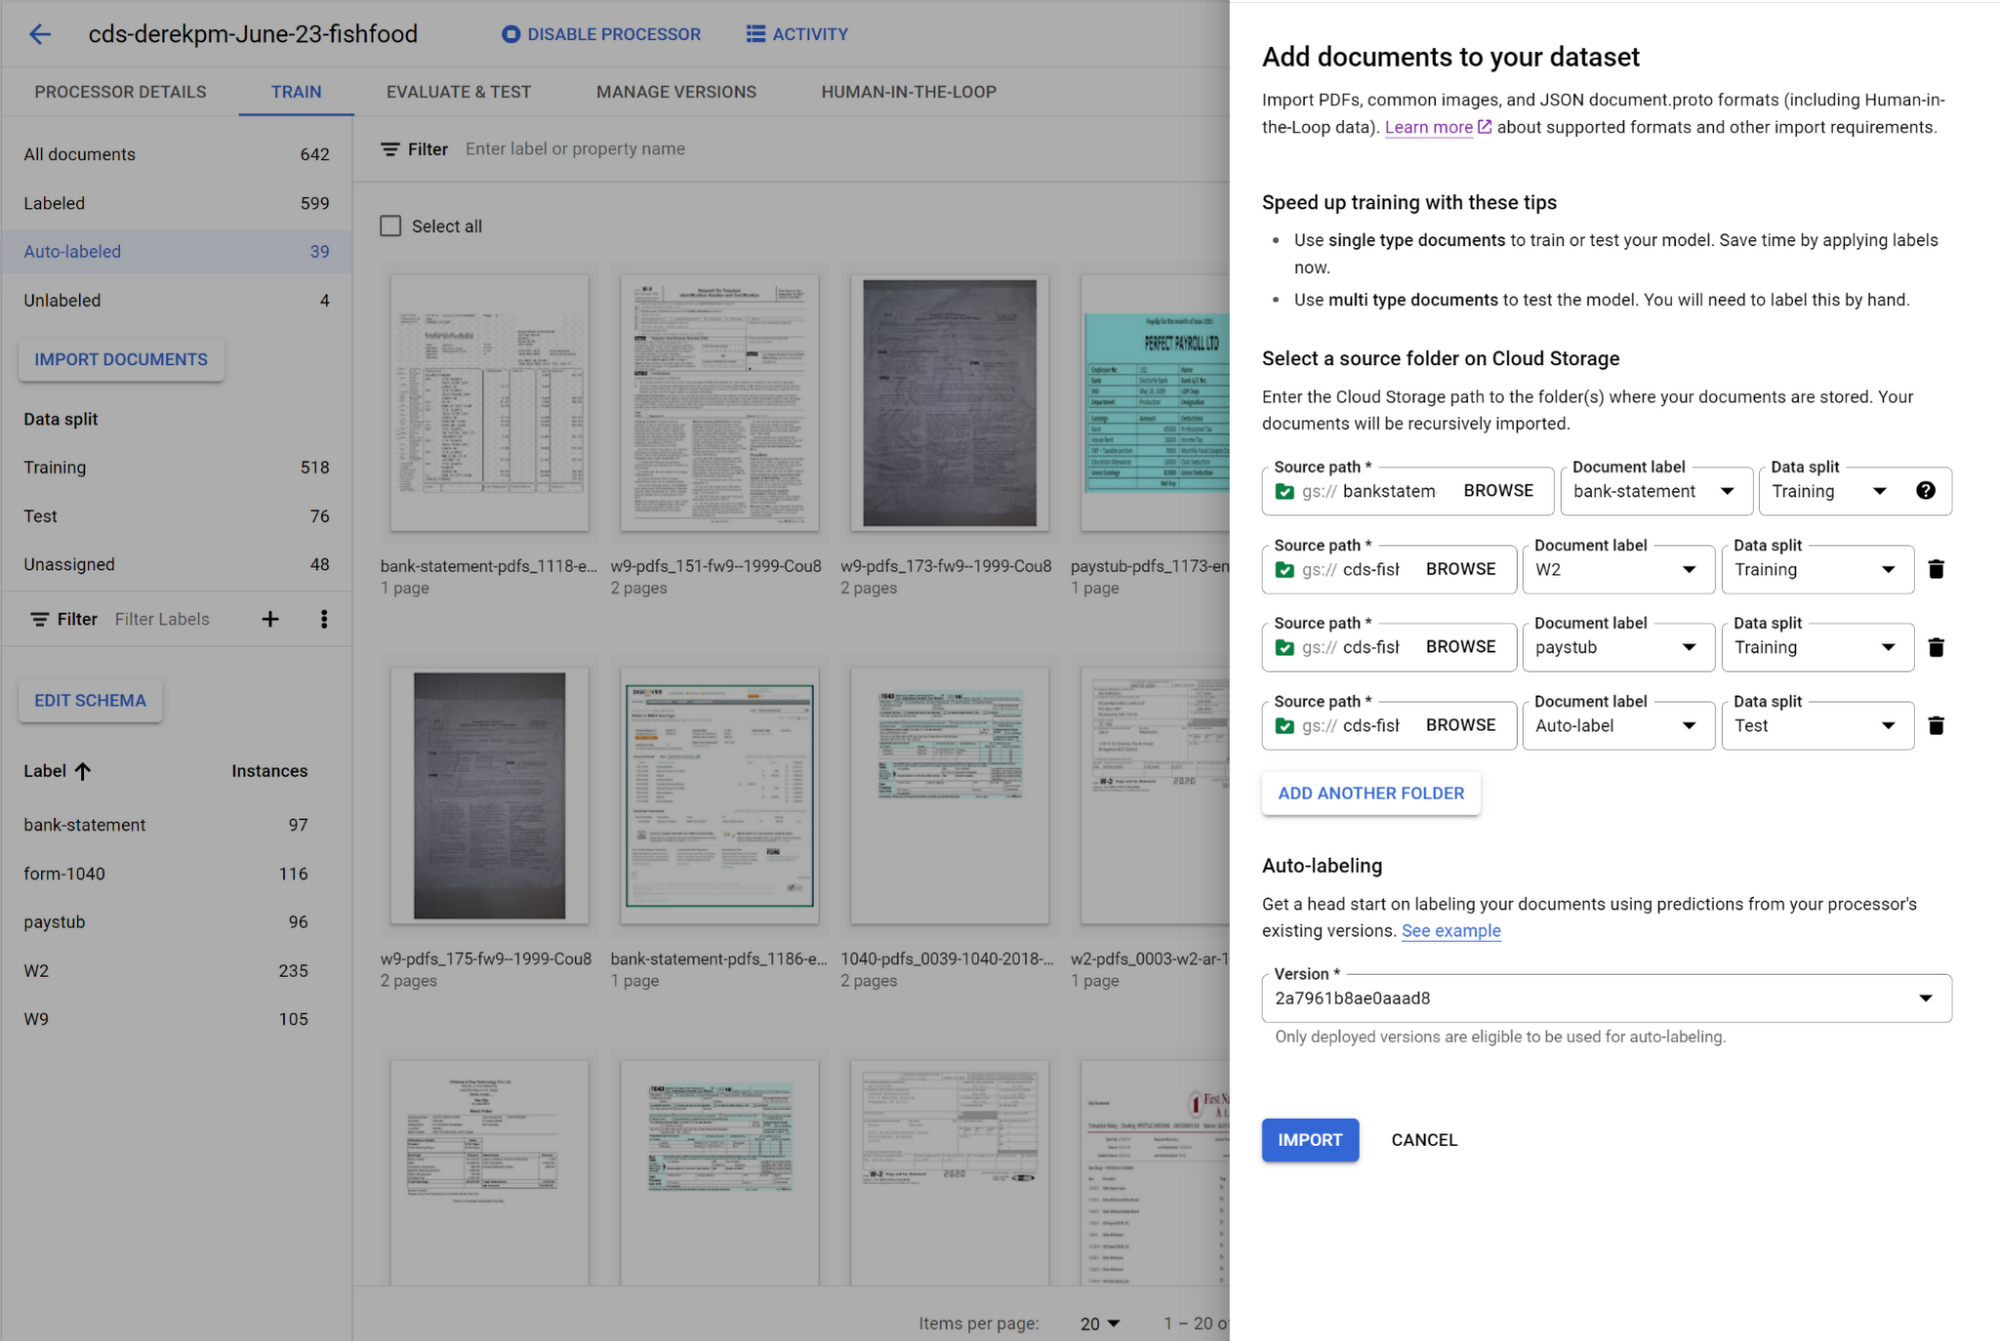
You can initiate training with a click of a button. Once you have trained a model, you can use it to automatically label documents added to your dataset, letting you quickly build robust test and training datasets to evaluate and improve model performance.
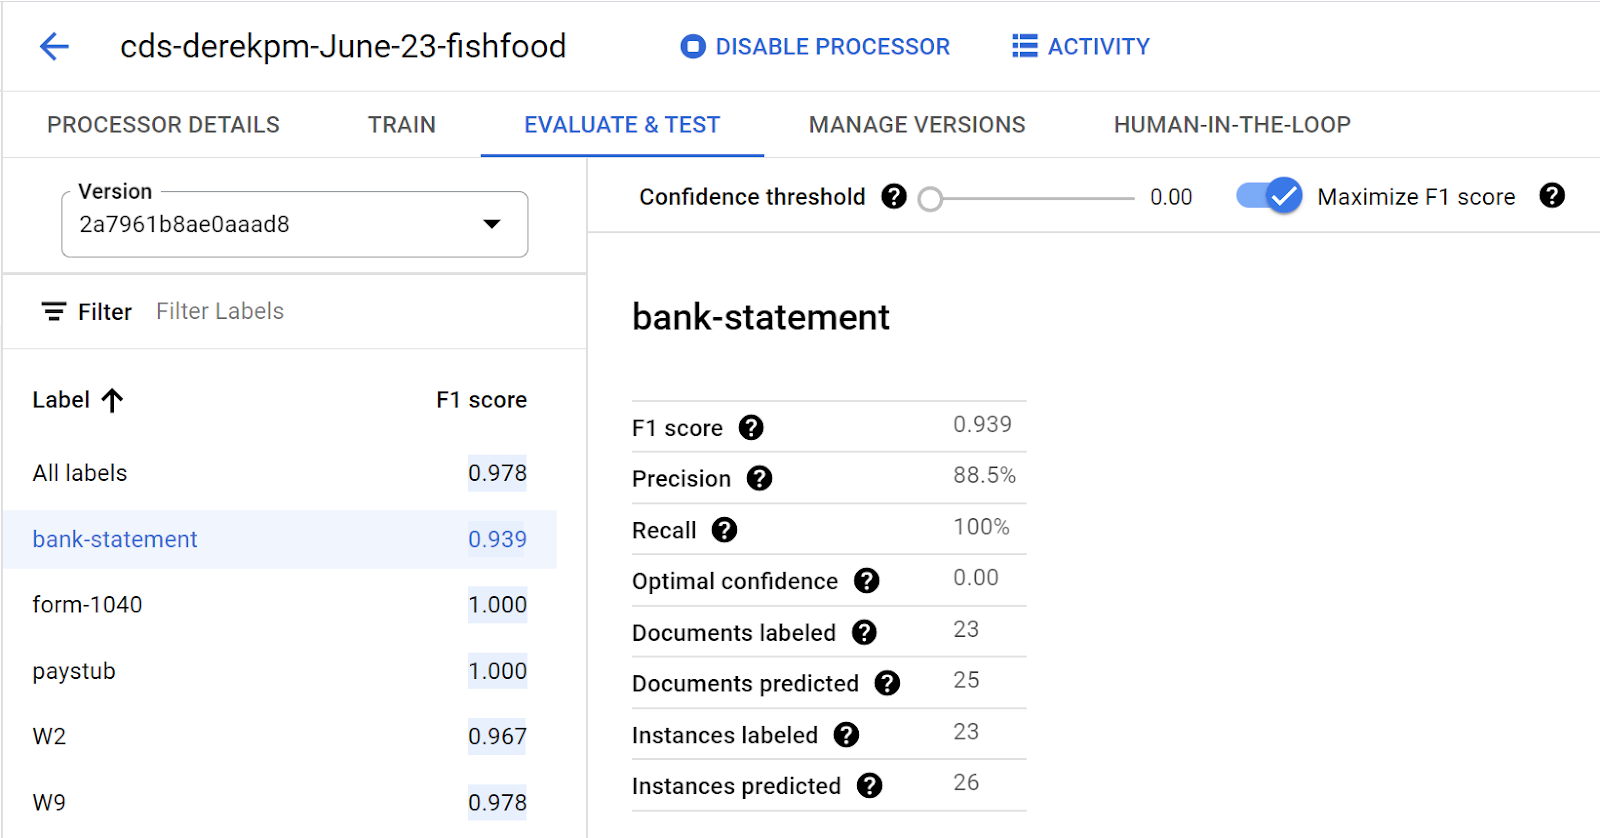
To accurately evaluate a CDS model, import files which contain multiple document types within the same file and assign them to the test dataset. Then, use a simple interface to define document boundaries and types.
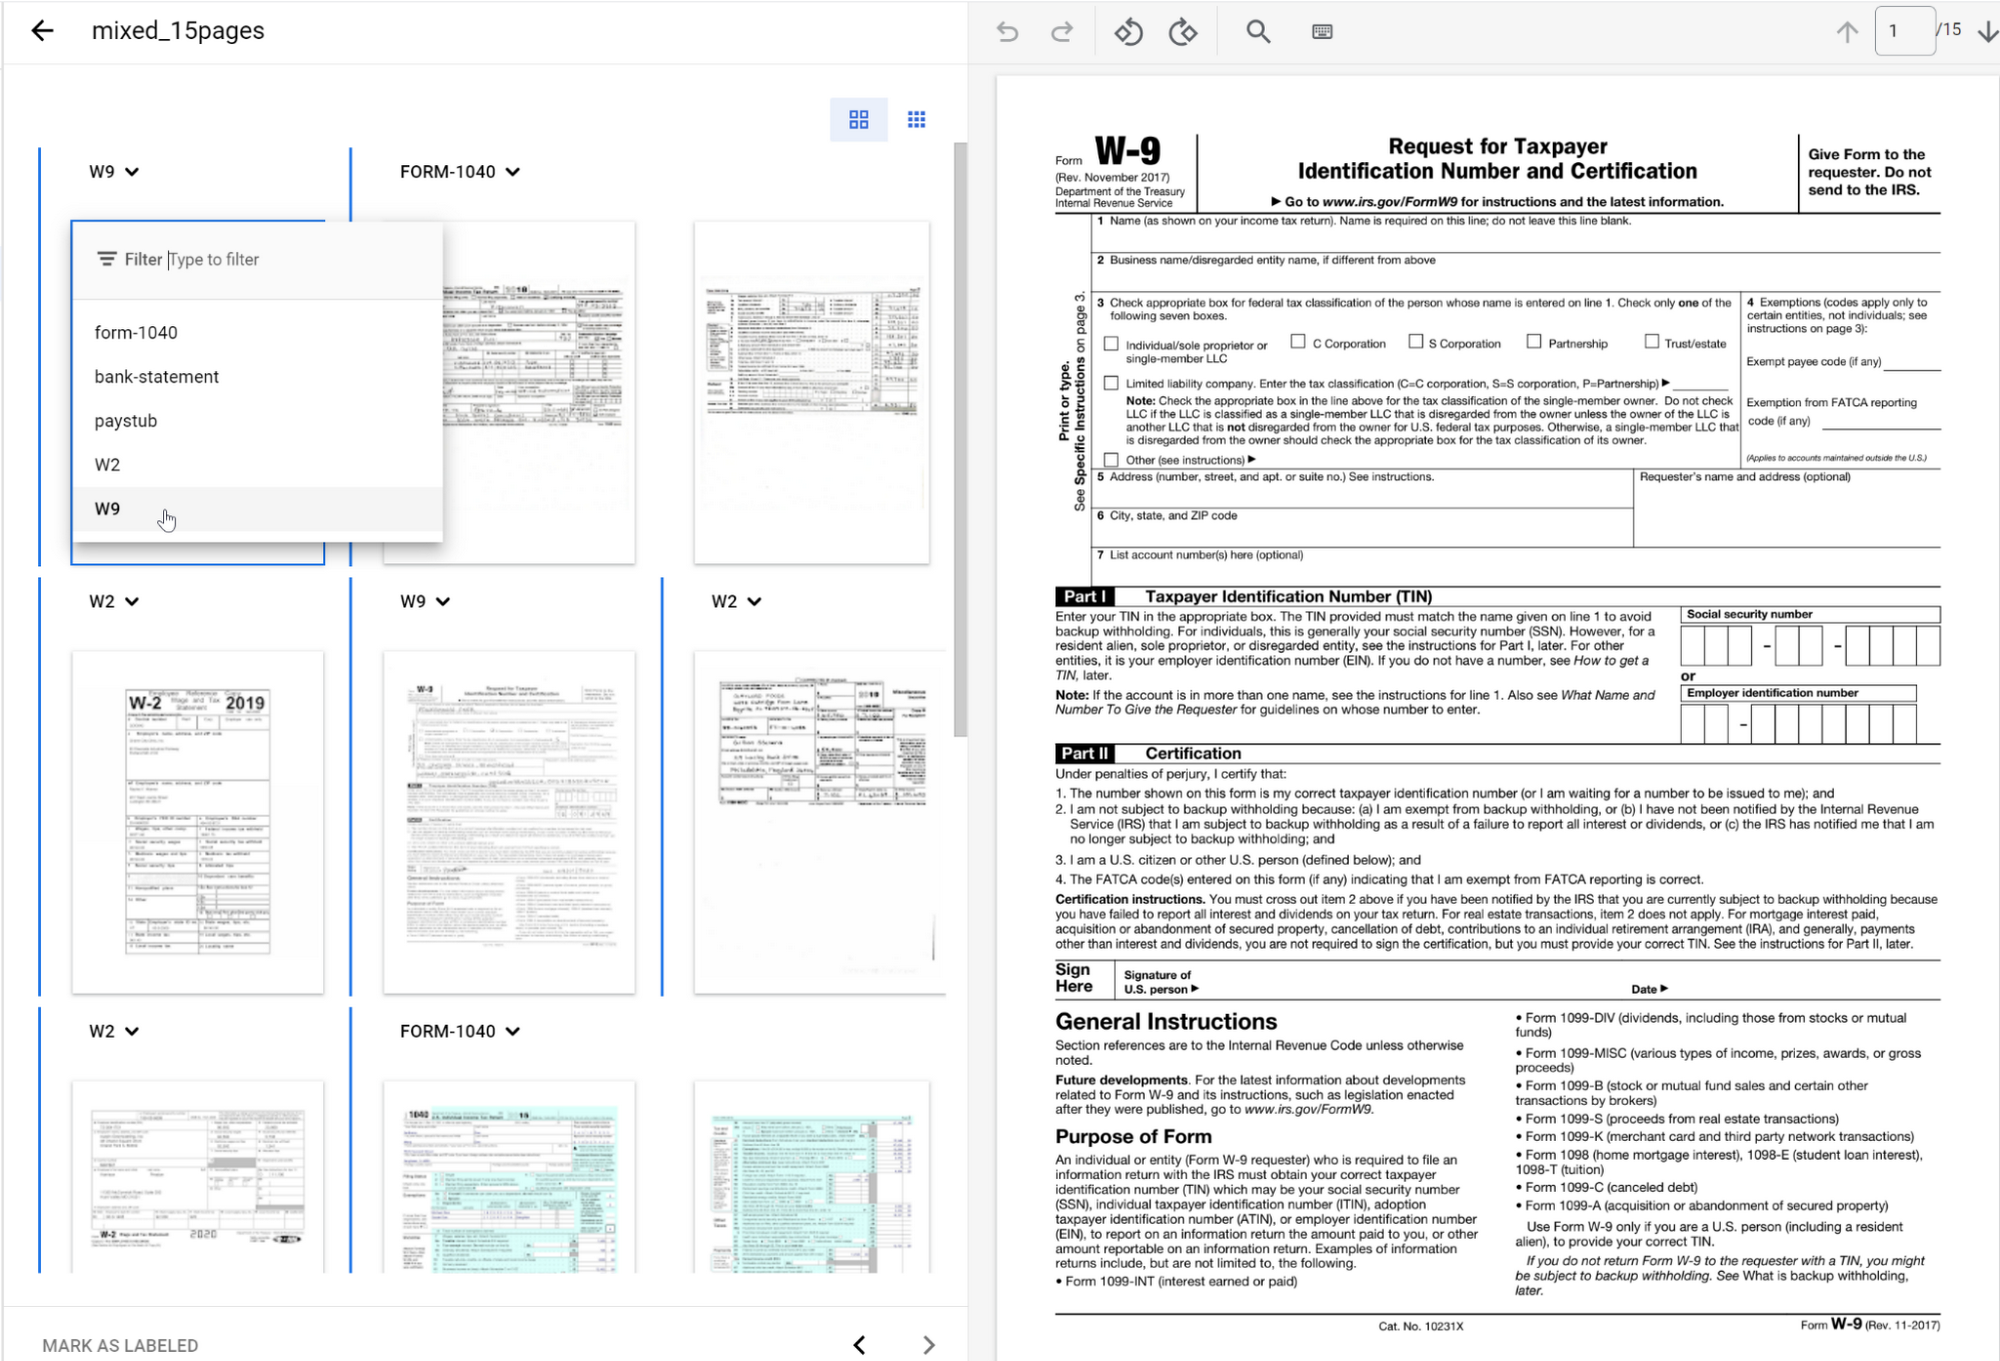
The ground truth you label in the test dataset is used to evaluate splitting and classification predictions from the CDS model.
Going into production
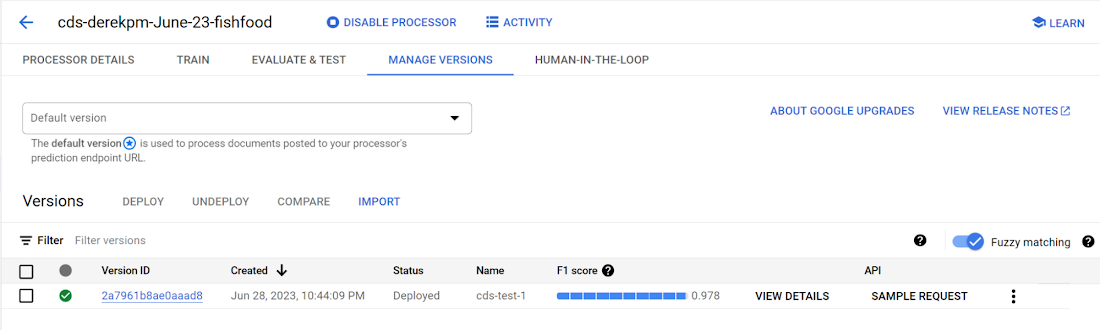
Once a model meets accuracy targets, it’s time to deploy into production and call the API endpoint to split and classify document types.
Getting started with Document AI Workbench
Custom Document Splitter is publicly available in GA and ready to help customers automate document splitting and classification. Learn more via our Document AI Workbench web page, Document AI Workbench documentation or try it out in the Google Cloud Console.
More Relevant Stories for Your Company


Why it’s Easier Than Ever for Developers to Break Into Machine Learning and Data Science
This week we talk about machine learning, its best use cases, and how developers can break into machine learning and data science. Dale Markowitz, Google Developer Advocate, talks about natural language processing as well, explaining that it’s basically the intersection of machine learning and text processing. It can be used

How to Use Machine Learning to Achieve 300% Increase in Gross Profits
Since 1994, IDOM, Japan’s leading buyer and retailer of used cars, has enjoyed success in the auto industry with a simple yet traditional business model: buy pre-owned vehicles directly from car owners and auction them to third-party dealers, or sell them to other consumers at retail stores. In an increasingly

Google Cloud Next 21 for Data Analytics Unplugged
October 23rd (this past Saturday!) was my 4th Googlevarsery and we are wrapping an incredible Google Next 2021! When I started in 2017, we had a dream of making BigQuery Intelligent Data Warehouse that would power every organization’s data driven digital transformation. This year at Next, It was amazing to

10 Reasons that Make Google Cloud the Champion of IaaS
When you choose to run your business on Google Cloud you benefit from the same planet-scale infrastructure that powers Google’s products such as Maps, YouTube, and Workspace. We have picked 10 ways in which Google Cloud Infrastructure services outshine alternatives in the market in how they simplify your operations, save
