






Realize the True Potential of Omnichannel- Five Principles to Transform the Customer Experience
READ FULL INTRODOWNLOAD AGAIN3691
Of your peers have already downloaded this article
12min Minutes
The most insightful time you'll spend today!
10160
Of your peers have already watched this video.
1:00 Minutes
The most insightful time you'll spend today!
Predict User Churn on Gaming Apps with Google Analytics Data using BigQuery ML
User retention can be a major challenge for mobile game developers. According to the Mobile Gaming Industry Analysis in 2019, most mobile games only see a 25% retention rate for users after the first day. To retain a larger percentage of users after their first use of an app, developers can take steps to motivate and incentivize certain users to return. But to do so, developers need to identify the propensity of any specific user returning after the first 24 hours.
In this blog post, we will discuss how you can use BigQuery ML to run propensity models on Google Analytics 4 data from your gaming app to determine the likelihood of specific users returning to your app.
You can also use the same end-to-end solution approach in other types of apps using Google Analytics for Firebase as well as apps and websites using Google Analytics 4. To try out the steps in this blogpost or to implement the solution for your own data, you can use this Jupyter Notebook.
Using this blog post and the accompanying Jupyter Notebook, you’ll learn how to:
- Explore the BigQuery export dataset for Google Analytics 4
- Prepare the training data using demographic and behavioural attributes
- Train propensity models using BigQuery ML
- Evaluate BigQuery ML models
- Make predictions using the BigQuery ML models
- Implement model insights in practical implementations
Google Analytics 4 (GA4) properties unify app and website measurement on a single platform and are now default in Google Analytics. Any business that wants to measure their website, app, or both, can use GA4 for a more complete view of how customers engage with their business. With the launch of Google Analytics 4, BigQuery export of Google Analytics data is now available to all users. If you are already using a Google Analytics 4 property, you can follow this guide to set up exporting your GA data to BigQuery.
Once you have set up the BigQuery export, you can explore the data in BigQuery. Google Analytics 4 uses an event-based measurement model. Each row in the data is an event with additional parameters and properties. The Schema for BigQuery Export can help you to understand the structure of the data.
In this blogpost, we use the public sample export data from an actual mobile game app called “Flood It!” (Android, iOS) to build a churn prediction model. But you can use data from your own app or website.
Here’s what the data looks like. Each row in the dataset is a unique event, which can contain nested fields for event parameters.
SELECT *FROM `firebase-public-project.analytics_153293282.events_*`TABLESAMPLE SYSTEM (1 PERCENT)

This dataset contains 5.7M events from over 15k users.
SELECTCOUNT(DISTINCT user_pseudo_id) as count_distinct_users,COUNT(event_timestamp) as count_eventsFROM`firebase-public-project.analytics_153293282.events_*

Our goal is to use BigQuery ML on the sample app dataset to predict propensity to user churn or not churn based on users’ demographics and activities within the first 24 hours of app installation.

In the following sections, we’ll cover how to:
- Pre-process the raw event data from GA4
- Identify users & the label feature
- Process demographic features
- Process behavioral features
- Train classification model using BigQuery ML
- Evaluate the model using BigQueryML
- Make predictions using BigQuery ML
- Utilize predictions for activation
Pre-process the raw event data
You cannot simply use raw event data to train a machine learning model as it would not be in the right shape and format to use as training data. So in this section, we’ll go through how to pre-process the raw data into an appropriate format to use as training data for classification models.
This is what the training data should look like for our use case at the end of this section:

Notice that in this training data, each row represents a unique user with a distinct user ID (user_pseudo_id).
Identify users & the label feature
We first filtered the dataset to remove users who were unlikely to return the app anyway. We defined these ‘bounced’ users as ones who spent less than 10 mins with the app. Then we labeled all remaining users:
- churned: No event data for the user after 24 hours of first engaging with the app.
- returned: The user has at least one event record after 24 hours of first engaging with the app.
For your use case, you can have a different definition of bounce and churning. Also you can even try to predict something else other than churning, e.g.:
- whether a user is likely to spend money on in-game currency
- likelihood of completing n-number of game levels
- likelihood of spending n amount of time in-game etc.
In such cases, label each record accordingly so that whatever you are trying to predict can be identified from the label column.
From our dataset, we found that ~41% users (5,557) bounced. However, from the remaining users (8,031), ~23% (1,883) churned after 24 hours:
SELECTbounced,churned,COUNT(churned) as count_usersFROMbqmlga4.returningusersGROUP BY 1,2ORDER BY bounced

To create these bounced and churned columns, we used the following snippet of SQL code.
...#churned = 1 if last_touch within 24 hr of app installation, else 0IF (user_last_engagement < TIMESTAMP_ADD(user_first_engagement,INTERVAL 24 HOUR),1,0 ) AS churned,#bounced = 1 if last_touch within 10 min, else 0IF (user_last_engagement <= TIMESTAMP_ADD(user_first_engagement,INTERVAL 10 MINUTE),1,0 ) AS bounced,...
You can view the Jupyter Notebook for the full query used for materializing the bounced and churned labels.
Process demographic features
Next, we added features both for demographic data and for behavioral data spanning across multiple columns. Having a combination of both demographic data and behavioral data helps to create a more predictive model.
We used the following fields for each user as demographic features:
geo.countrydevice.operating_systemdevice.language
A user might have multiple unique values in these fields — for example if a user uses the app from two different devices. To simplify, we used the values from the very first user engagement event.
CREATE OR REPLACE VIEW bqmlga4.user_demographics AS (WITH first_values AS (SELECTuser_pseudo_id,geo.country as country,device.operating_system as operating_system,device.language as language,ROW_NUMBER() OVER (PARTITION BY user_pseudo_id ORDER BY event_timestamp DESC) AS row_numFROM `firebase-public-project.analytics_153293282.events_*`WHERE event_name="user_engagement")SELECT * EXCEPT (row_num)FROM first_valuesWHERE row_num = 1 #first engagement);
Process behavioral features
There is additional demographic information present in the GA4 export dataset, e.g. app_info, device, event_params, geo etc. You may also send demographic information to Google Analytics through each hit via user_properties. Furthermore, if you have first-party data on your own system, you can join that with the GA4 export data based on user_ids.
To extract user behavior from the data, we looked into the user’s activities within the first 24 hours of first user engagement. In addition to the events automatically collected by Google Analytics, there are also the recommended events for games that can be explored to analyze user behavior. For our use case, to predict user churn, we counted the number of times the follow events were collected for a user within 24 hours of first user engagement:
user_engagementlevel_start_quickplaylevel_end_quickplaylevel_complete_quickplaylevel_reset_quickplaypost_scorespend_virtual_currencyad_rewardchallenge_a_friendcompleted_5_levelsuse_extra_steps
The following query shows how these features were calculated:
WITHevents_first24hr AS (SELECTe.*FROM`firebase-public-project.analytics_153293282.events_*` eJOINbqmlga4.returningusers rONe.user_pseudo_id = r.user_pseudo_idWHERETIMESTAMP_MICROS(e.event_timestamp) <= r.ts_24hr_after_first_engagement)SELECTuser_pseudo_id,SUM(IF(event_name = 'user_engagement', 1, 0)) AS cnt_user_engagement,# ... repeated for all behavior data ...SUM(IF(event_name = 'use_extra_steps', 1, 0)) AS cnt_use_extra_steps,FROMevents_first24hrGROUP BY1
View the notebook for the query used to aggregate and extract the behavioral data. You can use different sets of events for your use case. To view the complete list of events, use the following query:
SELECTevent_name,COUNT(event_name) as event_countFROM`firebase-public-project.analytics_153293282.events_*`GROUP BY 1ORDER BYevent_count DESC
After this we combined the features to ensure our training dataset reflects the intended structure. We had the following columns in our table:
- User ID:
user_pseudo_id
- Label:
churned
- Demographic features
countrydevice_osdevice_language
- Behavioral features
cnt_user_engagementcnt_level_start_quickplaycnt_level_end_quickplaycnt_level_complete_quickplaycnt_level_reset_quickplaycnt_post_scorecnt_spend_virtual_currencycnt_ad_rewardcnt_challenge_a_friendcnt_completed_5_levelscnt_use_extra_stepsuser_first_engagement
At this point, the dataset was ready to train the classification machine learning model in BigQuery ML. Once trained, the model will output a propensity score between churn (churned=1) or return (churned=0) indicating the probability of a user churning based on the training data.
Train classification model
When using the CREATE MODEL statement, BigQuery ML automatically splits the data between training and test. Thus the model can be evaluated immediately after training (see the documentation for more information).
For the ML model, we can choose among the following classification algorithms where each type has its own pros and cons:

Often logistic regression is used as a starting point because it is the fastest to train. The query below shows how we trained the logistic regression classification models in BigQuery ML.
CREATE OR REPLACE MODEL bqmlga4.churn_logregTRANSFORM(EXTRACT(MONTH from user_first_engagement) as month,EXTRACT(DAYOFYEAR from user_first_engagement) as julianday,EXTRACT(DAYOFWEEK from user_first_engagement) as dayofweek,EXTRACT(HOUR from user_first_engagement) as hour,* EXCEPT(user_first_engagement, user_pseudo_id))OPTIONS(MODEL_TYPE="LOGISTIC_REG",INPUT_LABEL_COLS=["churned"]) ASSELECT*FROMbqmlga4.train
We extracted month, julianday, and dayofweek from datetimes/timestamps as one simple example of additional feature preprocessing before training. Using TRANSFORM() in your CREATE MODEL query allows the model to remember the extracted values. Thus, when making predictions using the model later on, these values won’t have to be extracted again. View the notebook for the example queries to train other types of models (XGBoost, deep neural network, AutoML Tables).
Evaluate model
Once the model finished training, we ran ML.EVALUATE to generate precision, recall, accuracy and f1_score for the model:
SELECT*FROMML.EVALUATE(MODEL bqmlga4.churn_logreg)

The optional THRESHOLD parameter can be used to modify the default classification threshold of 0.5. For more information on these metrics, you can read through the definitions on precision and recall, accuracy, f1-score, log_loss and roc_auc. Comparing the resulting evaluation metrics can help to decide among multiple models.Furthermore, we used a confusion matrix to inspect how well the model predicted the labels, compared to the actual labels. The confusion matrix is created using the default threshold of 0.5, which you may want to adjust to optimize for recall, precision, or a balance (more information here).
SELECTexpected_label,_0 AS predicted_0,_1 AS predicted_1FROMML.CONFUSION_MATRIX(MODEL bqmlga4.churn_logreg)

This table can be interpreted in the following way:

Make predictions using BigQuery ML
Once the ideal model was available, we ran ML.PREDICT to make predictions. For propensity modeling, the most important output is the probability of a behavior occurring. The following query returns the probability that the user will return after 24 hrs. The higher the probability and closer it is to 1, the more likely the user is predicted to return, and the closer it is to 0, the more likely the user is predicted to churn.
SELECTuser_pseudo_id,returned,predicted_returned,predicted_returned_probs[OFFSET(0)].prob as probability_returnedFROMML.PREDICT(MODEL bqmlga4.churn_logreg,(SELECT * FROM bqmlga4.train)) #can be replaced with a proper test dataset
Utilize predictions for activation
Once the model predictions are available for your users, you can activate this insight in different ways. In our analysis, we used user_pseudo_id as the user identifier. However, ideally, your app should send back the user_id from your app to Google Analytics. In addition to using first-party data for model predictions, this will also let you join back the predictions from the model into your own data.
- You can import the model predictions back into Google Analytics as a user attribute. This can be done using the Data Import feature for Google Analytics 4. Based on the prediction values you can Create and edit audiences and also do Audience targeting. For example, an audience can be users with prediction probability between 0.4 and 0.7, to represent users who are predicted to be “on the fence” between churning and returning.
- For Firebase Apps, you can use the Import segments feature. You can tailor user experience by targeting your identified users through Firebase services such as Remote Config, Cloud Messaging, and In-App Messaging. This will involve importing the segment data from BigQuery into Firebase. After that you can send notifications to the users, configure the app for them, or follow the user journeys across devices.
- Run targeted marketing campaigns via CRMs like Salesforce, e.g. send out reminder emails.
You can find all of the code used in this blogpost in the Github repository:
What’s next?
Continuous model evaluation and re-training
As you collect more data from your users, you may want to regularly evaluate your model on fresh data and re-train the model if you notice that the model quality is decaying.
Continuous evaluation—the process of ensuring a production machine learning model is still performing well on new data—is an essential part in any ML workflow. Performing continuous evaluation can help you catch model drift, a phenomenon that occurs when the data used to train your model no longer reflects the current environment.
To learn more about how to do continuous model evaluation and re-train models, you can read the blogpost: Continuous model evaluation with BigQuery ML, Stored Procedures, and Cloud Scheduler
More resources
If you’d like to learn more about any of the topics covered in this post, check out these resources:
- BigQuery export of Google Analytics data
- BigQuery ML quickstart
- Events automatically collected by Google Analytics 4
- Qwiklabs: Create ML models with BigQuery ML
Or learn more about how you can use BigQuery ML to easily build other machine learning solutions:
- How to build demand forecasting models with BigQuery ML
- How to build a recommendation system on e-commerce data using BigQuery ML
Let us know what you thought of this post, and if you have topics you’d like to see covered in the future! You can find us on Twitter at @polonglin and @_mkazi_.Thanks to reviewers: Abhishek Kashyap, Breen Baker, David Sabater Dinter.
Groww’s Google Cloud-Powered Platform: The Key to Secure and Successful Investing

2933
Of your peers have already read this article.
4:00 Minutes
The most insightful time you'll spend today!
Groww makes investments simple and accessible, using Google Kubernetes Engine to ensure a reliable platform for customers, and makes data-backed decisions to grow its business with BigQuery.
About Groww
Headquartered in Bangalore, Groww is India’s fast-growing online investment platform that offers a simple and easy way to invest in stocks, direct mutual funds, IPOs, ETFs, and digital gold. Its mission is to make investing as intuitive and accessible as ecommerce.

Google Cloud results
- Reduces hardware costs with Preemptable Virtual Machines
- Enables a lean DevOps team with Google Cloud
- Analyzes data effectively and quickly for agile business growth
Investing is one way to ensure financial security. However, the thought of it can be a daunting one, especially for people without any prior experience. With a mission to make investment simple for digital natives in India, Groww was launched in 2016.
“We noticed that many people were on social media, booking cabs, and ordering food online, but the same people were not investing, despite having the means to do so,” says Singh. This observation led to a lightbulb moment for the team, and they realized that in order to appeal to the millennial, mobile-savvy generation, they had to create an investment platform that was as easy to use as an ecommerce platform.
Managing unpredictable spikes with Google Kubernetes Engine
As with any platform, there are bound to be peak and non-peak hours when it comes to traffic. For Groww, regular spikes take place in the early mornings, or in the evenings when people are more relaxed having come home from work. But the nature of the fintech industry is a volatile one. Investors are only human, and their investment decisions can be swayed quickly by the news. As such, spikes in traffic can happen at the most unpredictable times. To cope with this unpredictability, Groww uses Google Kubernetes Engine to scale up and down automatically to meet the required capacity around the clock. This also helps the company save costs, as it pays only for what is needed.
“No matter how much of an expert you are, you can never predict when traffic on the platform will be heavy,” says Singh. “Google Kubernetes Engine helps ensure that we never run out of capacity, without overspending on infrastructure cost.”
More recently, the investment company started using Preemptible Virtual Machines, which run at one third of its hardware cost. It also leverages Anthos to monitor and manage its backend infrastructure and to have better workload visibility. Singh shares, “We are very open to adopting new technologies, and our team is always eager to learn if we can do things better. We believe that technology is always evolving and it’s our responsibility to learn and make use of what’s available out there.”
Despite having so much running in the background, Singh explains that the company keeps a very lean DevOps team. “We’ve only got four or five people in DevOps, and that’s only possible because Google Cloud products are already able to run on their own.”
Making swift, data-backed business decisions
Infrastructure is only part of the equation for a successful business. Outside of operations, the ability to analyze data effectively is arguably the most important component for a startup to thrive. Groww leverages BigQuery to make decisions quickly and efficiently. “With BigQuery, we have a place where we can put all data, fire queries, and build dashboards almost instantly, allowing us to make business decisions quickly,” explains Singh.
The team also uses Looker Studio to clearly visualize the information generated through charts and graphs. The best part? Groww doesn’t need to spend additional time and resources setting up a large data team, since BigQuery does most of the work and in a shorter period of time. The resources saved also enables the team to focus on addressing functional requirements, rather than managing and sizing the data platform.
“From a startup perspective, BigQuery is really helpful because often setting up your own data lake can be very costly, and a distraction when the team is also busy focusing on setting up an infrastructure,” adds Singh.
Ensuring security and compliance with Google Cloud
As a fintech company, security and compliance continue to be top priorities for Groww. It chose Google Cloud as its preferred cloud provider because there are three data center replication zones in Mumbai, which means it adheres to financial regulations for keeping its user data within borders.
Moving forward, Groww plans to evolve its platform alongside its users. Singh says, “As we gain more users with different wants and needs, it will be a natural progression that the company evolves. I believe that with Google Cloud, we are well equipped to pave the way to the future.”
Scaling with Breaking News: BBC’s Serverless Infrastructure on Google Cloud

1271
Of your peers have already read this article.
3:30 Minutes
The most insightful time you'll spend today!
Editors note: Today’s post is from Neil Craig at the British Broadcasting Corporation (BBC), the national broadcaster of the United Kingdom. Neil is part of the BBC’s Digital Distribution team which is responsible for building the services such as the public-facing www bbc.co.uk and .com websites and ensuring they are able to scale and operate reliably.
The BBC’s public-facing websites inform, educate, and entertain over 498 million adults per week across the world. Because breaking news is so unpredictable, we need a core content delivery platform that can easily scale in response to surges in traffic, which can be quite unpredictable.
To this end, we recently rebuilt our log-processing infrastructure on a Google Cloud serverless platform. We’ve found that the new system, based on Cloud Storage, Eventarc, Cloud Run and BigQuery, enables us to provide a reliable and stable service without us having to worry about scaling up during busy times. We’re also able to save license fee payers money by operating the service more cost effectively than our previous architecture. Not having to manually manage the scale of major components of the stack has freed up our time, allowing us to spend it on using, rather than creating the data.
A log in time
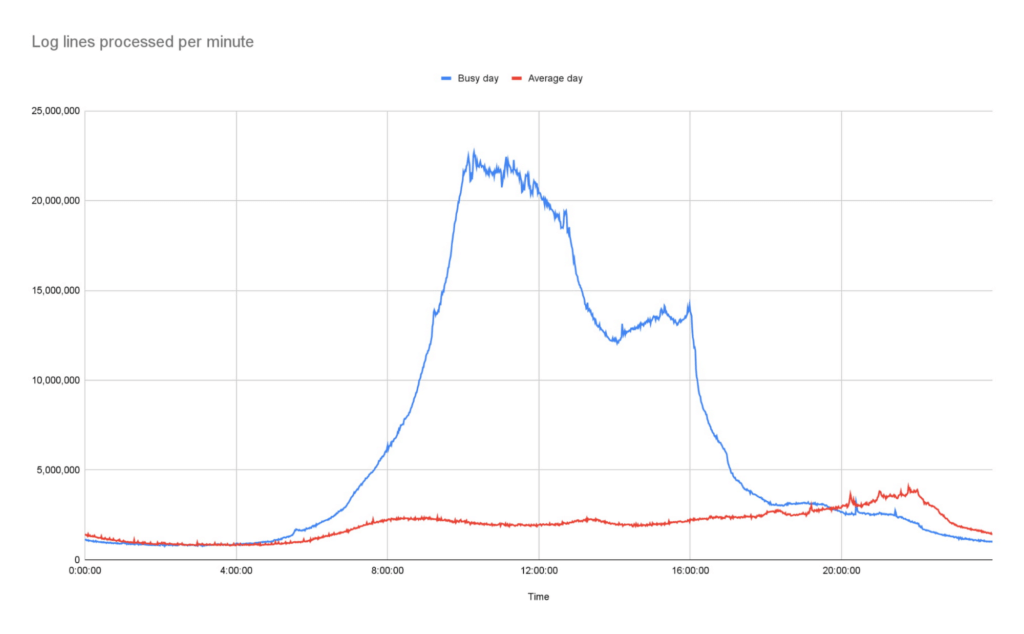
To operate the site and ensure our services run smoothly we continually monitor Traffic Manager and CDN access logs. Our websites generate more than 3B log lines per day, and handle large data bursts during major news events; on a busy day our system supports over 26B log lines in a single day.
As initially designed, we stored log data in a Cloud Storage bucket. But every time we needed to access that data, we had to download terabytes of logs down to a virtual machine (VM) with a large amount of attached storage, and use the ‘grep’ tool to search and analyze them. From beginning to end, this took us several hours. On heavy news days, the time lag made it difficult for the engineering team to do their jobs.
We needed a more efficient way to make this log data available, so we designed and deployed a new system that deals with logs and reacts to spikes more efficiently as they arrive, improving the timeliness of critical information significantly.
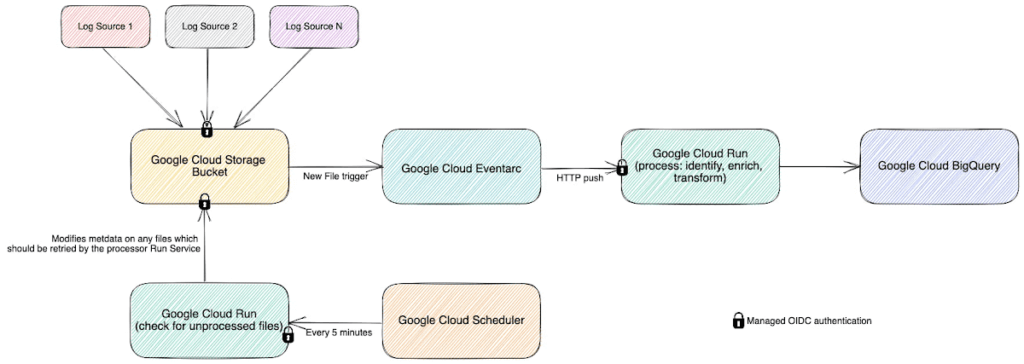
In this new system, we still leverage Cloud Storage buckets, but on arrival, each log generates an event using EventArc. That event triggers Cloud Run to validate, transform and enrich various pieces of information about the log file such as filename, prefix, and type, then processes it and outputs the processed data as a stream into BigQuery. This event-driven design allows us to process files quickly and frequently — processing a single log file typically takes less than a second. Most of the files that we feed into the system are small, fewer than 100 Megabytes, but for larger files, we automatically split those into multiple files and Cloud Run automatically creates additional parallel instances very quickly, helping the system scale almost instantly.
The nature of running a global website which provides news coverage means we see frequent, unpredictable large spikes of traffic. We learn from these and optimize our systems where necessary so we’re confident in the system’s ability to handle significant traffic. For example, around the time of the announcement of the Queen’s passing in September, we saw some huge traffic spikes. During the largest, within one minute, we went from running 150 – 200 container instances to over 1000…. and the infrastructure just worked. Because we engineered the log processing system to rely on the elasticity of a serverless architecture, we knew from the get-go that it would be able to handle this type of scaling.
Around the time of the announcement of the Queen’s passing in September, we saw some huge traffic spikes. During the largest, within one minute, we went from running 150 – 200 container instances to over 1000…. and the infrastructure just worked
Our initial concern about choosing serverless was cost. It turns out that using Cloud Run is significantly more cost-effective than running the number of VMs we would need for a system that could survive reasonable traffic spikes with a similar level of confidence.
Switching to Cloud Run also allows us to use our time more efficiently, as we no longer need to spend time managing and monitoring VM scaling or resource usage. We picked Cloud Run intentionally because we wanted a system that could scale well without manual intervention. As the digital distribution team, our job is not to do ops work on the underlying components of this system — we leave that to the specialist ops teams at Google.
Another conscious choice we made whilst rebuilding the system was to use the built-in service-to-service authentication in Google Cloud. Rather than implementing and maintaining the authentication mechanism ourselves, we add some simple configuration which instructs the client side to create and send a OIDC token for a service account we define and the server side to authenticate and authorize the client. Another example is pushing events into Cloud Run, where we can configure Cloud Run authorization to only accept events from specific EventArc triggers, so it is fully private.
Going forward, the new system has allowed us to make better use of our data safely. For example, BigQuery’s per-column permissions allow us to open up access to our logs to other engineering teams around the organization, without having to worry about sharing PII that’s restricted to approved users.
The goal of our team is to empower all teams within the BBC to get the content they want on the web when they want it, make it reliable, secure, and make sure it can scale. Google Cloud serverless products helped us to achieve these goals with relatively little effort and require significantly less management than previous generations of technology.
3387
Of your peers have already watched this video.
19:00 Minutes
The most insightful time you'll spend today!
Booking.com’s Apigee Hybrid on Anthos is the Largest Hybrid Deployment Ever
Apigee API Management Platform helps unlock the value of data in legacy systems and applications to accelerate end-user/customer experience by modernizing apps and building multi-cloud environments. With Apigee Hybrid on Anthos, a service mesh technology, Booking.com was able to achieve its goal of providing customers a connected trip experience. Watch the video to understand how Booking.com, a biggest brand in Booking Holdings portfolio with over 1.5 million room bookings in 24 hours moved to hybrid cloud and unified APIs to one platform offering a end-to-end customer journey for a connected trip!
PaGaLGuY Turns to Google Cloud Platform to Power Leading India Education Network

8143
Of your peers have already read this article.
2:30 Minutes
The most insightful time you'll spend today!
Founded in 2006, PaGaLGuY started as a forum that enabled students, typically aged between 20 and 30 to discuss and seek advice on academic issues. By 2011, PaGaLGuY had increased its traffic to about 250,000 page views per month. The business is now one of India’s largest education networks and provides an app that users can download to their Android and iOS devices.
Over the past six years, PaGaLGuY has extended its service to include video advice from experts on education topics and grown the number of views of its pages to 1.5 million per day. As Head of Technology for the business, Sandeep Kalidindi has played a key role in ensuring PaGaLGuY is as engaging as possible to users. “Because the product is advertising based, the greater the user engagement, the greater the advertising revenue,” Kalidindi explains.
Google Cloud Platform Results
- Supported growth to 1.5 million page views per day and demand spikes that see requests increase from about 90 per second to about 1,200 per second
- Reduced API latency from about 1 second to about 40 milliseconds
- Reduced system administration time from three to four days per week to 30 minutes every two weeks
In 2015, PaGaLGuY’s senior management team decided to deliver an even more relevant experience for users of the education network. “The core thing we had to do was personalise the experience for each and every student that visited PaGaLGuY,” Kalidindi says. “So we had to capture each student’s data to customise what they see when they open the site.”
The business also found traffic to the network was straining its infrastructure. During demand peaks, created by exams involving as many as 5 million students, PaGaLGuY would be inaccessible for periods of 30 minutes to one hour. Furthermore, average API latency had climbed to an unacceptable 1 second, compromising performance.
PaGaLGuY needed to access extensive compute resources to undertake its planned change. Had the business relied on a physical technology architecture to undertake the transformation, it would have had to purchase capacity equivalent to 16 new servers. “There was no way with a small team we could grow to that extent in a short time,” Kalidindi says. “This was the right moment for us to explore cloud services.”
The business established two primary requirements the selected cloud service needed to meet. First, PaGaLGuY had to be able to scale the platform with costs rising only in proportion to the increase in resources consumed. Accordingly, the business would have to minimise the number of employees required to manage the cloud environment. Second, the platform had to give PaGaLGuY easy access to student data and the ability to undertake prompt, granular analysis.
PaGaLGuY reviewed available public cloud services and determined that Google Cloud Platform (GCP) was the best fit for its business. “Google Cloud Platform was considerably more mature than the alternatives, with a high degree of automation and a suite of managed services,” Kalidindi says. PaGaLGuY management then discussed with Google how to optimise cost, performance and availability of its personalised education network on GCP.
With assistance from Google and business transformation specialists Searce, PaGaLGuY was able to deliver the platform into production on GCP in 10 months. “Searce was very proactive in ensuring the environment met our needs and allowing us to gain priority access to Google services in development,” Kalidindi says. “Their team was integral to the success of the migration.”
PaGaLGuY has been running in production in GCP for two years. The education network’s GCP architecture comprises a scalable back-end built on Google App Engine; a managed environment for its containerised applications in Google Kubernetes Engine; messaging-oriented middleware through Google Cloud Pub/Sub; a relational database in Google Cloud SQL; a managed data analytics warehouse running in Google BigQuery; stream and batch data processing through Google Cloud Dataflow; and object storage in Google Cloud Storage.
PaGaLGuY has leveraged GCP services to break down its platform application from a monolithic build to a series of microservices running in Google App Engine that enable independent deployment cycles, minimise test and quality assurance overheads and provide clearer monitoring and logging.
Running on GCP has enabled PaGaLGuY to add new personalisation features and grow fourfold without having to add any new engineers or administrators to accommodate the increased traffic. The business has also used the platform to seamlessly collect and aggregate students’ data for analysis, reporting and delivering a more targeted user experience. Furthermore, PaGaLGuY has been able to provide its management team with direct access to Google BigQuery to scrutinise data rather than require them to wait at least a day to view reports created by the product or technology teams.
Support demand peaks of 1,200 requests per second
“Thanks to Google Cloud Platform, we can easily support demand peaks that see requests per second rise from an average 90 per second to about 1,200 per second for as long as 45 minutes,” Kalidindi says. Due to GCP’s scalability, PaGaLGuY can ensure its education network remains available and performance remains consistent during those periods.
Latency cut to 40 milliseconds
The business has also reduced average API latency from 1 second to about 40 milliseconds. Furthermore, using GCP has enabled PaGaLGuY to automate most of its processes and reduce system administration requirements from three to four days a week across its team members to about half an hour per week.
The performance of GCP has transformed PaGaLGuY’s culture and processes. “Once our team was exposed to Google Cloud Platform and understood the superiority of the platform, our mindset changed from ‘let us do everything on our own’ to ‘let us do what we do best’ and delegate the remainder,” Kalidindi says. The quality of the service provided by GCP means PaGaLGuY effectively considers the cloud provider as part of its team. “We are always eager to see what new services are being launched and are extremely excited about what Google Cloud Platform can provide as part of its roadmap.” he concludes.
More Relevant Stories for Your Company

Transform ‘Dark Data’ from Documents with Document AI, Cloud Functions and Workflows
At enterprises across industries, documents are at the center of core business processes. Documents store a treasure trove of valuable information whether it's a company's invoices, HR documents, tax forms and much more. However, the unstructured nature of documents make them difficult to work with as a data source. We

Traveloka Scales Up Operations and Growth with APIs
Traveloka is an Indonesian tech company currently focusing on the travel and lifestyle markets. Our customers, the majority of which come from Southeast Asia, visit the site mainly to book flights, hotels, transportation, lifestyle experiences (e.g. theme parks, movie tickets, beauty and spa treatments, and restaurant vouchers), and much more. We

Container Platforms on Google Cloud Maximize Developer Efficiency, Speed-up Time to Market and Eliminate IT Overhead!
Every tech company and growing startup faces pressure to make efficient use of technical talent. Increasingly, this means determining if and how the cloud can help this talent focus on things like product development instead of IT overhead. These challenges are the starting place for our new whitepaper “The future

Google Cloud named a Leader in API Management Solutions in The Forrester Wave
The right API strategy is a key element of your digital business success, so choosing the best API management solution is critical - but often challenging. Organizations like yours need to address a wide range of criteria to support an effective digital business strategy, and that requires a robust API
