






Le Figaro Uses Google Firebase to Personalize Experiences and Generates 3X Revenue Results
READ FULL INTRODOWNLOAD AGAIN8284
Of your peers have already downloaded this article
1:45 Minutes
The most insightful time you'll spend today!
Google Cloud Helped Digitec Galaxus Personalize Over 2 Million Newsletters in a Week
8281
Of your peers have already read this article.
3:00 Minutes
The most insightful time you'll spend today!
Digitec Galaxus AG is the biggest online retailer in Switzerland, operating two online stores: Digitec, Switzerland’s online market leader for consumer electronics and media products, and Galaxus, the largest Swiss online shop with a steadily growing range of consistently low-priced products for almost all daily needs.
Known for its efficient, personalized shopping experiences, it’s clear that Digitec Galaxus understands what it takes to deliver a platform that is interesting and relevant to customers every time they shop.
The problem: Personalizing decisions for every situation
Digitec Galaxus already had established an engine to help them personalize experiences for shoppers when they reached out to Google Cloud. They had multiple recommendation systems in place and were also extensive early adopters of Recommendations AI, which already enabled them to offer personalized content in places like their homepages, product detail pages, and their newsletter.
But those same systems sometimes made it difficult to understand how best to combine and optimize to create the most personalized experiences for their shoppers. Their requirements were threefold:
- Personalization: They have over 12 recommenders they can display on the app, however they would like to contextualize this and choose different recommenders (which in turn select the items) for different users. Furthermore they would like to exploit existing trends as well as experiment with new ones.
- Latency: They would like to ensure that the solution is architected so that the ranked list of recommenders can be retrieved with sub 50 ms latency.
- End-to-end easy to maintain & generalizable/modular architecture: Digitec wanted the solution to be architected using an easy to maintain, open source stack, complete with all MLops capabilities required to train and use contextual bandits models. It was also important to them that it is built in a modular fashion such that it can be adapted easily to other use cases which have in mind such as recommendations on the homepage, Smartags and more .
To improve, they asked us to help them implement a machine learning (ML) contextual bandit based recommender system on Google Cloud taking all the above factors into consideration to take their personalization to the next level.
Contextual bandits algorithms are a simplified form of reinforcement learning and help aid real-world decision making by factoring in additional information about the visitor (context) to help learn what is most engaging for each individual. They also excel at exploiting trends which work well, as well as exploring new untested trends which can yield potentially even better results. For instance, imagine that you are personalizing a homepage image where you could show a comfy living room couch or pet supplies.
Without a contextual bandit algorithm, one of these images would be shown to someone at random without considering information you may have observed about them during previous visits. Contextual bandits enable businesses to consider outside context, such as previously visited pages or other purchases, and then observe the final outcome (a click on the image) to help determine what works best.
Creating a personalization system with contextual bandits
While Digitec Galaxus heavily personalizes their website homepages, they are very very sensitive and also require more cross-team collaboration to update and make changes.
Together with the Digitec Galaxus team, we decided to narrow the scope and focus on building a contextual bandit personalization system for the newsletter first. The digitec Galaxus team has complete control over newsletter decisions and testing various ML experiments on a newsletter would have less chance of adverse revenue impact than a website homepage.
The main goal was to architect a system that could be easily ported over to the homepage and other services offered by Digitec with minimal adaptations. It would also need to satisfy the functional and non-functional requirements of the homepage as well as other internal use cases.
Below is a diagram of how the newsletter’s personalization recommendation system works:

- The system is given some context features about the newsletter subscriber such as their purchase history and demographics. Features are sometimes referred to as variables or attributes, and can vary widely depending on what data is being analyzed.
- The contextual bandit model trains recommendations using those context features and 12 available recommenders (potential actions).
- The model then calculates which action is most likely to enhance the chance of reward (a user clicking in the newsletter) and also minimize the problem (an unsubscribe).
Calculating whether a click was a newsletter or an unsubscribe enabled the system to optimize for increasing clicks and avoid showing non-relevant content to the user (click-bait). This enabled Digitec Galaxus to exploit popular trends while also exploring potentially better-performing trends.
How Google Cloud helps
The newsletter context-driven personalization system was built on Google Cloud architecture using the ML recommendation training and prediction solutions available within our ecosystem.
Below is a diagram of the high-level architecture used:
The architecture covers three phases of generating context-driven ML predictions, including:
ML Development: Designing and building the ML models and pipeline
Vertex Notebooks are used as data science environments for experimentation and prototyping. Notebooks are also used to implement model training, scoring components, and pipelines. The source code is version controlled in Github. A continuous integration (CI) pipeline is set up to automatically run unit tests, build pipeline components, and store the container images to Cloud Container Registry.
ML Training: Large-scale training and storing of ML models
The training pipeline is executed on Vertex Pipelines. In essence, the pipeline trains the model using new training data extracted from BigQuery and produces a trained, validated contextual bandit model stored in the model registry. In our system, the model registry is a curated Cloud Storage.
The training pipeline uses Dataflow for large scale data extraction, validation, processing, and model evaluation, and Vertex Training for large-scale distributed training of the model. AI Platform Pipelines also stores artifacts, the output of training models, produced by the various pipeline steps to Cloud Storage. Information about these artifacts are then stored in an ML metadata database in Cloud SQL. To learn more about how to build a Continuous Training Pipeline, read the documentation guide.
ML Serving: Deploying new algorithms and experiments in production
The training pipeline uses batch prediction to generate many predictions at once using AI Platform Pipelines, allowing Digitec Galaxus to score large data sets. Once the predictions are produced, they are stored in Cloud Datastore for consumption. The pipeline uses the most recent contextual bandit model in the model registry to evaluate the inference dataset in BigQuery and give a ranked list of the best newsletters for each user, and persist it in Datastore. A Cloud Function is provided as a REST/HTTP endpoint to retrieve the precomputed predictions from Datastore.
All components of the code and architecture are modular and easy to use, which means they can be adapted and tweaked to several other use cases within the company as well.
Better newsletter predictions for millions
The newsletter prediction system was first deployed in production in February, and Digitec Galaxus has been using it to personalize over 2 million newsletters a week for subscribers. The results have been impressive, 50% higher than our baseline. However, the collaboration is still ongoing to improve the results even more.
“Working at this level in direct exchange with Google’s machine learning experts is a unique opportunity for us. The use of contextual bandits in the targeting of our recommendations enables us to pursue completely new approaches in personalization by also personalizing the delivery of the respective recommender to the user. We have already achieved good results in our newsletter in initial experiments and are now working on extending the approach to the entire newsletter by including more contextual data about the bandits arms. Furthermore, as a next step, we intend to apply the system to our online store as well, in order to provide our users with an even more personalized experience. To build this scalable solution, we are using Google’s open source tools such as TFX and TF Agents, as well as Google Cloud Services such as Compute Engine, Cloud Machine Learning Engine, Kubernetes Engine and Cloud Dataflow.”—Christian Sager, Product Owner, Personalization ( Digitec Galaxus)
Since the existing architecture and system is also dynamic, it will automatically adapt to new behaviours, trends, and users. As a result, Digitec Galaxus plans to re-use the same components and extend the existing system to help them improve the personalization of their homepage and other current use cases they have within the company. Beyond clicks and user engagement, the system’s flexibility also allows for future optimization of other criteria. It’s a very exciting time and we can’t wait to see what they build next!
Scaling Ad Personalization with Bigtable

2991
Of your peers have already read this article.
2:30 Minutes
The most insightful time you'll spend today!
Cloud Bigtable is a popular and widely used key-value database available on Google Cloud. The service provides scale elasticity, cost efficiency, excellent performance characteristics, and 99.999% availability SLA. This has led to massive adoption with thousands of customers trusting Bigtable to run a variety of their mission-critical workloads.
Bigtable has been in continuous production usage at Google for more than 15 years now. It processes more than 5 billion requests per second at peak and has more than 10 exabytes of data under management. It’s one of the largest semi-structured data storage services at Google.
One of the key use cases for Bigtable at Google is ad personalization. This post describes the central role that Bigtable plays within ad personalization.
Ad personalization
Ad personalization aims to improve user experience by presenting topical and relevant ad content. For example, I often watch bread-making videos on YouTube. If ads personalization is enabled in my ad settings, my viewing history could indicate to YouTube that I’m interested in baking as a topic and would potentially be interested in ad content related to baking products.
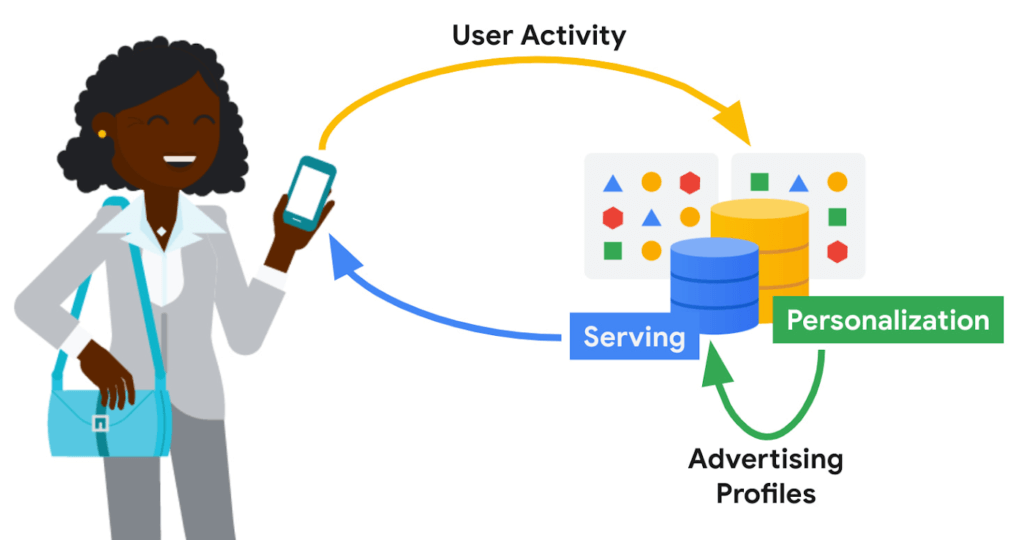
Ad personalization requires large-scale data processing in near real-time for timely personalization with strict controls for user data handling and retention. System availability needs to be high, and serving latencies need to be low due to the narrow window within which decisions need to be made on what ad content to retrieve and serve. Sub-optimal serving decisions (e.g. falling back to generic ad content) could potentially impact user experience. Ad economics requires infrastructure costs to be kept as low as possible.
Google’s ad personalization platform provides frameworks to develop and deploy machine learning models for relevance and ranking of ad content. The platform supports both real-time and batch personalization. The platform is built using Bigtable, allowing Google products to access data sources for ads personalization in a secure manner that is both privacy and policy compliant, all while honoring users’ decisions about what data they want to provide to Google
The output from personalization pipelines, such as advertising profiles are stored back in Bigtable for further consumption. The ad serving stack retrieves these advertising profiles to drive the next set of ad serving decisions.
Some of the storage requirements of the personalization platform include:
- Very high throughput access for batch and near real-time personalization
- Low latency (<20 ms at p99) lookup for reads on the critical path for ad serving
- Fast (i.e. in the order of seconds) incremental update of advertising models in order to reduce personalization delay
Bigtable
Bigtable’s versatility in supporting both low-cost, high-throughput access to data for offline personalization as well as consistent low-latency access for online data serving makes it an excellent fit for the ads workloads.
Personalization at Google-scale requires a very large storage footprint. Bigtable’s scalability, performance consistency and low cost required to meet a given performance curve are key differentiators for these workloads.
Data model
The personalization platform stores objects in Bigtable as serialized protobufs keyed by Object ids. Typical data sizes are less than 1 MB and serving latency is less than 20 ms at p99.
Data is organized as corpora, which correspond to distinct categories of data. A corpus maps to a replicated Bigtable.
Within a corpus, data is organized as DataTypes, logical groupings of data. Features, embeddings, and different flavors of advertising profiles are stored as DataTypes, which map to Bigtable column families. DataTypes are defined in schemas which describe the proto structure of the data and additional metadata indicating ownership and provenance. SubTypes map to Bigtable columns and are free-form.
Each row of data is uniquely identified by a RowID, which is based on the Object ID. The personalization API identifies individual values by RowID (row key), DataType (column family), SubType (column part), and Timestamp.
Consistency
The default consistency mode for operations is eventual. In this mode, data from the Bigtable replica nearest to the user is retrieved, providing the lowest median and tail latency.
Reads and writes to a single Bigtable replica are consistent. If there are multiple replicas of Bigtable in a region, traffic spillover across regions is more likely. To improve the likelihood of read-after-write consistency, the personalization platform uses a notion of row affinity. If there are multiple replicas in a region, one replica is preferentially selected for any given row, based on a hash of the Row ID.
For lookups with stricter consistency requirements, the platform first attempts to read from the nearest replica and requests that Bigtable return the current low watermark (LWM) for each replica. If the nearest replica happens to be the replica where the writes originated, or if the LWMs indicate that replication has caught up to the necessary timestamp, then the service returns a consistent response. If replication has not caught up, then the service issues a second lookup—this one targeted at the Bigtable replica where writes originated. That replica could be distant and the request could be slow. While waiting for a response, the platform may issue failover lookups to other replicas in case replication has caught up at those replicas.
Bigtable replication
The Ads personalization workloads use a Bigtable replication topology with more than 20 replicas, spread across four continents.
Replication helps address the high availability needs for ad serving. Bigtable’s zonal monthly uptime percentage is in excess of 99.9%, and replication coupled with a multi-cluster routing policy allows for availability in excess of 99.999%.
A globe-spanning topology allows for data placement that is close to users, minimizing serving latencies. However, it also comes with challenges such as variability in network link costs and throughputs. Bigtable uses Minimum Spanning Tree-based routing algorithms and bandwidth-conserving proxy replicas to help reduce network costs.
For ads personalization, reducing Bigtable replication delay is key to lowering the personalization delay (the time between a user’ action and when that action has been incorporated into advertising models to show more relevant ads to the user). Faster replication is preferred but we also need to balance serving traffic against replication traffic and make sure low-latency user-data serving is not disrupted due to incoming or outgoing replication traffic flows. Under the hood, Bigtable implements complex flow control and priority boost mechanisms to manage global traffic flows and to balance serving and replication traffic priorities.
Workload Isolation
Ad personalization batch workloads are isolated from serving workloads by pinning a given set of workloads onto certain replicas; some Bigtable replicas exclusively drive personalization pipelines while others drive user-data serving. This model allows for a continuous and near real-time feedback loop between serving systems and offline personalization pipelines, while protecting the two workloads from contending with each other.
For Cloud Bigtable users, AppProfiles and cluster-routing policies provide a way to confine and pin workloads to specific replicas to achieve coarse-grained isolation.
Data residency
By default, data is replicated to every replica—often spread out globally—which is wasteful for data that is only accessed regionally. Regionalization saves on storage and replication costs by confining data to the region where it is most likely to be accessed. Compliance with regulations mandating that data pertaining to certain subjects are physically stored within a given geographical area is also vital.
The location of data can be either implicitly determined by the access location of requests or through location metadata and other product signals. Once the location for a user is determined, it is stored in a location metadata table which points to the Bigtable replicas that read requests should be routed to. Migration of data based on row-placement policies happens in the background, without downtime or serving performance regressions.
Conclusion
In this blog post, we looked at how Bigtable is used within Google to support an important use case—modeling user intent for ad personalization.
Over the past decade, Bigtable has scaled as Google’s personalization needs have scaled by orders of magnitude. For large-scale personalization workloads, Bigtable offers low cost storage with excellent performance characteristics. It seamlessly handles global traffic flows with simple user configurations. Its ease at handling both low-latency serving and high-throughput batch computations make it an excellent option for lambda-style data processing pipelines.
We continue to drive high levels of investment to further lower costs, improve performance, and bring new features to make Bigtable an even better choice for personalization workloads.
Learn more
To get started with Bigtable, try it out with a Qwiklab and learn more about the product here.
Acknowledgements
We’d like to thank Ashish Awasthi, Ashish Chopra, Jay Wylie, Phaneendhar Vemuru, Bora Beran, Elijah Lawal, Sean Rhee and other Googlers for their valuable feedback and suggestions.
6163
Of your peers have already watched this video.
18:00 Minutes
The most insightful time you'll spend today!
An Overview of Google’s Data Cloud
Data access, management and privacy has been at the center of priorities for enterprises that are aiming to be more agile, reliable and data-driven. Google Cloud’s technology innovations spanning products like BigQuery, Spanner, Looker and VertexAI help organizations navigate the complexities related to siloed data in large volumes sprawled across databases, data lakes, data warehouses, and data marts in multiple clouds and on-premises. Watch the video to learn how companies are building data on Google Cloud for better analysis, security and management to achieve bottomline!
How to Enhance Incremental Pipeline Performance while Ingesting Data into BigQuery

6310
Of your peers have already read this article.
3:00 Minutes
The most insightful time you'll spend today!
When you build a data warehouse, the important question is how to ingest data from the source system to the data warehouse. If the table is small you can fully reload a table on a regular basis, however, if the table is large a common technique is to perform incremental table updates. This post demonstrates how you can enhance incremental pipeline performance when you ingest data into BigQuery.
Setting up a standard incremental data ingestion pipeline
We will use the below example to illustrate a common ingestion pipeline that incrementally updates a data warehouse table. Let’s say that you ingest data into BigQuery from a large and frequently updated table in the source system, and you have Staging and Reporting areas (datasets) in BigQuery.

The Reporting area in BigQuery stores the most recent, full data that has been ingested from the source system tables. Usually you create the base table as a full snapshot of the source system table. In our running example, we use BigQuery public data as the source system and create reporting.base_table as shown below. In our example each row is identified by a unique key which consists of two columns: block_hash and log_index.
CREATE TABLE reporting.base_table --156 GB processedPARTITION BY TIMESTAMP_TRUNC(block_timestamp, DAY) ASSELECT log_index, data, topics, block_timestamp, block_hashFROM bigquery-public-data.crypto_ethereum.logsWHERE block_timestamp BETWEEN TIMESTAMP '2020-01-01' AND TIMESTAMP '2020-11-30';
In data warehouses it is common to partition a large base table by a datetime column that has a business meaning. For example, it may be a transaction timestamp, or datetime when some business event happened, etc. The idea is that data analysts who use the data warehouse usually need to analyze only some range of dates and rarely need the full data. In our example, we partition the base table by block_timestamp which comes from the source system.
After ingesting the initial snapshot you need to capture changes that happen in the source system table and update the reporting base table accordingly. This is when the Staging area comes into the picture. The staging table will contain captured data changes that you will merge into the base table. Let’s say that in our source system on a regular basis we have a set of new rows and also some updated records. In our example we mock the staging data as follows: first, we create new data, than we mock the updated records:
CREATE TABLE staging.load_delta AS --5 GB processedSELECT log_index, data, topics, block_timestamp, block_hashFROM bigquery-public-data.crypto_ethereum.logsWHERE block_timestamp BETWEEN TIMESTAMP '2020-12-01' AND TIMESTAMP '2020-12-07';INSERT INTO staging.load_delta --2 GB processedSELECT log_index, CONCAT(data, RAND()), topics, block_timestamp, block_hashFROM bigquery-public-data.crypto_ethereum.logs TABLESAMPLE SYSTEM (5 PERCENT)WHERE block_timestamp BETWEEN TIMESTAMP '2020-10-01' AND TIMESTAMP '2020-11-30';
Next, the pipeline merges the staging data into the base table. It joins two tables by unique key and than updates the changed value or inserts a new row
MERGE INTO reporting.base_table T --161 GB processedUSING staging.load_delta SON T.block_hash = S.block_hashAND T.log_index = S.log_indexWHEN MATCHED THEN UPDATE SETT.data = S.dataWHEN NOT MATCHED THEN INSERT (log_index, data, topics, block_timestamp, block_hash)VALUES (log_index, data, topics, block_timestamp, block_hash);
It is often the case that the staging table contains keys from various partitions but the number of those partitions are relatively small. It holds, for instance, because in the source system the recently added data may get changed due to some initial errors or ongoing processes but older records are rarely updated. However, when the above MERGE gets executed, BigQuery scans all partitions in the base table and processes 161 GB of data. You might add additional join condition on block_timestamp:
MERGE INTO reporting.base_table T --161 GB processedUSING staging.load_delta SON T.block_hash = S.block_hashAND T.log_index = S.log_indexAND T.block_timestamp = S.block_timestampWHEN MATCHED THEN UPDATE SETT.data = S.dataWHEN NOT MATCHED THEN INSERT (log_index, data, topics, block_timestamp, block_hash)VALUES (log_index, data, topics, block_timestamp, block_hash);
But BigQuery would still scan all partitions in the base table because condition T.block_timestamp = S.block_timestamp is a dynamic predicate and BigQuery doesn’t automatically push such predicates down from one table to another in MERGE.
Can you improve the MERGE efficiency by making it scan less data? The answer is Yes.
As described in the MERGE documentation, pruning conditions may be located in a subquery filter, a merge_condition filter, or a search_condition filter. In this post we show how you can leverage the first two. The main idea is to turn a dynamic predicate into a static predicate.
Steps to enhance your ingestion pipeline
The initial step is to compute the range of partitions that will be updated during the MERGE and store it in a variable. As was mentioned above, in data ingestion pipelines, staging tables are usually small so the cost of the computation is relatively low.
DECLARE src_range STRUCT<date_min TIMESTAMP, date_max TIMESTAMP> --115 MB processedDEFAULT(SELECT STRUCT(MIN(block_timestamp) AS date_min,MAX(block_timestamp) AS date_max) FROM staging.load_delta);
Based on your existing ETL/ELT pipeline, you can add the above code as-is to your pipeline or you can compute date_min, data_max as part of some already existing transformation step. Alternatively, date_min, data_max can be computed on the Source System side while capturing the next ingestion data batch.
After computing date_min, date_max you pass those values to the MERGE statement as static predicates. There are several ways to enhance the MERGE and prune partitions in the base table based on precomputed date_min, data_max.
If your initial MERGE statement uses a subquery, you can incorporate a new filter into it:
BEGINDECLARE src_range STRUCT<date_min TIMESTAMP, date_max TIMESTAMP> --115 MB processedDEFAULT(SELECT STRUCT(MIN(block_timestamp) AS date_min,MAX(block_timestamp) AS date_max) FROM staging.load_delta);MERGE INTO reporting.base_table T --41 GB processedUSING (SELECT *FROM staging.load_deltaWHERE block_timestamp BETWEEN src_range.date_min AND src_range.date_max) SON T.block_hash = S.block_hashAND T.log_index = S.log_indexAND T.block_timestamp = S.block_timestampWHEN MATCHED THEN UPDATE SETT.data = S.dataWHEN NOT MATCHED THEN INSERT (log_index, data, topics, block_timestamp, block_hash)VALUES (log_index, data, topics, block_timestamp, block_hash);END;
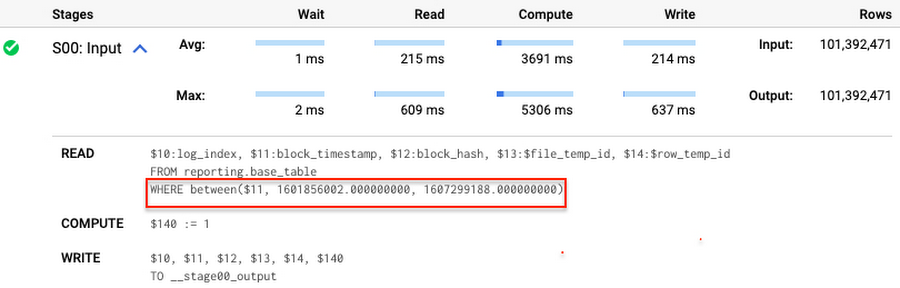
Note that you add the static filter to the staging table and keep T.block_timestamp = S.block_timestamp to convey to BigQuery that it can push that filter to the base table. This MERGE processes 41 GB of data in contrast to the initial 161 GB. You can see in the query plan that BigQuery pushes the partition filter from the staging table to the base table:
This type of optimization, when a pruning condition is pushed from a subquery to a large partitioned or clustered table, is not unique for MERGE. It also works for other types of queries. For instance:
SELECT * -- 41 GB processedFROM reporting.base_table TINNER JOIN staging.load_delta SON T.block_hash = S.block_hashAND T.log_index = S.log_indexAND T.block_timestamp = S.block_timestampWHERE S.block_timestamp BETWEEN TIMESTAMP '2020-10-05' AND TIMESTAMP '2020-12-07'
And you can check the query plan to verify that BigQuery pushed down the partition filter from one table to another.
Moreover, for SELECT statements, BigQuery can automatically infer a filter predicate on a join column and push it down from one table to another if your query meets the following criteria:
- The target table must be clustered or partitioned.
- The result size of the other table, i.e. after applying all filters, must qualify for broadcast join. Namly, the result set must be relatively small, less than ~100MB.
In our running example, reporting.base_table is partitioned by block_timestamp. If you define a selective filter on staging.load_delta and join two tables, you can see an inferred filter on the join key pushed to the target table
SELECT *FROM reporting.base_table TINNER JOIN staging.load_delta SON T.block_timestamp = S.block_timestampWHERE S.block_hash = '0x0c1caa16b34d94843aabfebc0d5a961db358135988f7498a6fdc450ad55f0870'
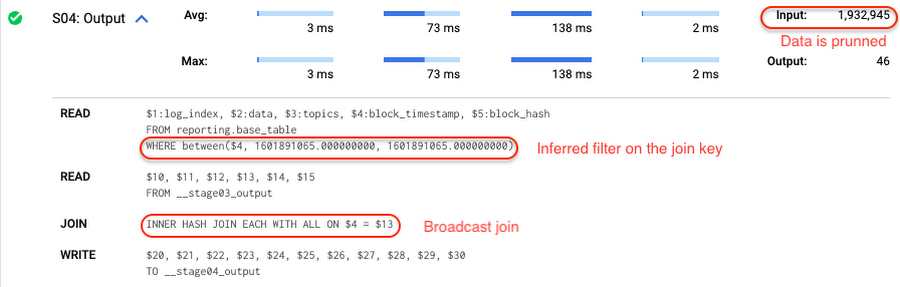
There is no requirement to join tables by partitioning or clustering key to kick off this type of optimization. However, in this case the pruning effect on the target table would be less significant.
But let us get back to the pipeline optimizations. Another way to enhance MERGE is to modify the merge_condition filter by adding static predicate on the base table:
BEGINDECLARE src_range STRUCT<date_min TIMESTAMP, date_max TIMESTAMP> --115 MB processedDEFAULT(SELECT STRUCT(MIN(block_timestamp) AS date_min,MAX(block_timestamp) AS date_max) FROM staging.load_delta);MERGE INTO reporting.base_table T --41 GB processedUSING staging.load_delta SON T.block_hash = S.block_hashAND T.log_index = S.log_indexAND T.block_timestamp BETWEEN src_range.date_min AND src_range.date_maxWHEN MATCHED THEN UPDATE SETT.data = S.dataWHEN NOT MATCHED THEN INSERT (log_index, data, topics, block_timestamp, block_hash)VALUES (log_index, data, topics, block_timestamp, block_hash);END;
To summarize, here are the steps that you can perform to enhance incremental ingestion pipelines in BigQuery. First you compute the range of updated partitions based on the small staging table. Next, you tweak the MERGE statement a bit to let BigQuery know to prune data in the base table.
All the enhanced MERGE statements scanned 41 GB of data, and setting up the src_range variable took 115 MB. Compare it with the initial 161 GB scan. Moreover, given that computing src_range may be incorporated into some existing transformation in your ETL/ELT, it results in a good performance improvement which you can leverage in your pipelines.
In this post we described how to enhance data ingestion pipelines by turning dynamic filter predicates into static predicates and letting BiQuery prune data for us. You can find more tips on BigQuery DML tuning here.
Special thanks to Daniel De Leo, who helped with examples and provided valuable feedback on this content.
Quantum Metric Increases Business 10-fold

9246
Of your peers have already read this article.
5:30 Minutes
The most insightful time you'll spend today!
At Quantum Metric, we’re in the business of bringing our customers business insights that are based on customer experience data and analytics for mid-market and Fortune 500 companies.
Our software, powered by big data, machine intelligence, and Google Cloud, helps our customers identify, quantify, prioritize and measure opportunities to improve digital experiences.
As companies move to a more agile product lifecycle, including continuous deployment and continuous integration, they’re finding that it’s critical to receive perpetual quantified feedback and insights from their data in real time to understand where the largest opportunities exist.
Each year, billions of customer interactions are captured through browsers or mobile apps on PCs, tablets, and mobile devices. This data, fed into the Quantum Metric platform, can show if a customer had a password problem they couldn’t solve or struggled when trying to purchase something and abandoned their cart.
It also can show if the customer tried in vain to complete an online change to their service provider’s subscription, to reach tech support, or couldn’t find the size or color they were looking for while shopping online.
Most importantly, the Quantum Metric platform quantifies the business value of the issue, helping organizations prioritize where they can make the largest impact to their business.
Success overwhelms our initial architecture
Initially, the Quantum Metric experience analytics software ran on a MySQL open source relational database management system (RDBMS). The MySQL RDBMS worked great for simple queries, when there was a specific question to ask of the data.
Soon, though, we knew we needed to offer more advanced data science capabilities. Our bigger customers wanted to ask questions across very large data sets—days, weeks, months, and years worth of data. They wanted to pose iterative questions using complex filters to answer their most challenging business questions.
With more complex queries across more data, response times from our RDBMS went from 100 to 500 milliseconds to as long as 20 minutes.
That delay was slowing down our ability and time to insights, which also reduced the value we could provide to our customers, since iterative exploration and analysis requires real-time query responses. Because of the need for real-time responses, there were certain questions that we just weren’t able to ask of the data. It became clear that we needed a much more robust data warehouse solution.
There were also operational challenges with MySQL and massive-scale data ingestion. We spent a lot of time into the wee hours of the night and morning handling errors and recovering databases.
We tried to address these challenges by sharding, partitioning, and indexing the data to optimize for the types of questions customers were asking. But the problems were escalating and happening more often, from once a month across the customer base to monthly for at least 20 different customers.
We could tune the platform for today and tomorrow’s workload, with good guesses at where indexes could be used, but we simply couldn’t continue to horizontally scale MySQL in a cost-efficient and operationally efficient manner.
Speed breeds innovation
Once we started exploring options that could better scale with our business, we looked at NoSQL technologies like Cassandra (a partitioned row-store database), MySQL’s Column Store (a columnar store database), and Vertica (a columnar store database)—each with unique ways of handling data storage and accessibility.
But with high volumes of complex queries across large data stores, all of these solutions began to fail, bogged down with multiple, simultaneous users. We could have solved the problems with more raw compute and storage, but it would have been prohibitively expensive to run and require a large team to operate.
We then decided to try BigQuery, and it was transformative.
We connected our front end to BigQuery via APIs. Once data is 15 minutes old, it is automatically extracted, loaded, and transformed (ETL) to BigQuery.
We continuously update the legacy MySQL RDBMS so its data is integrated with BigQuery data when queries require real-time data. Most query response times are within 100-200 milliseconds, matching what we initially experienced with MySQL.
When traffic from our customers scales up, we can now scale on-demand to accommodate it, thanks to BigQuery’s hundreds of thousands of CPUs. Our customers no longer run into slow response times, and we’ve gained confidence that we can offer them—and their users—advanced insights and better experiences without delay.
More importantly, with this scale of query power, we were able to build data science algorithms into the platform, which iteratively query BigQuery based on the results, and help quantify the impact of a specific issue to a specific segment of users. Adding these capabilities was possible because of the massive scale of BigQuery.
In addition to new insights and fast response times, we wanted our customers to be able to ask complex questions using very simple language.
For example: “Show me high-loyalty customers, located in specific geographic areas, who visited the web site at least five times, based on specific campaigns, and never booked a seat on a flight.”
This was exactly the kind of query that was used by a major U.S. airline to understand the multi-million dollar impact of a failure affecting their most valuable customers: their high-loyalty members.
And this was all done while maintaining the highest standard of care of customer data and privacy by default, using multiple layers of encryption of data in transit, at rest, and a unique military-grade encryption approach. This approach encrypts PII, including even session cookies, with a RSA-2048 key available only to a select few and used for use cases such as fraud analysis.
It’s no exaggeration to say that BigQuery has totally transformed our business. It provides the petabyte scale and speed we were missing, in addition to taking care of operational maintenance, a task that was burying our team with MySQL.
We’re now able to support some of the largest companies in the world that require real-time, petabyte-scale analytics. That lets them serve more customers faster with higher quality, and take advantage of BigQuery’s power and scale to innovate.
There are other cloud solutions that can address petabyte analytics, but the most unique value proposition of BigQuery was its on-demand scaling and operational management, with extremely cost-effective pay-as-you-go billing. While today we are at a scale where we have round-the-clock querying needs, our early days had very sporadic query loads where we needed instant scale, then a long lull of nothing. The unique business model of BigQuery’s pay-by-bytes-scanned allowed us to have access to a massive-scale querying platform without breaking the bank.
Using BigQuery powers better customer experience and reduces purchasing friction
Among the many features of Quantum Metric is the ability to replay online customer sessions. In the example below from a mobile e-commerce site, each action is displayed chronologically. Why did this customer’s transaction fail?
Diving deeper, the session replay shows that the user tried to change the item quantity in the checkout cart, which resulted in a failed API call. Powered by BigQuery, Quantum Metric can then show how many other end users had this issue, with a simple click of “Show More Errors Like This.”
With BigQuery’s massive scale, Quantum Metric will then quantify the impact of that issue, so companies can prioritize which issues need attention immediately. If this is the issue that’s impacting the business the most, our customer can use a single click to open a Jira ticket, forwarding the discovery to their product and engineering teams. Those teams can then re-engineer the experience in near-real time, addressing the failed API call and cutting out the frustrating time it takes for engineers to reproduce the issue.
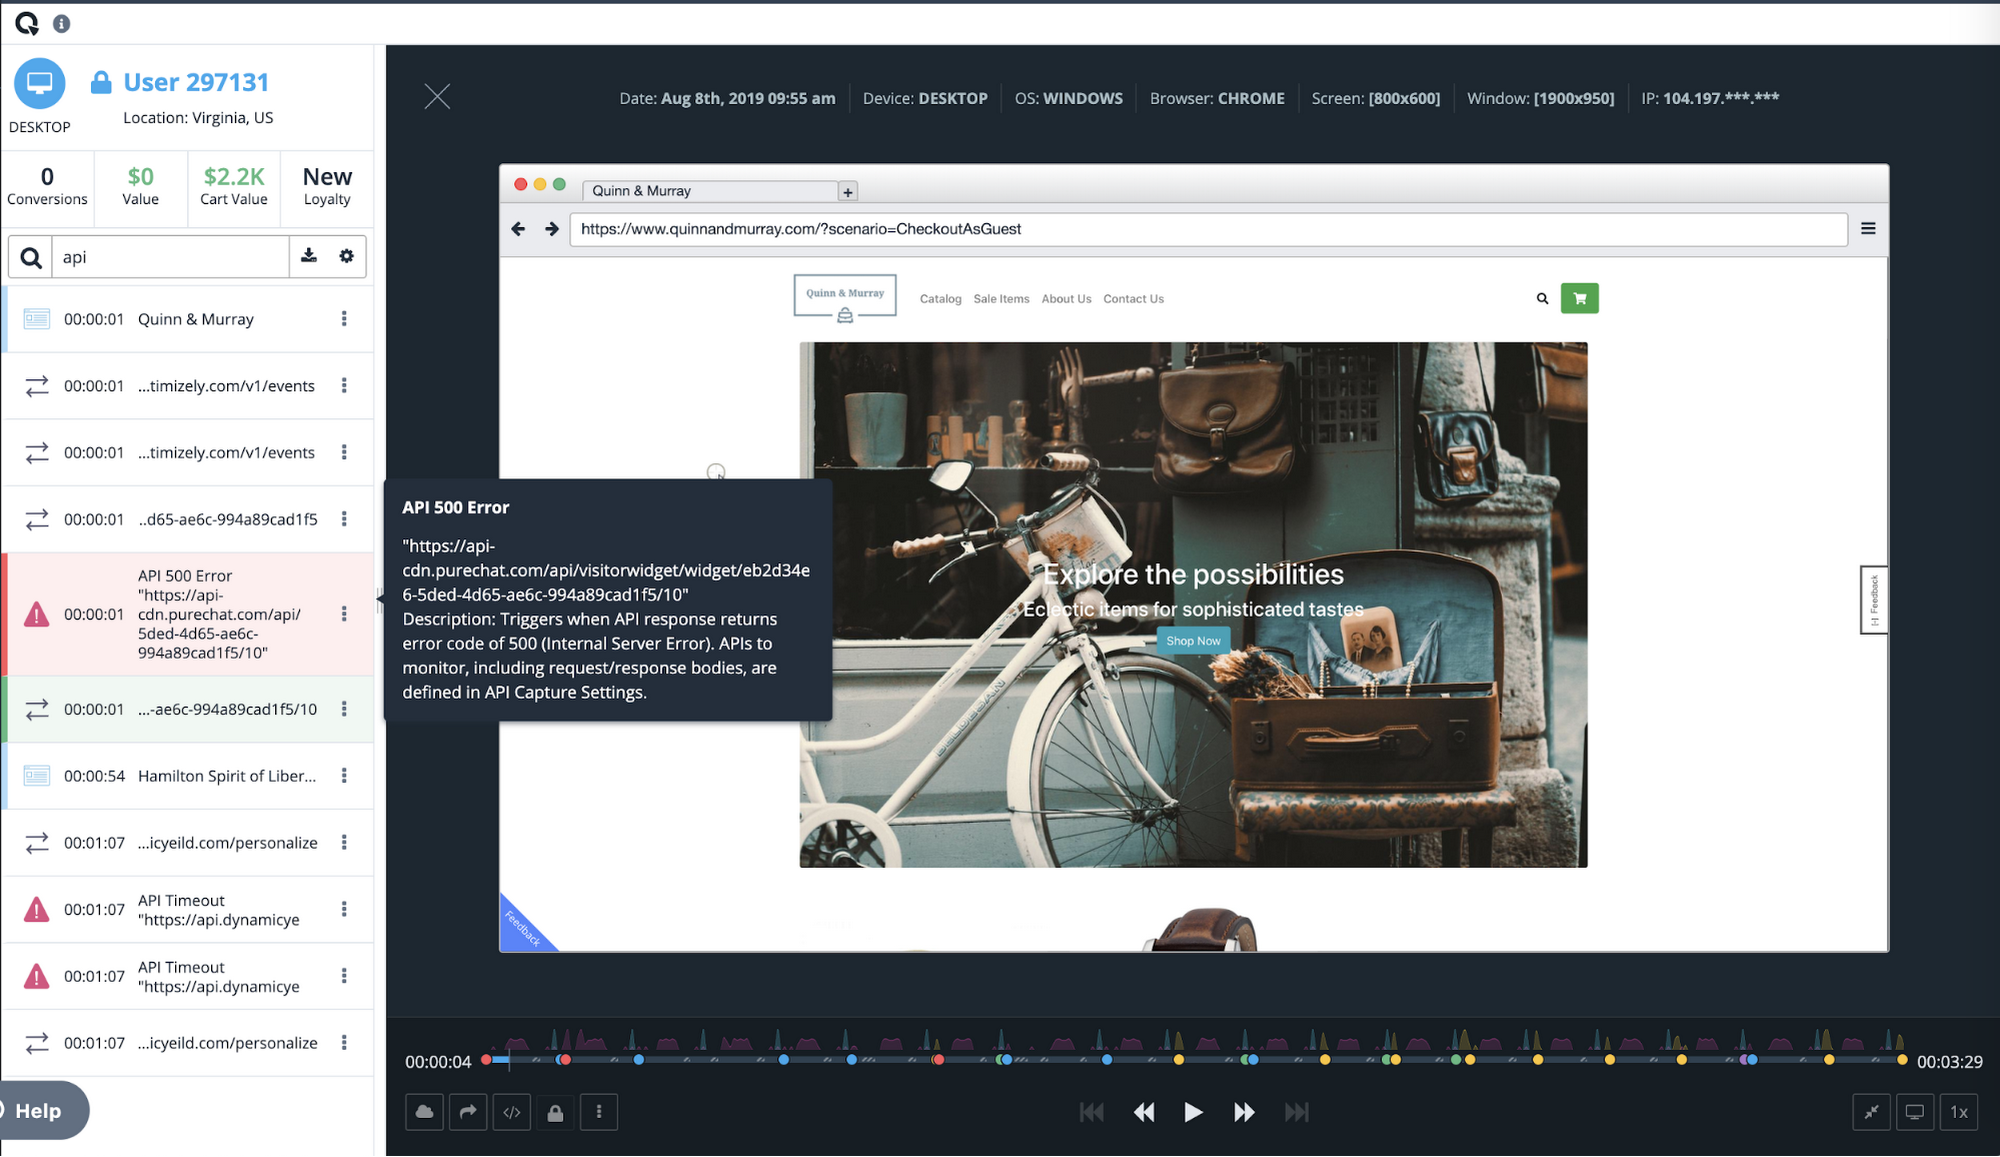
Once we had a powerful back end in BigQuery, we realized that Quantum Metric’s platform could be used to ask complex questions from vast datasets. We built some of the processes that data scientists use to formulate those queries right into our product.
For example, we added one series of processes to our platform to help customers understand whether a suspect issue is really impacting end-user experience. Is it something that should be prioritized and fixed? Does this really affect the user experience? Does it have financial impact? These and other questions can be pre-defined as a complex query in Quantum Metric to let our customer quickly gain insight on how an issue is impacting the business. Customers were blown away when they heard this was possible. It was the holy grail for what they were looking for in data science. It really sets us apart from our competition.
Today, with every company heavily dependent on data, those companies that can uncover and act on insights fastest are the ones that will succeed. BigQuery gives us the data warehouse platform we need to provide our customers with fast, reliable technology tools. It frees us from having to deal with the minutiae of technology infrastructure operations, so we can focus on finding and extracting the magic in customer data. With the power and scale of BigQuery, combined with the real-time capture of every user experience with 100% fidelity, we’re able to offer a self-service analytics platform that provides insights into digital journey friction points and acts as the indisputable arbitrator of truth.
More Relevant Stories for Your Company

BigQuery Omni: A Game-Changer for Cross-Cloud Data Analysis
Research shows that over 90% of large organizations already deploy multicloud architectures, and their data is distributed across several public cloud providers. Additionally, data is also increasingly split across various storage systems such as warehouses, operational and relational databases, object stores, etc. With the proliferation of new applications, data is

2022 Healthcare Trends: Healthcare Data, M&As, Better Patient Care, AI in Drug Development & Strategic Partnerships
The COVID-19 pandemic continues to push the healthcare and life sciences industry in entirely new ways. In record time, we’ve witnessed public health officials, vaccine developers, equipment manufacturers, and essential workers take life saving actions—regularly putting their own lives at risk—to respond to the exceptional challenges of our time. Yet

Unification of Dataplex and Data Catalog: A Full Spectrum of Data Governance and Data Management at Scale
Today, we are excited to announce that Google Cloud Data Catalog will be unified with Dataplex into a single user interface. With this unification, customers have a unified experience to search and discover their data, enrich it with relevant business information, organize it by logical data domains, and centrally govern

Google Cloud’s Firebase Realtime Database and BigQuery AllowsCastbox to Ramp Up Customer Experience
Demand for spoken audio content such as podcasts remains robust despite the proliferation of video services and other entertainment options for consumers. Shibin Li, Co-founder of Castbox, credits growth of the global podcast platform to the following: speed and availability, market-leading features, the proliferation of smart devices to deliver audio content,
