





BigQuery Omni: A Game-Changer for Cross-Cloud Data Analysis

3066
Of your peers have already read this article.
4:00 Minutes
The most insightful time you'll spend today!
Research shows that over 90% of large organizations already deploy multicloud architectures, and their data is distributed across several public cloud providers. Additionally, data is also increasingly split across various storage systems such as warehouses, operational and relational databases, object stores, etc. With the proliferation of new applications, data is serving many more use cases such as data sciences, business intelligence, analytics, streaming and the list goes on. With these data trends, customers are increasingly gravitating towards an open multicloud data lake. However, multicloud data lakes present several challenges such as data silos, data duplication, fragmented governance, complexity of tools, and increased costs.
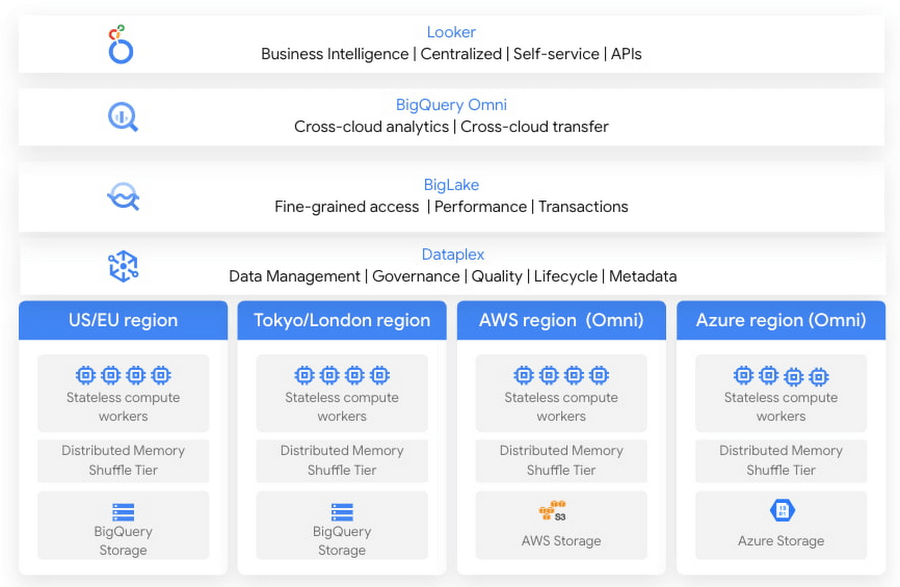
With Google’s data cloud technologies, customers can leverage the unique combination of distributed cloud services. They can create an agile cross-cloud semantic business layer with Looker and manage data lakes and data warehouses across cloud environments at scale with BigQuery and capabilities like BigLake and BigQuery Omni.
BigLake is a storage engine that unifies data warehouses and lake houses by standardizing across different storage formats including BigQuery managed table and open file formats such as Parquet and Apache Iceberg on object storage. BigQuery Omni provides the compute engine that runs locally to the storage on AWS or Azure, which customers can use to query data in AWS or Azure seamlessly. This provides several key benefits such as:
- A single pane of glass to query your multicloud data lakes (across Google Cloud Platform, Amazon Web Services, and Microsoft Azure)
- Cross-cloud analytics by combining data across different platforms with little to no egress costs
- Unified governance and secure management of your data wherever it resides
In this blog, we will share cross-cloud analytics use cases customers are solving with Google’s Data Cloud and the benefits they are realizing.
Unified marketing analytics for 360-degree insights
Organizations want to perform marketing analytics – ads optimization, inventory management, churn prediction, buyer propensity trends and many more such analytics. To do this before BigQuery Omni, customers had to use data from several different sources such as Google Analytics, public datasets and other proprietary information stored across cloud environments. This requires moving large amounts of data, managing duplicate copies and incremental costs to perform any cross-cloud analytics and derive actionable insights. With BigQuery Omni, organizations are able to greatly simplify this workflow. Using the familiar BigQuery interface, users can access data residing in AWS or Azure, discover and select just the relevant data that needs to be combined for further analysis. This subset of data can be moved to Google Cloud using Omni’s new Cross-Cloud Transfer capabilities. Customers can combine this data with other Google Cloud datasets and these consolidated tables can be made available to key business stakeholders through advanced analytics tools such as Looker and Looker Studio. Customers are also able to tie in this data now with world class AI models via Vertex AI.
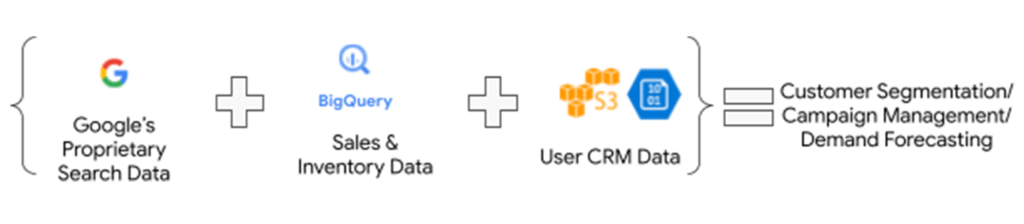
As an illustrative example, consider a retailer who has sales & inventory, user and search data spread across multiple data silos. Using BigQuery Omni they can seamlessly bring these datasets together and power several marketing analytics scenarios like customer segmentation, campaign management and demand forecasting etc.
“Interested in performing cross-cloud analytics, we tested BigQuery Omni and really liked the SQL support to easily get data from AWS S3. We have seen great potential and value in BigQuery Omni for adopting a multi-cloud data strategy.” — Florian Valeye, Staff Data Engineer, Back Market, a leading online marketplace for renewed technology based out of France
Data platform with consistent and unified cross-cloud governance
Another pattern is customers looking to analyze operational, transactional and business data across data silos in different clouds through a unified data platform. These data silos are a result of various factors such as merger and acquisitions, standardization of analytical tools, leveraging best of breed solutions in different clouds and diversification of data footprint across clouds. In addition to a single pane of glass for data access across silos, customers deeply desire consistent and uniform governance of their data across clouds.
“Achieve is looking to deliver a consistent analytics experience to all our customers and stakeholders. With our financial and credit report data distributed across clouds, accessing and getting insights holistically is difficult. Through our exploration with Omni, we are able to access datasets in different clouds using a single familiar BigQuery interface; we see its promise as one of the primary tools in our multi-cloud platform.” — James Simonson, Senior Data Engineer, Achieve
With BigLake and BigQuery Omni abstracting the storage and compute layers respectively, organizations can access and query their data in Google Cloud irrespective of where it resides. They can also set fine-grained row level and column access policies in BigQuery and consistently govern it across clouds. These building blocks enable data engineering teams to build a unified and governed data platform for their data users without having to deal with the complexity of building and managing complex data pipelines. Furthermore, with BigQuery Omni’s integration with Dataplex and Data Catalog, you can discover, search your data across clouds and enrich your data by adding relevant business context with business glossary and rich text.
“Several SADA customers use GCP to build and manage their data analytics platform. During many explorations and proofs of concepts, our customers have seen the great potential and value in BigQuery Omni. Enabling seamless cross-cloud data analytics has allowed them to realize the value of their data quicker while lowering the barrier to entry for BigQuery adoption in a low-risk fashion.” — Brian Suk, Associate Chief Technology Officer, SADA, one of the strategic partners of Google Cloud.
Simplified data sharing between data providers and their customers
A third emerging pattern in cross cloud analytics is data sharing. Several services have the business need to share information such as inventory data, subscriber data to their customers or users who in turn analyze or aggregate the data with their proprietary data and oftentimes share the results back with the service provider. In several cases, the two parties are on different cloud environments, requiring them to move data back and forth.
Consider a company operating in the customer data platform (CDP) space. CDPs were designed to help activate customer data, and a critical first step of that was unifying and managing that customer data. To enable this, many CDP vendors built their solution choosing one of the available cloud infrastructure technologies and copied data from the client’s systems.“Copying data from client applications and infrastructure has always been a requirement to deploy a CDP, but it doesn’t have to be anymore” — Justin DeBrabant, Senior Vice President of Product, ActionIQ.
While a small percentage of customers are fine with moving data across cloud environments, the majority are hesitant to onboard new services and would rather prefer providing governed access to their data sets.
“A new architectural pattern is emerging, allowing organizations to keep their data at one location and make it accessible, with the proper guardrails, to applications used by the rest of the organization’s stack” adds Justin at ActionIQ.
With BigQuery Omni, services in Google Cloud Platform can more easily access and share data with their customers and users in other cloud environments with limited data movement. One of UK’s largest statistics providers has explored Omni for their data sharing needs.
“We tested BigQuery Omni and really like the ability to get data from AWS directly into BQ. We’re excited about managing data sharing with different organizations without onboarding new clouds” – Simon Sandford-Taylor, Chief Information and Digital Officer, UK’s Office for National Statistics
With BigQuery Omni, customers are able to:
- Access and query data across clouds through a single user interface
- Reduce the need for data engineering before analyzing data
- Lower operational overhead and risks by deploying an application that runs across multiple clouds which leverages the same, consistent security controls
- Accelerate access to insights by significantly reducing the time for data processing and analysis
- Create consistent and predictable budgeting across multiple cloud footprints
- Enable long term agility and maximize the benefits every cloud investment
Over the last year, we’ve seen great momentum in customer adoption and added significant innovations to BigQuery Omni including improved performance and scalability for querying your data in AWS S3 or Azure Blob Storage, Iceberg support for Omni, Larger query result set size up to 20GB and Cross-cloud transfer that helps customers easily, securely, and cost effectively move just enough data across cloud environments for advanced analytics.
BigQuery Omni has launched several features to support unified governance of your data across multiple clouds – you can get fine-grained access to your multi-cloud data with row level and column level security. Building on this, we are excited to announce that BigQuery Omni now supports data masking. We’ve also made it easy for customers to try and see the benefits of BigQuery Omni through the limited time free trial available until March 30, 2023.
BigQuery Omni running on other public clouds outside of Google Cloud is available in AWS US East1 (N.Virginia) and Azure US East2 (US East) regions. We are also excited to share that we will be bringing BigQuery Omni to more regions in the future, starting with Asia Pacific (AWS Korea) coming soon.
Getting Started
Get started with a free trial to learn about Omni. Check out the documentation to learn more about BigQuery Omni. You can also leverage the self paced labs to learn how to set up BigQuery Omni easily.

Takeaways from Forrester’s Cloud Data Warehouse Q1 2021 Report
DOWNLOAD RESEARCH REPORTS5134
Of your peers have already downloaded this article
20:00 Minutes
The most insightful time you'll spend today!
Cloud data warehouse (CDW) solutions have transformed the delivery of modern analytics and are known to have the capabilities to provision data warehouse of any size in a matter of minutes, autotune queries, scale resources including compute and storage on demand and auto-upgrade to the latest version. As the need for integrated, real-time and self-service analytics scale, CDW vendors continue to focus on native integration with data lakes and object stores; self-service to simplify access and administration for larger and more complex warehouses; and advanced capabilities on parallel processing, compression, partitioning, indexing, query optimization, and dynamic resource provisioning. The most common CDW use cases include customer analytics, AI/machine learning (ML)-based analytics, vertical-specific analytics, and real-time analytics. Customers that are looking to select a CDW vendor need to consider couple of factors.
Download the report learn more 13 leading CDW providers in the Forrester Wave: Cloud Data Warehouse, Q1 2021 report and also explore Google Cloud’s BigQuery for data warehousing.
Groupe Dauphinoise Grows it Customer Base with G Suite and Google Cloud Platform

10378
Of your peers have already read this article.
2:45 Minutes
The most insightful time you'll spend today!
As a leading French agricultural cooperative, Groupe Dauphinoise places collaboration at the heart of its philosophy. Working with farmers in the Rhone-Alpes region, Groupe Dauphinoise takes on a diverse range of activities from agricultural production to research and development to running retail outlets.
As its operations expanded and strained its existing infrastructure, Groupe Dauphinoise saw the opportunity to upgrade its technology solutions and adopted G Suite, Chrome devices and ultimately Google Cloud Platform (GCP).
“We transitioned to G Suite to improve our staff’s collaboration. We quickly realized that as the company grew, we needed a new infrastructure. Based on our satisfaction with G Suite, we chose GCP. With Google, ‘any device, anytime, anywhere’ is not just a dream,” says Sylvain Claudel, Head of IT at Groupe Dauphinoise.
“We transitioned to G Suite to improve our staff’s collaboration. We quickly realized that as the company grew, we needed a new infrastructure. Based on our satisfaction with G Suite, we chose GCP. With Google, ‘any device, anytime, anywhere’ is not just a dream.”
—Sylvain Claudel, Head of IT, Groupe Dauphinoise
Flexible workforce, stable infrastructure
Many of Groupe Dauphinoise’s 1,500 employees spend their days out of the office. Five years ago, with the help of Google partner GoWizYou, the company transitioned to G Suite to improve the flexibility and collaboration of its staff.
As Groupe Dauphinoise began to expand and collect more data, the company reached the limits of its on-premise infrastructure. Adding new storage was not a simple matter. Acquiring, configuring and synchronising new servers costs Groupe Dauphinoise time as well as money. In addition, with all its servers stored in a single room, security was a concern. Groupe Dauphinoise needed a new infrastructure.
Google Cloud Platform was the only solution in mind after Groupe Dauphinoise’s experience with G Suite and Chromebooks. Disruption was kept to a minimum thanks to Google’s licensing agreements with Microsoft products, allowing the company to migrate without affecting its operations.
After migrating its infrastructure to Compute Engine, Groupe Dauphinoise can let Google look after the security and maintenance. Cloud IAM makes it easy for Groupe Dauphinoise to hand out permissions to sensitive resources across a number of sites with maximum security and minimum fuss. The company placed its archives in Cloud Storage, while Cloud SQL allows it to continue to make use of its MySQL databases without disrupting the day to day business. Meanwhile, BigQuery provides Groupe Dauphinoise with the raw power to analyse large datasets quickly.
“Our company is growing and we have more and more data to collect and analyze like sales data, weather patterns or production numbers. With GCP, we have more than a single on-premise data store, so our disaster recovery plan is much more flexible. Compute Engine allows us to add more storage quickly and easily, without having to spend days synchronizing data and installing new servers. We have improved security and maintained the stability of our infrastructure while keeping costs down,” says Sylvain.
Safeguarding the present, looking to the future
With Google Cloud Platform, Groupe Dauphinoise has expanded and secured its infrastructure without sinking costs into on-premise servers or DevOps staff. Its investment in Chrome devices and adoption of G Suite mean that its mobile workforce can fully reap the benefits of a cloud-based infrastructure while dramatically cutting the cost of hardware. Meanwhile, working with a 200 million line table of sales data in Google BigQuery, the cooperative found that queries ran ten times faster than with its previous database provider. Groupe Dauphinoise is experimenting with Google BigQuery to expand its BI capabilities. Products like Google BigQuery help Groupe Dauphinoise grow its business, safe in the knowledge that its infrastructure is stable and secure.
“The amount of data we collect is growing very quickly. We need to break our rules and evolve from the mindset that we had with on-premise infrastructure and our old databases. We can now look at collecting more customer fidelity data, or big data for our farmers. With our data and infrastructure in Google’s care, we can concentrate on growing our customer base instead of our IT department!” says Sylvain.
Home Depot Leverages Google Cloud’s BigQuery and DataFlow to Break Data Silos and Craft Personalized CX

4996
Of your peers have already read this article.
4:00 Minutes
The most insightful time you'll spend today!
The Home Depot, Inc., is the world’s largest home improvement retailer with annual revenue of over $151B. Delighting our customers—whether do-it-yourselfers or professionals—by providing the home improvement products, services, and equipment rentals they need, when they need them, is key to our success.
We operate more than 2,300 stores throughout the United States, Canada, and Mexico. We also have a substantial online presence through HomeDepot.com, which is one of the largest e-commerce platforms in the world in terms of revenue. The site has experienced significant growth both in traffic and revenue since the onset of Covid-19.
Because many of our customers shop at both our brick-and-mortar stores and online, we’ve embarked on a multi-year strategy to offer a shopping experience that seamlessly bridges the physical and digital worlds. To maximize value for the increasing number of online shoppers, we’ve shifted our focus from event marketing to personalized marketing, as we found it to be far more effective in improving the customer experience throughout the sales journey. This led to changing our approach to marketing content, email communications, product recommendations, and the overall website experience.
Challenge: launching a modern marketing strategy using legacy IT
For personalized marketing to be successful, we had to improve our ability to recognize a customer at the point of transaction so we could—among other things—suspend irrelevant and unnecessary advertising. Most of us have experienced the annoyance of receiving ads for something we’ve already purchased, which can degrade our perception of the brand itself. While many online retailers can identify 100% of their customer transactions due to the rich information captured during checkout, most of our transactions flow through physical stores, making this a more difficult problem to solve.
Our old legacy IT system, which ran in an on-premises data center and leveraged Hadoop, also challenged us since maintaining both the hardware and software stack required significant resources. When that system was built, personalized marketing was not a priority, so it took several days to process customer transaction data and several weeks to roll out any system changes. Further, managing and maintaining the large Hadoop cluster base presented its own set of issues in terms of quality control and reliability, as did keeping up with open-source community updates for each data processing layer.
Adopting a hybrid approach
As we worked through the challenges of our legacy system, we started thinking about what we wanted our future system to look like. Like many companies, we began with a “build vs. buy” analysis. We looked at several products on the market and determined that while each of them had their strengths, none was able to offer the complete set of features we needed.
Our project team didn’t think it made sense to build a solution from scratch, nor did we have access to the third-party data we needed. After much consideration, we decided to adopt a solution that combined a complete rewrite of the legacy system with the support of a partner to help with the customer transaction matching process.
Building the foundation on Google Cloud
We chose Google Cloud’s data platform, specifically BigQuery, Dataflow, DataProc, Cloud Storage, and Cloud Composer. Google Cloud platform empowered us to break down data silos and unify each stage of the data lifecycle from ingestion, storage, and processing to analysis and insights. Google Cloud offered best-in-class integration with open-source standards and provided the portability and extensibility we needed to make our hybrid solution work well. The open standards of BigQuery’s BQ Storage API allowed us to leverage fast BQ storage layers to be utilized with other compute platforms, e.g., DataProc.
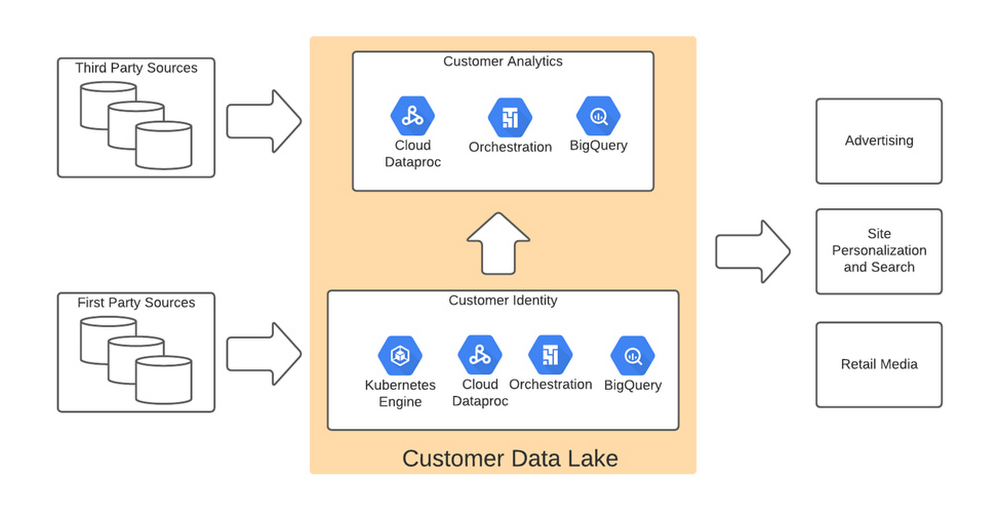
We used BigQuery combined with Dataflow to integrate our first- and third-party data into an enterprise data and analytics data lake architecture. The system then combined previously siloed data and used BigQuery ML to create complete customer profiles spanning the entire shopping experience, both in-store and online.
Understanding the customer journey with the help of Dataflow and BigQuery
The process of developing customer profiles involves aggregating a number of first- and third-party data sources to create a 360-degree view of the customer based on both their history and intent. It starts with creating a single historical customer profile through data aggregation, deduplication, and enrichment. We used several vendors to help with customer resolution and NCOA (Change of Address) updates, which allows the profile to be house-holded and transactions to be properly reconciled to both the individual and the household. This output is then matched to different customer signals to help create an understanding of where the customer is in their journey—and how we can help.
The initial implementation used Google Dataflow, Google’s streaming analytics solution, to load data from Google Cloud Storage into BigQuery and perform all necessary transformations. The Dataflow process was converted into BQML (BigQuery Machine Learning) since this significantly reduced costs and increased visibility into data jobs. We used Google Cloud Composer, a fully managed workflow orchestration service, to help orchestrate all data operations and DataProc and Google Kubernetes Engine to enable special case data integration so we could quickly pivot and test new campaigns. The architecture diagram below shows the overall structure of our solution.
Taking full advantage of cloud-native technology
In our initial migration to Google Cloud, we moved most of our legacy processes in their original form. However, we quickly learned that this approach didn’t take full advantage of the cloud-native and more improved features Google Cloud offered such as auto scaling of resources, flexibility to decouple storage from the compute layer, and a wide variety of options to choose the best tool for the job. We refactored our Hadoop-based data pipelines written in Java-based Map Reduce and our Pig Latin jobs to Dataflow and BigQuery jobs. This dramatically reduced processing time and made our data pipeline code concise and efficient.
Previously, our legacy system processes ran longer than intended, and data was not used efficiently. Optimizing our code to be cloud-native and leveraging all the capabilities of Google Cloud services resulted in reduced run times. We decreased our data processing window from 3 days to 24 hours, improved resource usage by dramatically reducing the amount of compute we used to possess this data, and built a more streamlined system. This in turn reduced cloud costs and provided better insight. For example, DataFlow offers powerful native features to monitor data pipelines, enabling us to be more agile.
Leveraging the flexibility and speed of the cloud to improve outcomes
Today, using a continuous integration/continuous delivery (CI/CD) approach, we can deploy multiple system changes each week to further improve our ability to recognize in-store transactions. Leveraging the combined capabilities of various Google Cloud systems—BigQuery, DataFlow, Cloud Composer, Dataproc, and Cloud Storage–we drastically increased our ability to recognize transactions and can now connect over 75% of all transactions to an existing household. Further, the flexible Google Cloud environment coupled with our cloud-native application makes our team more nimble and better able to respond to emerging problems or new opportunities.
Increased speed has led to better outcomes in our ability to match transactions across all sales channels to a customer and thereby improve their experience. Before moving to Google Cloud, it took 48 to 72 hours to match customers to their transactions, but now we can do it in less than 24 hours.
Making marketing more personal—and more efficient
The ability to quickly match customers to transactions has huge implications for our downstream marketing efforts in terms of both cost and effectiveness. By knowing what a customer has purchased, we can turn off ads for products they’ve already bought or offer ads for things that support what they’ve bought recently. This helps us use our marketing dollars much more efficiently and offer an improved customer experience.
Additionally, we can now apply the analytical models developed using BQML and Vertex AI to sort customers into audiences. This allows us to more quickly identify a customer’s current project, such as remodeling a kitchen or finishing a basement, and then personalize their journey by offering them information on products and services that matter most at a given point through our various marketing channels. This provides customers with a more relevant and customized shopping journey that mirrors their individual needs.
Protecting a customer’s privacy
With this ability to better understand our customers, we also have the responsibility to ensure we have good oversight and maintain their data privacy. Google’s cloud solutions provide us the security needed to help protect our customers’ data, while also being flexible enough to allow us to support state and federal regulations, like the California Customer Privacy Act. This way we can provide a customer the personalized experience they desire without having to fear how their data is being used.
With flexible Google Cloud technology in place, The Home Depot is well positioned to compete in an industry where customers have many choices. By putting our customers’ needs first, we can stay top of mind whenever the next project comes up.
Google Cloud Tools Help U.S. Forest Department Generate Years of Insights into Earth’s Natural Resources

5015
Of your peers have already read this article.
3:00 Minutes
The most insightful time you'll spend today!
For 117 years, the U.S. Department of Agriculture’s Forest Service has been a steward of America’s forests, grasslands, and waterways. It directly manages 193 million acres and supports sustainable management on a total of 500 million acres of private, state, and tribal lands. Its impact reaches far beyond even that, offering its research and learning freely to the world.
At Google, we’re big admirers of the Forest Service’s mission. So we were thrilled to learn in 2011 that its scientists were using Google Earth Engine, our planetary-scale platform for Earth Science data and analysis, to aid its research, understanding, and effectiveness. In the years since, Google has worked with the Forest Service to meet its unique requirements for visual information about the planet. Using both historical and current data, the Forest Service built new products, workflows, and tools that help more effectively and sustainably manage our natural resources. The Forest Service also uses Earth Engine and Google Cloud to study the effects of climate change, forest fires, insects and disease, helping them create new insights and strategies.
Besides gaining newfound depths of insight, the Forest Service has also sped up its research dramatically, enabling everyone to do more. Using Google Cloud and Earth Engine, the Forest Service reduced the time it took to analyze 10 years worth of land-cover changes from three months to just one hour, using just 100 lines of code. The agency built new models for coping with change, then mapped these changes over time, in its Landscape Change Monitoring System (LCMS) project.
Emergency responders can now work better on new threats that arise after wildfires, hurricanes, and other natural disasters. Forest health specialists can detect and monitor the impacts of invasive insects, diseases, and drought. More Forest Service personnel can use new tools and products within Earth Engine, thanks to numerous training and outreach sessions within the Forest Service.
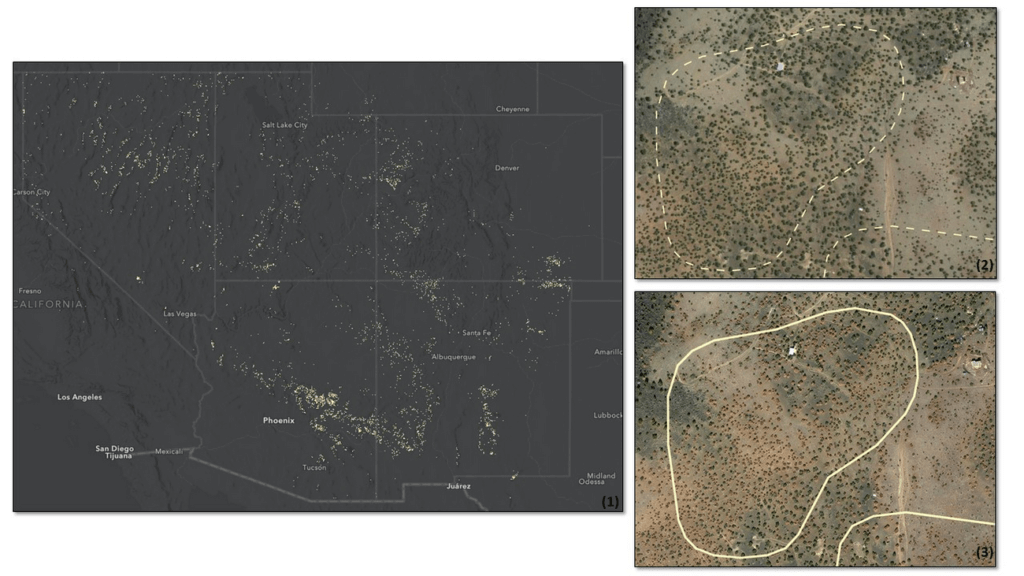
Researchers elsewhere also benefited when the Forest Service created new toolkits, and posted them to GitHub for public use. For example, there’s geeViz, a repository of Google Earth Engine Python code modules useful for general data processing, analysis, and visualization.
This is only the start. Recently, the Forest Service started using Google Cloud’s processing and analysis tools for projects like California’s Wildfire and Forest Resilience Action Plan. Forest Service researchers also use Google Cloud to better understand ecological conditions across landscapes in projects like Fuelcast, which provides actionable intelligence for rangeland managers, fire specialists, and growers, and the Scenario Investment Planning Platform for modeling local and national land management scenarios.
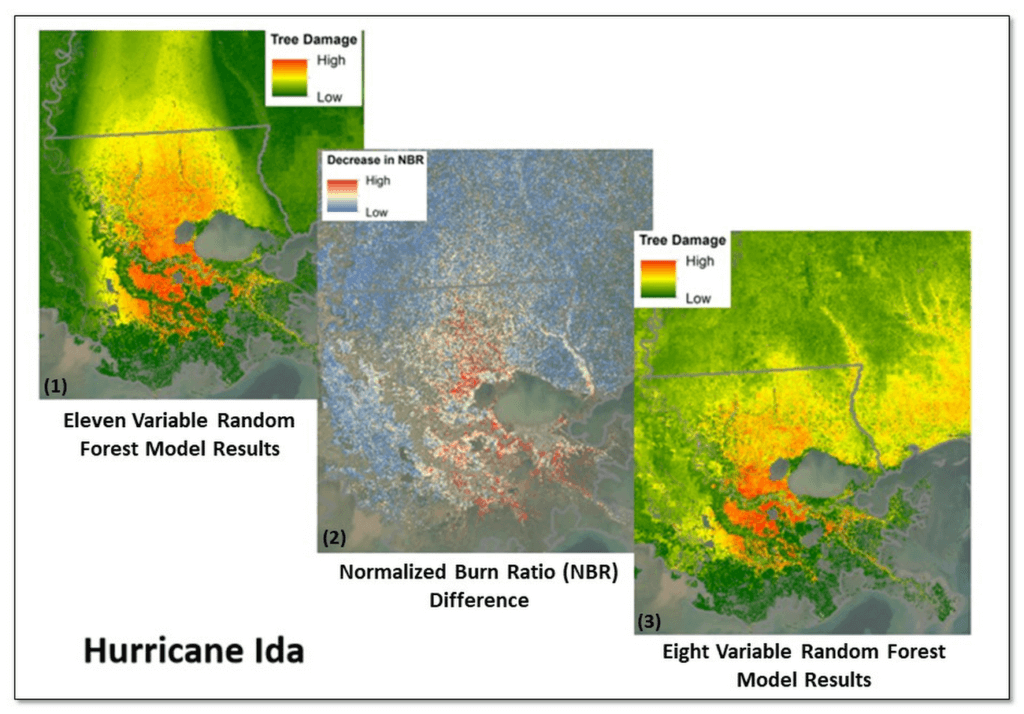
The Forest Service is a pioneer in building technology to help us better understand and care for our planet. With more frequent imaging, rich satellite data sets, and sophisticated database and computation systems, we can view and model the Earth as a large-scale dynamic system.
We are honored and excited to respond to the unique set of requirements of the scientists, engineers, rangers, and firefighters of the USFS, and look forward to years of learning about — and better caring for — our most precious resources.
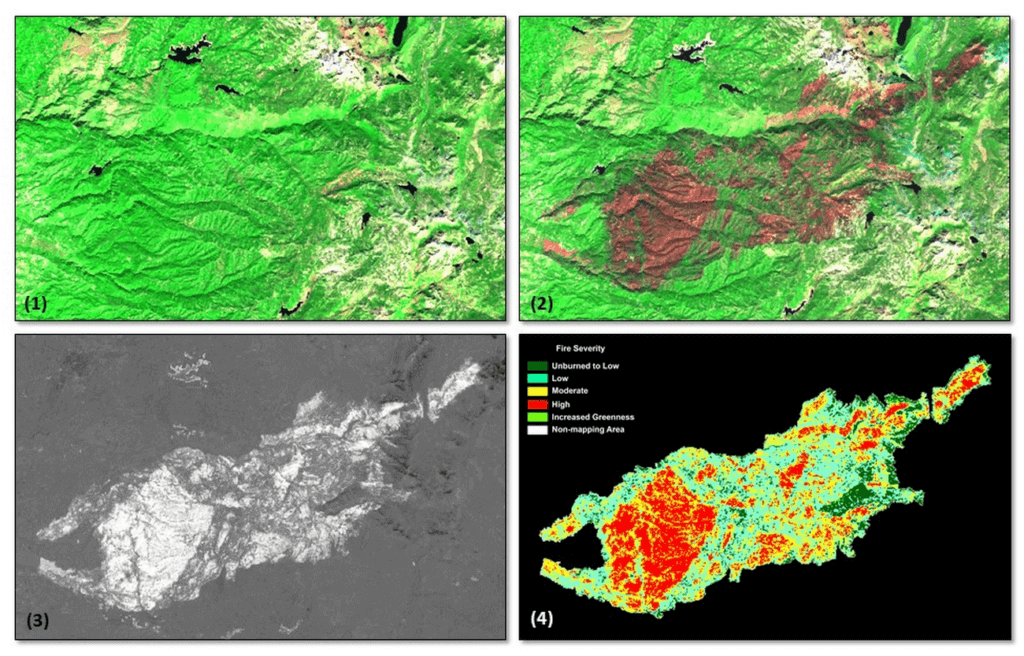
*Image 1: The USDA Forest Service (USFS) Geospatial Technology and Applications Center (GTAC) uses science-based remote sensing methods to characterize vegetation and soil condition after wildland fire events. The results are used to facilitate emergency assessments to support hazard mitigation, to inform post-fire restoration planning, and to support the monitoring of national fire policy effectiveness. GTAC currently conducts these mapping efforts using long-established geospatial workflows. However, GTAC has adapted its post-fire mapping and assessment workflows to work within Google Earth Engine (GEE) to accommodate the needs of other users in the USFS. The spatially and temporally comprehensive coverage of moderate resolution multispectral data sources (e.g., Landsat, Sentinel 2) and analytical power provided by GEE allows users to create geospatial burn severity products quickly and easily. Box 1 shows a pre-fire Sentinel-2 false color composite image. Box 2 shows a post-fire Sentinel-2 false color composite image with the fire scar apparent in reddish brown. Box 3 shows a differenced Normalized Burn Ratio (dNBR) image showing the change between the pre- and post-fire images in Boxes 1 and 2. Box 4 shows a thresholded dNBR image of the burned area with four classes of burn severity (unburned to high severity), which is the final output delivered to forest managers.
*Image 2: Leveraging Google Earth Engine (GEE), the USDA Forest Service (USFS) Geospatial Technology and Applications Center (GTAC) and USFS Region 8, developed the Tree Structure Damage Impact Predictive (TreeS-DIP) modeling approach to predict wind damage to trees resulting from large hurricane events and produce spatial products across the landscape. TreeS-DIP results become available within 48 hours following landfall of a large storm event to allow allocation of ground resources to the field for strategic planning and management. Boxes 1 and 3 above show TreeS-DIP modeled outputs with varying data inputs and parameters. Box 2 shows changes in greenness (Normalized Burn Ratio; NBR) that was measured with GEE during the recovery from Hurricane Ida and is shown as a visual comparison to the rapidly available products from TreeS-DIP.
*Image 3: Severe drought conditions across the American West prompted concern about the health and status of pinyon-juniper woodlands, a vast and unique ecosystem. In a cooperative project between the USDA Forest Service (USFS) Geospatial Technology and Applications Center (GTAC) and Forest Health Protection (FHP), Google Earth Engine (GEE) was used to map pinyon pine and juniper mortality across 10 Western US States. The outputs are now being used to plan for future work including on-the-ground efforts, high-resolution imagery acquisitions, aerial surveys, in-depth mortality modeling, and planning for 2022 field season work.
Box 1 contains remote sensing change detection outputs (in white) generated with GEE, showing pinyon-juniper decline across the Southwestern US. Box 2 shows NAIP imagery from 2017 with, with box 3 showing NAIP imagery from 2021. NAIP imagery from these years shows trees changing from healthy and green in 2017 to brown and dying in 2021. In addition, box 2 and box 3 show change detection outputs from Box 1 for a location outside of Flagstaff, AZ converted to polygons (in white). The polygon in box 2 is displayed as a dashed line to serve as a reference, while the solid line in box 3 shows the measured change in 2021. Converting rasters to polygons allows the data to be easily used on tablet computers, as well as the ability to add information and photographs from field visits.
Demystifying Transactional Locking in Cloud Spanner

3002
Of your peers have already read this article.
3:30 Minutes
The most insightful time you'll spend today!
Cloud Spanner is a fully managed relational database with unlimited scale, strong consistency, and up to 99.999% availability. It is designed for highly concurrent applications that read and update data, for example, to process payments or for online game play. To ensure the consistency across multiple concurrent transactions, Cloud Spanner uses a combination of shared locks and exclusive locks to control access to the data. In this blog, we will explore the different types of locks present in Cloud Spanner. We will also discuss some common cases of transactional locking in Cloud Spanner, and what to look out for to detect when these cases might be occurring.
What is a lock?
Before we get into the details, let us first quickly recap and define a lock in the context of database systems.
“Locks” in databases are a mechanism for concurrency control. Locks are typically held on a resource, which may mean rows, columns, tables or even entire databases. When a resource is locked by a transaction, it cannot be accessed by another transaction until the lock is released.
Timeline view of transactions
Before we proceed to discuss transaction locking in the context of read and read-write transactions, it is important to recap the timeline view of the transactions in Spanner.
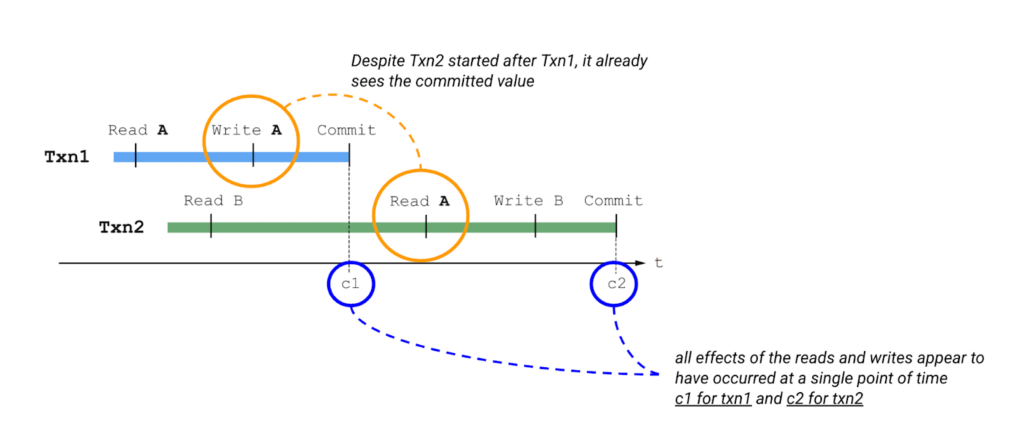
Please also keep in mind the concept of write buffering in transactions, since we refer to it in the Common Transaction Patterns section below. Write buffering refers to the Cloud Spanner server(s) accepting the writes. Note that these writes are not durable until a commit has been performed.
Types of locks in Cloud Spanner
Cloud Spanner operations acquire locks when the operations are part of a read-write transaction. Read-only transactions do not acquire locks. Unlike other approaches that lock entire tables or rows, the granularity of transactional locks in Spanner is a cell, or the intersection of a row and a column. This means that two transactions can read and modify different columns of the same row at the same time. To maximize the number of transactions that have access to a particular data cell at a given time, Cloud Spanner uses different lock modes.
Here is a brief description of the different lock types. Learn more about each lock type in the Cloud Spanner documentation.
- ReaderShared Lock – Acquired when a read-write transaction reads data.
- WriterShared Lock – Acquired when a read-write transaction writes data without reading it.
- Exclusive Lock – Acquired when a read-write transaction which has already acquired a ReaderShared lock tries to write data after the completion of read. It is a special case for a transaction to hold both the ReaderShared lock and WriterShared lock at the same time.
- WriterSharedTimestamp Lock – Special type of lock acquired when inserting new rows with the transaction’s commit timestamp as part of the primary key.
Handling Lock Conflicts
Since read-write transactions use locks to execute atomically, they run the risk of deadlocking. For example, consider the following scenario: transaction Txn1 holds a lock on record A and is waiting for a lock on record B, and Txn2 holds a lock on record B and is waiting for a lock on record A. The only way to make progress in this situation is to abort one of the transactions so it releases its lock, allowing the other transaction to proceed.
Cloud Spanner uses the standard “wound-wait” algorithm to handle deadlock detection. Under the hood, Spanner keeps track of the age of each transaction that requests conflicting locks. It also allows older transactions to abort younger transactions, where “older” means that the transaction’s earliest read, query, or commit happened sooner.
Common Transaction Patterns
Armed with the basics of transactions and locks in Cloud Spanner, we will now walk through a few practical use-cases. We take the example of an application which queries and updates users’ balance in a table named accounts. The accounts table has the following columns –
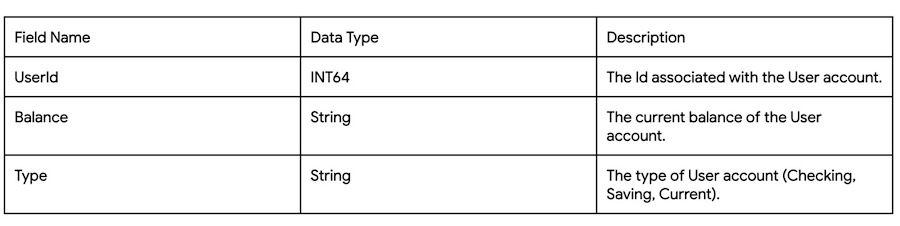
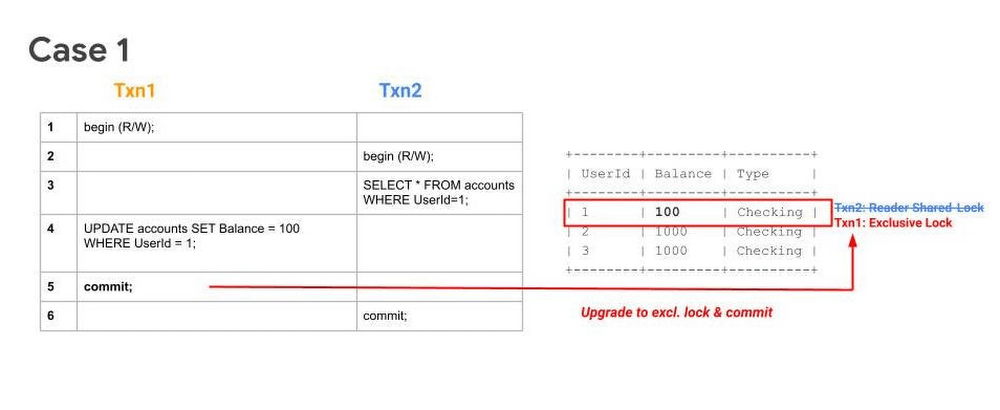
Case 1: Transaction waiting to get exclusive lock because of higher priority shared-lock
Sequence
- Txn1 begins.
- Txn2 begins.
- Txn2 reads the table and acquires a ReadShared Lock.
- Txn1 buffers its write.
- Txn1 tries to commit, but since Txn2 has higher priority (because it has executed its first operation first), Txn1 will have to wait until Txn2 releases the ReadShared Lock.
After committing, Txn2 releases its ReadShared Lock. Txn1 is now able to upgrade to an Exclusive Lock. It acquires the Exclusive Lock and commits.
Note 1: UPDATE WHERE is always transformed into SELECT WHERE, so an UPDATE statement is not a blind write, but a read-write operation.
Note 2: While the above example considers the use-case of querying and updating a single row, the same transaction pattern is also applicable across a key-range.
What to watch out for
- Timeouts due to Transactions waiting for acquiring locks. Refer to transaction statistics and lock statistics to understand how to detect this.
When does this typically happen
- Concurrent updates to a single key/key-range in a table.
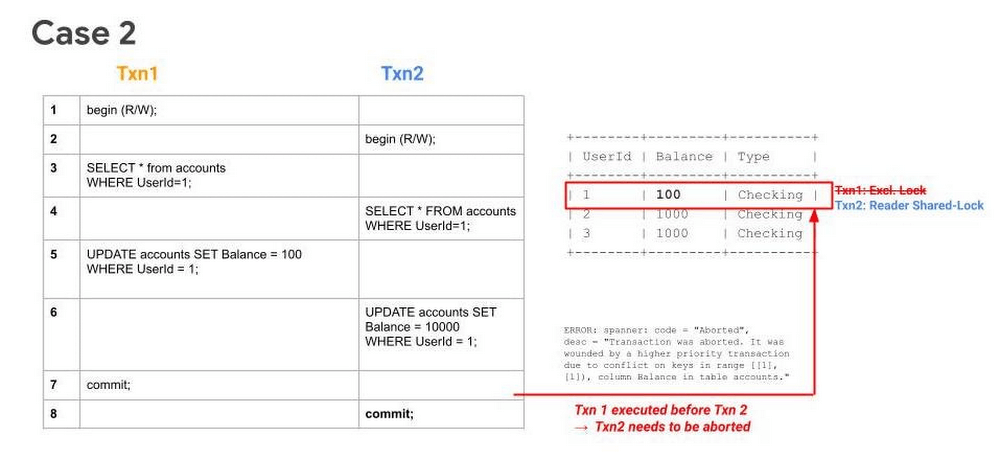
Case 2: Transaction aborted because of concurrent execution succeeding
Sequence
- Txn1 begins.
- Txn2 begins.
- Txn1 reads a row from the table and acquires a ReadShared Lock.
- Txn2 reads the same row as Txn1 and acquires a ReadShared Lock.
- Txn1 buffers its write.
- Txn2 buffers its write.
- Txn1 tries to commit, has higher priority (because it has executed its first operation first), it will get priority in upgrading to an Exclusive Lock. It acquires the Exclusive Lock and commits.
Since Txn1 has committed and was the higher priority transaction, Txn1 will abort Txn2.. The abort will likely happen before Txn2 tries to commit.
What to watch out for
- High number of transaction aborts due to wounding of transactions. Refer to transaction statistics and lock statistics to understand how to detect this.
When does this typically happen
- Concurrent updates to a single key/key-range. Typically this happens in the case of hot keys being present in the table.
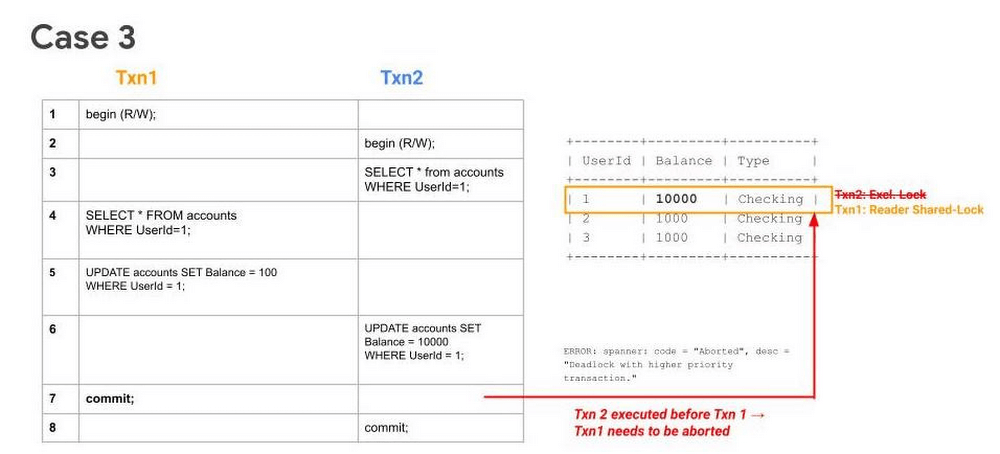
Case 3: Transaction waiting to get exclusive lock because of higher priority shared-lock & getting aborted because of prior succeeding concurrent execution
Sequence
- Txn1 begins.
- Txn2 begins.
- Txn2 reads the table and acquires a ReadShared Lock.
- Txn1 reads the table and acquires a ReadShared Lock.
- Txn1 buffers its write.
- Txn2 buffers its write.
- Txn1 tries to commit, but since Txn2 holds a ReadShared Lock, it has to wait until it gets cleared.
- Since Txn2 has higher priority (because it has executed its first operation first), it will acquire the Exclusive Lock first. Txn2 upgrades its ReaderShared Lock to an Exclusive Lock and commits.
Finally, after Step 8, when Txn1 tries to commit (since ReaderShared Lock from Txn2 is now cleared) it gets aborted. This is done to prevent deadlock with the higher priority transaction (Txn2).
Note: In Case 1, even though Txn2 had acquired a ReaderShared Lock earlier as in Case 3, it never upgraded to an Exclusive Lock (since there were no writes). Hence there was no need to abort Txn1, it could simply wait for Txn2 to release its ReaderShared lock and then commit.
What to watch out for
- High number of transaction aborts due to high contention between transactions. Refer to transaction statistics and lock statistics to understand how to detect this.
When does this typically happen
- Concurrent updates to a single key/key-range. Typically this happens in the case of hot keys being present in the table.
Recommendations
In order to mitigate these issues and reduce their occurrence. We recommend adopting the following best practices:
- If you need to perform more than one read at the same timestamp, and know in advance that you only need to read, consider using a read-only transaction. Because read-only transactions don’t write, they don’t hold locks and they don’t block other transactions. Further, read-only transactions never abort, so you don’t need to wrap them in retry loops.
- Always acquire ReadShared Locks on the smallest subset of keys or key ranges. This reduces the chances of lock contention.
- Analyze your code to only include critical path code within a transaction. Avoiding unneeded remote calls or complex, long-running business logic is a good way to ensure a transaction process quickly.
- Analyze your needs for multi-split transactions. Since transactions that update more than one split use a 2-phase commit protocol, they hold locks for a longer duration, thereby increasing chances of lock contention.
Get started today
Spanner’s unique architecture allows it to scale horizontally without compromising on the consistency guarantees that developers rely on in modern relational databases. Try out Spanner today for free for 90 days or for as low as $65 USD per month.
More Relevant Stories for Your Company
Bitly’s Big Move: A Story of Massive Data Migration to Google’s Cloud Bigtable
Editor’s note: Bitly, the link & QR Code management platform, migrated 80 billion rows of link data to Cloud Bigtable. Here’s how and why they moved this data from a MySQL database, all in just six days. Our goal at Bitly is simple: Make your life easier with connections. Whether you're sharing
Google Leads the Pack in Big Data NoSQL Market: Forrester Research
NoSQL has become critical for all businesses to support modern business applications. It has gone from supporting simple schemaless apps to becoming a mission-critical data platform for large Fortune 1000 companies. It has already disrupted the database market, which was dominated for decades by relational database vendors. Today, half of
5 Reasons Your Legacy Data Warehouse Won’t Cut It
As we engage with enterprises across the globe, one thing is becoming clear: Today’s businesses are solving complex business problems that are data-intensive. But often, their data platform infrastructure is holding them back. Data platform architectures that were designed in the 1990s are not ready to solve business problems for

BigQuery Explainable AI for Demystifying the Inner Workings of ML Models. Now GA!
Explainable AI (XAI) helps you understand and interpret how your machine learning models make decisions. We're excited to announce that BigQuery Explainable AI is now generally available (GA). BigQuery is the data warehouse that supports explainable AI in a most comprehensive way w.r.t both XAI methodology and model types. It does this at
