






3483
Of your peers have already downloaded this article
15:15 Minutes
The most insightful time you'll spend today!
Make Meaningful Analysis with Geo Boundary Public Datasets on BigQuery

6341
Of your peers have already read this article.
4:00 Minutes
The most insightful time you'll spend today!
Geospatial data is a critical component for a comprehensive analytics strategy. Whether you are trying to visualize data using geospatial parameters or do deeper analysis or modeling on customer distribution or proximity, most organizations have some type of geospatial data they would like to use – whether it be customer zipcodes, store locations, or shipping addresses. However, converting geographic data into the correct format for analysis and aggregation at different levels can be difficult. In this post, we’ll walk through some examples of how you can leverage the Google Cloud platform alongside Google Cloud Public Datasets to perform robust analytics on geographic data. The full queries can be accessed from this notebook here.
Public US Geo Boundaries dataset
BigQuery hosts a slew of public datasets for you to access and integrate into your analytics. Google pays for the storage of these datasets and provides public access to the data via the bigquery-public-data project. You only pay for queries against the data. Plus, the first 1 TB per month is free! These public datasets are valuable on their own, but when joined against your own data they can unlock new analytics use cases and save the team a lot of time.
Within the Google Cloud Public Datasets Program there are several geographic datasets. Here, we’ll work with the geo_us_boundaries dataset, which contains a set of tables that have the boundaries of different geospatial areas as polygons and coordinates based on the center point (GEOGRAPHY column type in BigQuery), published by the US Census Bureau.

Mapping geospatial points to hierarchical areas
Many times you will find yourself in situations where you have a string representing an address. However, most tools require lat/long coordinates to actually plot points. Using the Google Maps Geocoding API we can convert an address into a lat/long and then store the results in the BigQuery table.
With a lat/long representation of our point, we can join our initial dataset back onto any of the tables here using the ST_WITHIN function. This allows us to check and see if a point is within the specified polygon.
ST_WITHIN(geography_1, geography_2)
This can be helpful for ensuring standard nomenclature; for example, metropolitan areas that might be named differently. The query below maps each customers’ address to a given metropolitan area name.
SELECTcust.id as customer_id,metro.name as metro_nameFROM `looker-private-demo.retail.customers` as cust,`bigquery-public-data.geo_us_boundaries.metropolitan_divisions` as metroWHERE ST_WITHIN(ST_GEOGPOINT(cust.longitude, cust.latitude),metro.metdiv_geom)
It can also be useful for converting to designated market area (DMA), which is often used in creating targeted digital marketing campaigns.
SELECTcust.id as customer_id,dma.dma_nameFROM `looker-private-demo.retail.customers` as cust,`bigquery-public-data.geo_us_boundaries.designated_market_area` as dmaWHERE ST_WITHIN(ST_GEOGPOINT(cust.longitude, cust.latitude),dma.dma_geom)
Or for filling in missing information; for example, some addresses may be missing zip code which results in incorrect calculations when aggregating up to the zipcode level. By joining onto the zip_codes table we can ensure all coordinates are mapped appropriately and aggregate up from there.
SELECTzip.zip_code,count(distinct cust.id) as unique_customersFROM `looker-private-demo.retail.customers` as cust,`bigquery-public-data.geo_us_boundaries.zip_codes` as zipWHERE ST_WITHIN(ST_GEOGPOINT(cust.longitude, cust.latitude),zip.zip_code_geom)GROUP BY 1
Note that the zip code table isn’t a comprehensive list of all US zip codes, they are zip code tabulation areas (ZCTAs). Details about the differences can be found here. Additionally, the zip code table gives us hierarchical information, which allows us to perform more meaningful analytics. One example is leveraging hierarchical drilling in Looker. I can aggregate my total sales up to the country level, and then drill down to state, city and zipcode to identify where sales are highest. You can also use the BigQuery GeoViz tool to visualize geospatial data!

Aside from simply checking if a point is within an area, we can also use ST_DISTANCE to do something like find the closest city using the centerpoint for the metropolitan area table.
SELECTcust.id as customer_id,ARRAY_AGG(metro.name order by ST_DISTANCE(ST_GEOGPOINT(cust.longitude, cust.latitude),metro.internal_point_geom) asc limit 1)[offset(0)] as metro_nameFROM`looker-private-demo.retail.customers` as cust,`bigquery-public-data.geo_us_boundaries.metropolitan_divisions` as metroGROUP BY cust.id
This concept doesn’t just hold true for points, we can also leverage other GIS functions to see if a geospatial area is contained within areas that are listed in the boundaries datasets. If your data comes into BigQuery as a GeoJSON string, we can convert it to a GEOGRAPHY type using the ST_GEOGFROMGEOJSON function. Once our data is in a GEOGRAPHY type we can do things like check to see what urban area the geo is within – using either ST_WITHIN or ST_INTERSECTS to account for partial coverage. Here, I am using the customer’s zip code to find all metropolitan divisions where the zip code polygon and the metropolitan polygon intersect. I am then selecting the metropolitan area that has the most overlap (or the intersection has the largest area) to be the customer’s metro that we use for reporting.
SELECTcust.id as customer_id,ARRAY_AGG(metro.name order by ST_AREA(ST_INTERSECTION(zip.zip_code_geom,metro.metdiv_geom)) desc limit 1)[offset(0)] as metro_nameFROM`looker-private-demo.retail.customers` as custJOIN `bigquery-public-data.geo_us_boundaries.zip_codes` as zip on cust.zip=zip.zip_code,`bigquery-public-data.geo_us_boundaries.metropolitan_divisions` as metroWHERE ST_INTERSECTS(zip.zip_code_geom,metro.metdiv_geom)GROUP BY cust.id
The same ideas can be applied to the other tables in the dataset including the county, urban areas and National Weather Service forecast regions (which can also be useful if you want to join your datasets onto weather data).
Correcting for data discrepancy
One problem that we may run into when working with geospatial data is that different data sources may have different representations of the same information. For example, you might have one system that records state as a two letter abbreviation and another using the full name. Here, we can use the state table to join the different datasets.
SELECTst.state_name,sum(ab.sales+fn.sales) as total_salesFROM `bigquery-public-data.geo_us_boundaries.states` as stLEFT JOIN abbreviated_table as ab on ab.state = st.stateLEFT JOIN fullname_table as fn on fn.state = st.state_nameWHERE COALESCE(ab.state, fn.state) IS NOT NULLGROUP BY 1
Another example might be using the tables as a source of truth for fuzzy matching. If the address is a manually entered field somewhere in your application, there is a good chance that things will be misspelled. Different representations of the same name may prevent tables from joining with each other or lead to duplicate entries when performing aggregations. Here, I use a simple Soundex algorithm to generate a code for each county name, using helper functions from this blog post. We can see that even though some are misspelled they have the same Soundex code.

Next, we can join back onto our counties table so we make sure to use the correct spelling of the county name. Then, we can simply aggregate our data for more accurate reporting.
SELECTc.county_name,sum(sales) as total_salesFROMtableJOIN `bigquery-public-data.geo_us_boundaries.counties` as con testing.dq_fm_Soundex(table.county) = testing.dq_fm_Soundex(c.county_name)WHERE c.state_fips_code = cast(36 as string)GROUP BY 1
Note that fuzzy matching definitely isn’t perfect and you might need to try different methods or apply certain filters for it to work best depending on the specifics of your data.
The US Geo Boundary datasets allow you to perform meaningful geographic analysis without needing to worry about extracting, transforming or loading additional datasets into BigQuery. These datasets, along with all the other Google Cloud Public Datasets, will be available in the Analytics Hub. Please sign up for the Analytics Hub preview, which is scheduled to be available in the third quarter of 2021, by going to g.co/cloud/analytics-hub.
FAQs: Everything Your Need to Know About Cloud Computing

6611
Of your peers have already read this article.
1:30 Minutes
The most insightful time you'll spend today!
There are a number of terms and concepts in cloud computing, and not everyone is familiar with all of them. To help, we’ve put together a list of common questions, and the meanings of a few of those acronyms. You can find all these, and many more, in our learning resources.
What are containers?
Containers are packages of software that contain all of the necessary elements to run in any environment. In this way, containers virtualize the operating system and run anywhere, from a private data center to the public cloud or even on a developer’s personal laptop. Containerization allows development teams to move fast, deploy software efficiently, and operate at an unprecedented scale. Read more.
Containers vs. VMs: What’s the difference?
You might already be familiar with VMs: a guest operating system such as Linux or Windows runs on top of a host operating system with access to the underlying hardware. Containers are often compared to virtual machines (VMs). Like virtual machines, containers allow you to package your application together with libraries and other dependencies, providing isolated environments for running your software services. However, the similarities end here as containers offer a far more lightweight unit for developers and IT Ops teams to work with, carrying a myriad of benefits. Containers are much more lightweight than VMs, virtualize at the OS level while VMs virtualize at the hardware level, and share the OS kernel and use a fraction of the memory VMs require. Read more.
What is Kubernetes?
With the widespread adoption of containers among organizations, Kubernetes, the container-centric management software, has become the de facto standard to deploy and operate containerized applications. Google Cloud is the birthplace of Kubernetes—originally developed at Google and released as open source in 2014. Kubernetes builds on 15 years of running Google’s containerized workloads and the valuable contributions from the open source community. Inspired by Google’s internal cluster management system, Borg, Kubernetes makes everything associated with deploying and managing your application easier. Providing automated container orchestration, Kubernetes improves your reliability and reduces the time and resources attributed to daily operations. Read more.
What is microservices architecture?
Microservices architecture (often shortened to microservices) refers to an architectural style for developing applications. Microservices allow a large application to be separated into smaller independent parts, with each part having its own realm of responsibility. To serve a single user request, a microservices-based application can call on many internal microservices to compose its response. Containers are a well-suited microservices architecture example, since they let you focus on developing the services without worrying about the dependencies. Modern cloud-native applications are usually built as microservices using containers. Read more.
What is ETL?
ETL stands for extract, transform, and load and is a traditionally accepted way for organizations to combine data from multiple systems into a single database, data store, data warehouse, or data lake. ETL can be used to store legacy data, or—as is more typical today—aggregate data to analyze and drive business decisions. Organizations have been using ETL for decades. But what’s new is that both the sources of data, as well as the target databases, are now moving to the cloud. Additionally, we’re seeing the emergence of streaming ETL pipelines, which are now unified alongside batch pipelines—that is, pipelines handling continuous streams of data in real time versus data handled in aggregate batches. Some enterprises run continuous streaming processes with batch backfill or reprocessing pipelines woven into the mix. Read more.
What is a data lake?
A data lake is a centralized repository designed to store, process, and secure large amounts of structured, semistructured, and unstructured data. It can store data in its native format and process any variety of it, ignoring size limits. Read more.
What is a data warehouse?
Data-driven companies require robust solutions for managing and analyzing large quantities of data across their organizations. These systems must be scalable, reliable, and secure enough for regulated industries, as well as flexible enough to support a wide variety of data types and use cases. The requirements go way beyond the capabilities of any traditional database. That’s where the data warehouse comes in. A data warehouse is an enterprise system used for the analysis and reporting of structured and semi-structured data from multiple sources, such as point-of-sale transactions, marketing automation, customer relationship management, and more. A data warehouse is suited for ad hoc analysis as well custom reporting and can store both current and historical data in one place. It is designed to give a long-range view of data over time, making it a primary component of business intelligence. Read more.
What is streaming analytics?
Streaming analytics is the processing and analyzing of data records continuously rather than in batches. Generally, streaming analytics is useful for the types of data sources that send data in small sizes (often in kilobytes) in a continuous flow as the data is generated. Read more.
What is machine learning (ML)?
Today’s enterprises are bombarded with data. To drive better business decisions, they have to make sense of it. But the sheer volume coupled with complexity makes data difficult to analyze using traditional tools. Building, testing, iterating, and deploying analytical models for identifying patterns and insights in data eats up employees’ time. Then after being deployed, such models also have to be monitored and continually adjusted as the market situation or the data itself changes. Machine learning is the solution. Machine learning allows businesses to enable the data to teach the system how to solve the problem at hand with machine learning algorithms—and how to get better over time. Read more.
What is natural language processing (NLP)?
Natural language processing (NLP) uses machine learning to reveal the structure and meaning of text. With natural language processing applications, organizations can analyze text and extract information about people, places, and events to better understand social media sentiment and customer conversations. Read more.
Learn more
This is just a sampling of frequently asked questions about cloud computing. To learn more, visit our resources page at cloud.google.com/learn.
4415
Of your peers have already watched this video.
31:30 Minutes
The most insightful time you'll spend today!
Smart analytics: Deep dive on roadmap
Data across organizations is growing and that organizations need a very strong analytics platform to leverage this data create insights and make real-time decisions on top of this data.
That’s driving the advent of three large trends. First is the convergence of data lakes and data warehouses, that’s enable organizations to maximize the value of their data.
Second, is the growing phenomena of real-time decision-making which is forcing enterprises to think of how they can support the needs of batch processing and streaming data.
Finally, there is the rise of artificial intelligence and machine learning, which allows enterprises to leverage their data and create competitive differentiation.
With this background, Sudhir Hasbe, Director of Product Management, Data Analytics, Google Cloud, walks us through Google Cloud’s smart analytics offerings—and what’s new.
He takes us on a tour through the technical value of Google Cloud’s smart analytics platform end-to-end. He provides a comprehensive overview and demos what’s new and what’s next in Google Cloud’s smart analytics portfolio across products like BigQuery, Dataflow, Dataproc, Data Fusion, PubSub, Data Catalog, Dataprep, and Looker.
ML Models Built on Google Cloud Solutions Help You Virtually Participate in National Muffin Day!

2955
Of your peers have already read this article.
2:00 Minutes
The most insightful time you'll spend today!
If you’re here you’re probably wondering: what on Earth is the connection between muffins and machine learning, and what is National Muffin Day? To understand this, let’s start with National Muffin Day: an annual holiday co-founded by Jacob and his friend Julia Levy in 2015 to bake muffins and raise money for homelessness. National Muffin Day will occur on Sunday, February 20 this year. For more information on how to participate in National Muffin Day (which involves delicious baked goods and donations to people in need), please see the information at the bottom of this post. Last year, a colleague connected Jacob with Sara, who had done several baking projects that used machine learning to generate new recipes. They decided to collaborate for this year’s National Muffin Day, adding a new muffin recipe created with the help of machine learning.
In this post, we’ll explain how Sara used Google Cloud to develop a new muffin recipe, show you how you can participate virtually in National Muffin Day, and of course—share the recipe.
Machine learning for muffins
At its core, machine learning is the process of finding patterns in data and using those patterns to make predictions on new data. After a lot of baking over the past few years, Sara learned that baking is also based on patterns. For example, the ratio of flour, fat, liquid, and sugar that make up a cookie is very different from the ratio of those ingredients for a bread, a pie crust, or a muffin. She used that discovery to create a recipe for a hybrid cake + cookie, and a cake filled with Maltesers. Next up: muffins!
The first step was figuring out how to translate the task of generating a new muffin recipe into a machine learning task. To solve this, she planned to use numerical data on the amounts of different ingredients in a muffin recipe to train the model. Sara considered two types of models for this task: classification and regression. A classification model would categorize muffin recipes into different muffin types based on their ingredient amounts, and a regression model would do the reverse: take a type of muffin and return the amount of each ingredient needed to make it. She decided to build a regression model, since it would be more fun for the model to return ingredient amounts, rather than tell you which type of muffin recipe you’re already making.
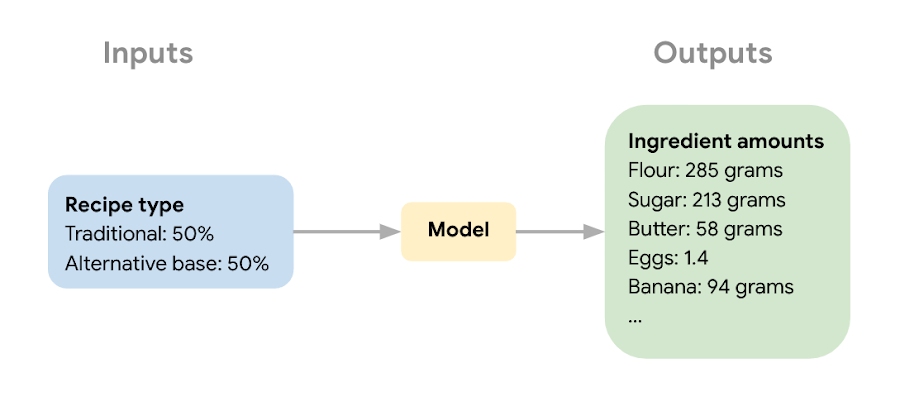
Implementing this first required identifying a few muffin categories and collecting recipe data. This presented a new challenge, since her previous baking models used categories for distinct baked goods (i.e. cakes, cookies, breads). After scouring through quite a few recipes, Sara discovered that many muffins fall into two types: those that use only traditional ingredients as their base (flour, sugar, butter, milk, etc.), and those that include an alternative ingredient, most commonly a pureed fruit, to make the base (like bananas, applesauce, or pumpkin). Using those two categories, the model would take the type of muffin as input and return the amounts of base ingredients required to make that recipe. Here, the inputs can be any values adding up to 100%:
The next step in the ML process was collecting recipe data to use for model training and narrowing down the ingredients used to train the model. Sara wanted the model to learn the combination of core ingredients that make up a muffin batter, rather than flavorings and additions like blueberries, vanilla extract, or chocolate chips. These tasty additions could be added after the model helped create the muffin batter. Once she gathered enough recipes, she removed extra ingredients for training purposes and converted ingredients from different recipes into the same unit (grams, milliliters, and teaspoons).
Building a muffin model with Vertex AI
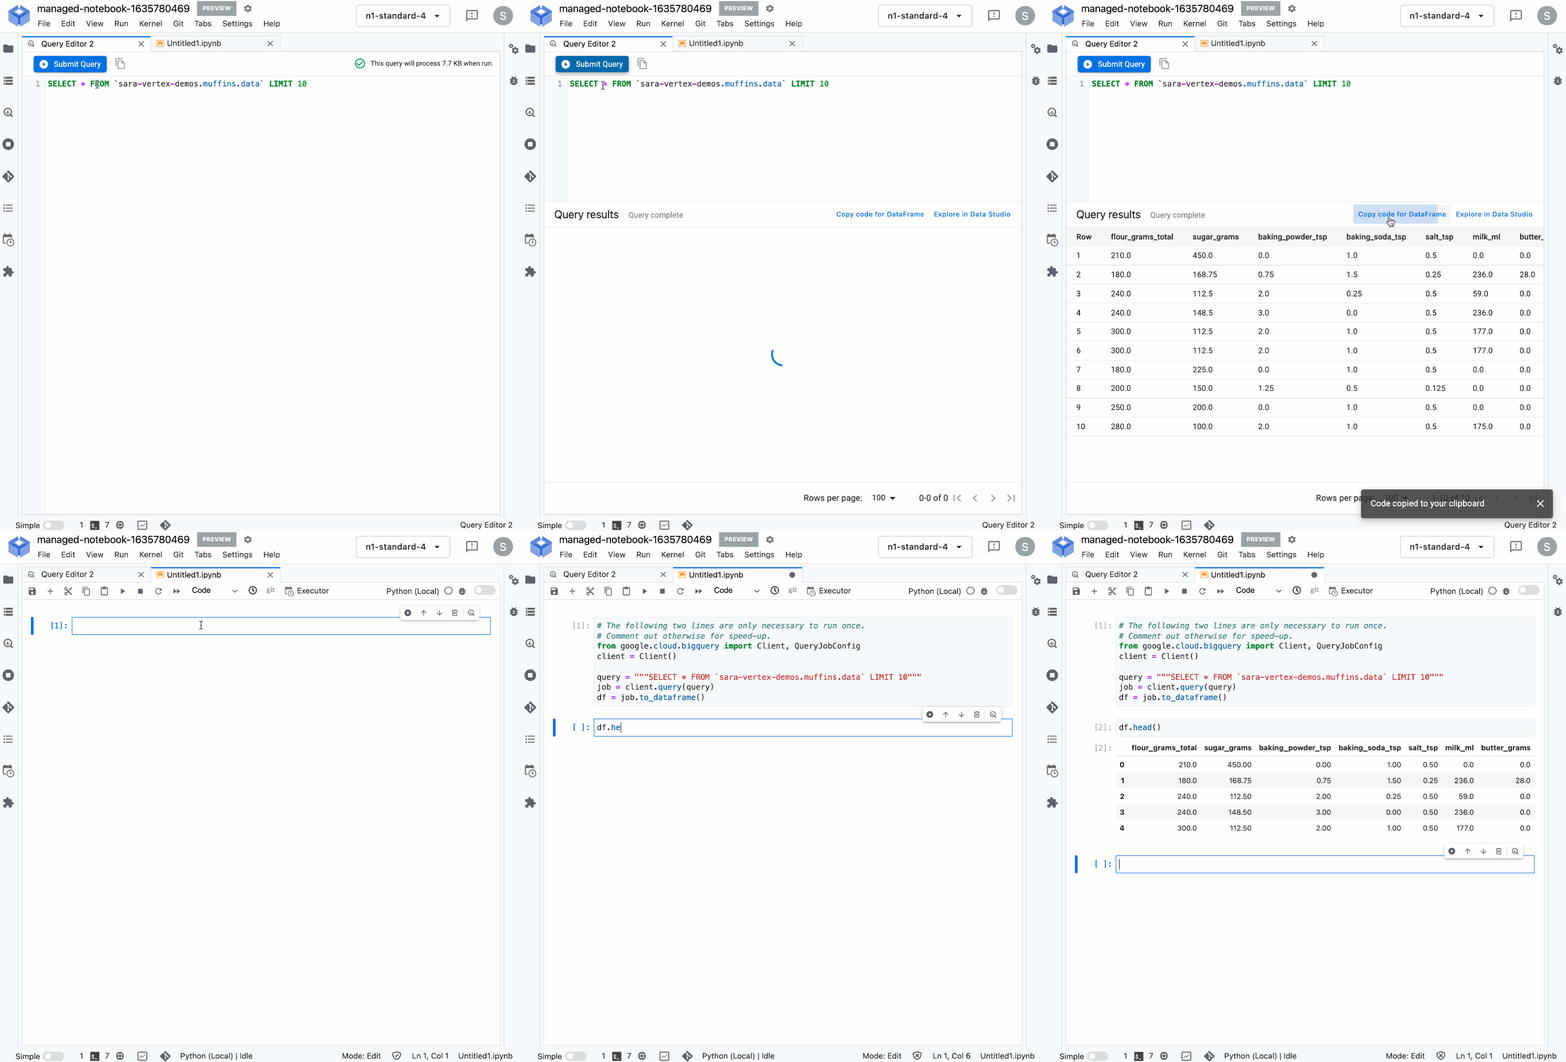
Sara uploaded the muffin ingredient data into BigQuery, and then created a notebook instance in Vertex AI Workbench to analyze the data. With the new Workbench managed instances, you can interactively query BigQuery tables directly from your instance and copy the code to download your data to a notebook as a Pandas DataFrame:
From her notebook instance, Sara experimented with different ML frameworks and model types. She landed on a Scikit-learn regression model to solve this task, and to mimic a real-world production environment, decided to convert this workflow into a ML pipeline. Using the Kubeflow Pipelines SDK, she ran the following on Vertex Pipelines:
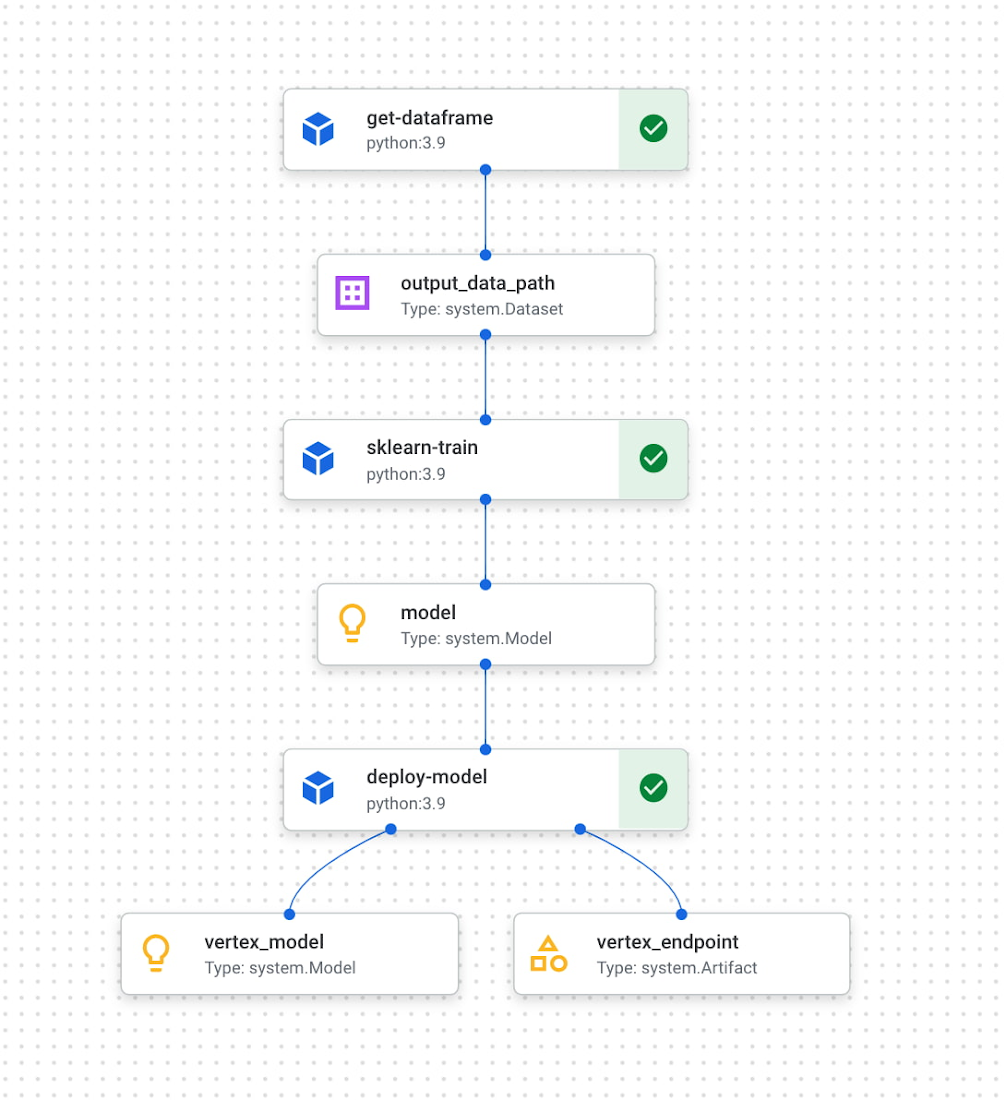
The first component reads the ingredient data from BigQuery and converts it into a Pandas DataFrame which is passed to the next pipeline step. In this step, we train a custom Scikit-learn model on the recipe data. Finally, this model is deployed to an endpoint in Vertex AI. To put it all together, Sara built a web app that allowed her to easily generate ingredient amounts for different muffin types. The web app uses the Vertex AI SDK to call the deployed model endpoint and return ingredient amounts.
The recipe
With a deployed recipe generation model, the only thing left to do was test recipes in the kitchen! Because the model only returns ingredient amounts, there were still many key human elements to complete the baking process: adding yummy additions to the core muffin batter, making adjustments to optimize taste, determining the method for adding ingredients, baking time, and more. After testing a few recipes generated by the model, we landed on a favorite which we’re very excited to share with you here.
Berry ML Muffins

Makes 12 muffins
Flour 285 grams (2 cups)
Granulated sugar 250 grams (1 cup)
Baking powder 2 teaspoons
Baking soda ¼ teaspoon
Salt ½ teaspoon
Cinnamon ½ teaspoon
Milk 170 ml (⅔ cup), room temperature
Butter 55 grams (¼ cup), melted and slightly cooled
Eggs 1 egg plus 1 egg white, room temperature
Canola or vegetable oil 50 grams (¼ cup)
Sour cream 50 grams (3 tablespoons + ¾ teaspoon), room temperature
Vanilla extract 1 ½ teaspoons
Blueberries or raspberries 240 grams (1 ½ cups)
Coarse sugar, like demerara or turbinado (optional for topping) 1 tablespoon
- Measure your three cold ingredients and allow them to come to room temperature: 1 egg + 1 egg white, sour cream, and milk.
- Preheat the oven to 375 F / 190 C. Line a 12-muffin tin with cupcake liners or lightly grease with baking spray.
- In a large bowl, whisk together flour, baking powder, baking soda, salt, and cinnamon. Set aside.
- Melt your butter in a medium heat proof bowl, and allow it to cool slightly for a few minutes. Whisk in sugar until combined. Then add egg, oil, and vanilla, milk, and sour cream and whisk until fully incorporated.
- Pour the wet ingredients into the dry ingredients, mixing with a spatula until just combined. Be careful not to overmix, it’s ok if there are a few lumps in your batter.
- Prepare your fruit. If you can’t decide whether to use blueberries or raspberries, divide your batter into two bowls and do both! Crush half of your fruit and fold it into the batter. Then mix in the remaining whole berries.
- Divide the mixture evenly into the muffin tin. Optionally (but extra tasty), sprinkle the tops of each muffin with about ⅛ teaspoon of coarse sugar. Turbinado or demerara sugar work well for this. This will caramelize and add a nice texture to the tops of your muffins.
- Bake at 375 for 22 – 24 minutes, or until a toothpick inserted in the center comes out clean. For best results, do a toothpick test in a few muffins since not all ovens have an even temperature throughout. Let the muffins cool in the muffin tin for a few minutes, then transfer to a wire rack to cool completely.
- Enjoy!
How can you participate in National Muffin Day?
Participation in National Muffin Day is as easy as 1-2-3!
- On February 20, Bake Muffins. It’s time to dust those muffin tins, grab your blueberries, chocolate chips, rhubarb, and favorite ingredients, and create some magical scrumdiddlyumptiousness! If you want to join Jacob in a virtual baking party, you can register here.
- Then, Give. In non-pandemic years, we asked our bakers to personally hand muffins to hungry folks in their cities. While this is a valuable and rewarding experience, the current state of Covid means this practice is still unsafe, so we request that you refrain from doing this. Instead, if it feels safe, we encourage you to take your delicious baked goods and donate them to local homeless shelters, which can distribute them to those in need. Alternatively, you can share your muffins with friends and families and then make a donation to an organization that benefits people experiencing homelessness, like the ones listed below in step 3.
- Share Your Muffin Pics on Social Media. We’d love to see your muffins! Share your pictures on Twitter or Instagram with the hashtags #givemuffins, or share them to our official Facebook Event page. For each individual baker who participates, we will make donations to Project Homeless Connect, which provides much needed resources to people experiencing homelessness in San Francisco, Family promise, which supports unhoused families nationwide, and Pine Street Inn which provides resources for people experiencing homelessness in Boston. Donations will be on a per-baker basis (with up to $80 donated per baker!), so please feel free to loop in your significant others, kids, nieces and nephews, roommates, friends, and anybody else with a giving spirit who loves deliciousness!
Beyond Traditional Learning: AI-based Online Learning Platform and Google Cloud Solutions Push Learners to Get Ahead

10344
Of your peers have already read this article.
1:30 Minutes
The most insightful time you'll spend today!
The combination of a vital need for IT experts among businesses and a digital skills gap is making lifelong learning increasingly critical. Beyond professional development, learning new skills offers additional rewards from building peer connections to boosting your creativity. That’s why in 2020 Krishna Deepak Nallamilli and I launched KIMO.ai to reimagine how people approach learning, especially in developing markets. Our team is building the artificial intelligence needed to generate individual learning paths through a wide range of quality digital learning content.
Google Cloud and its Startup Program have been instrumental in connecting our team with the tools, people, processes, and best practices to grow our business.
Existing learning platforms lack engagement
Outside of traditional education settings, massive open online learning courses (MOOCs)—often modeled after university courses—can provide a flexible and affordable way to upskill or reskill. But the vast majority of people who participate in MOOC programs fail to complete courses. Based on our research, the challenge with existing learning platforms is a lack of engagement, primarily caused by limited direction on which skills to learn, whether AI, fintech, blockchain, or other in-demand disciplines.
We’ve also received feedback that many corporate learning management systems–developed as online training systems to upskill employees–tend to be poorly designed and time-consuming to use.
Overall, a significant challenge with most existing learning platforms is that they’re generic. For example, suppose you’re interested in learning about AI. In that case, you need AI-related coursework that applies to your industry and the job you want because AI in medicine is vastly different from AI in financial services. Today’s online learning options typically take a one-size-fits-all approach and fail to capture the nuances of what learners really need to get ahead.
Building a future-proof learning platform
The commitment to highly personalized, accessible learning inspired KIMO.ai, a platform that we believe is the future of education. Depending on your goals, current skills, location, and other factors, our AI-based platform will identify which coursework (and where to find those classes) to build the skills you need. The more personalized, relevant learning recommendations even take into account people’s preferences for podcasts, MOOCs, books, articles, videos, courses, publications, and more.
In a mix of cooperation and competition we call “coopetition,” KIMO.ai will regularly recommend courses from other established online learning systems if, based on our automated assessment, it’s the best option for a learner. There’s also the option to access free content only.
Google cultural alignment fosters trust
Our platform started with one developer exploring NLP models and Google APIs. As we’ve grown our team and launched our beta to 110,000 users in developing markets, we discovered there is a lot of interest in our platform, and we believe we can make a significant impact. In feedback forums, we also learned that we need to focus our efforts on the mobile experience to improve engagement since 99% of the beta testers use mobile devices.
Beyond our team’s high level of trust in Google Cloud solutions, our team also appreciates the cultural alignment with Google. We value Google’s developer-centric approach and rely on tools like Dataflow for batch data processing and Cloud TPU to reliably run machine learning models with AI services on Google Cloud. We also build all of our deployments on Google Kubernetes Engine (GKE), which makes it easy to manage all our containerized workloads
On the front end, Google App Engine makes it easy to deploy apps and experiment, and it integrates seamlessly with Firebase for authentication and more. BigQuery is our serverless data warehouse that efficiently scales to support the millions of articles, videos, and other learning resources we need to analyze to provide the targeted coursework recommendations our learners require.
As we grow our business having a network of trusted advisors is also extremely valuable. By working closely with DoIT International, the 2020 Google Cloud Global Reseller Partner of the Year, our team has access to their cloud, Kubernetes, and machine learning expertise. DoIT has already helped us quickly resolve IT issues and create analytics dashboards that give us insights to continually enhance our services.
Building for a growing industry
The dynamic edtech market is growing rapidly and estimated to become an $11B industry by 2025. We’re proud to be part of the next wave of personalized education that has the potential to empower people in developing markets and beyond to grow their skills with coursework tailored to their exact needs and how they like to learn. This year, we will deliver our platform to at least 400,000 more people. We’re excited to see how they use it and where it takes them.
If you want to learn more about how Google Cloud can help your startup, visit our Startup Program application page here to get more information about our program, and sign up for our communications to get a look at our community activities, digital events, special offers, and more.
More Relevant Stories for Your Company

This Diagnostic Company is Revolutionising Healthcare Delivery with AI
Dr. Elliot Smith cannot be accused of lacking ambition. A high achiever with a Ph.D. in Electrical Engineering and a specialist in magnetic resonance imaging (MRI) systems, Smith aims to deliver top quality healthcare to anyone in the world -- regardless of their location or wealth. Dr. Smith has already

Architecting Data Pipelines Directly Improves Customer Experience at Universe.com
At Universe, we serve customers day and night and are always working to make sure they have a great experience, whether online or at one of our live events. Our technology has to make that possible, and our legacy systems weren’t cutting it anymore. What we needed was a consistent,




Ulta Beauty: Transforming the Beauty Industry with Digital Technology and Google Cloud
As the largest U.S. beauty retailer with more than 1,200 stores across all 50 states, guests flock to Ulta Beauty for its impressive selection of beauty favorites. Ulta Beauty revolutionized the shopping experience by bringing all things beauty, all in one place. It’s enhancing the beauty experience again with technology

Latest Features and Updates to Globally Bolster Translation Services
Let’s face it: in the globalized world, which is now more than ever a digital demand world, you need to scale and reach your customers right where they’re at. Translation is a critical piece of that, whether you’re translating a website in multiple languages or releasing a document, a piece
