






Google Leads the Database-as-a-Service Market: Forrester Research
READ FULL INTRODOWNLOAD AGAIN5493
Of your peers have already downloaded this article
3:00 Minutes
The most insightful time you'll spend today!
Wayfair Writes its Success Story with BigQuery for Internal Analytics

4948
Of your peers have already read this article.
4:00 Minutes
The most insightful time you'll spend today!
Editor’s note: Home-goods and furniture giant Wayfair first partnered up with Google Cloud to transform and scale its storefront—work that proved its value many times over during the unprecedented surge in ecommerce traffic during 2020. Today, we hear how BigQuery’s performance and cost optimization have transformed the company’s internal analytics to create an environment of “yes”.
At Wayfair, we have several unique challenges relating to the scale of our product catalog, our global delivery network, and our position in a multi-sided marketplace that supports both our customers and suppliers. To give you a sense of our scale we have a team of more than 3,000 engineers with tens of millions of customers. We supply more than 20 Million items using more than 16,000 supplier partners.
Serving those constituents generates a lot of analytics work. Wayfair runs over a billion ‘analytic’ database queries a year, from both humans and systems, against multi-petabyte datasets. Scaling our previous environment to meet these challenges required us to maintain dozens of copies of data for different use cases and manage complex data synchronization routines to move trillions of records each day, resulting in long development times and high support costs for our analytics projects.
Centralizing our data using Cloud Storage and BigQuery enabled us to break down existing silos and build unified pipelines for our batch and real-time operations. BigQuery shines by letting us decouple our compute and storage resources and flexibly ingest structured data in streaming and batch modes. We also benefit from the same decoupling for more complicated machine learning (ML) workflows in Dataproc and Cloud Storage. In particular, BigQuery is extremely low maintenance. From ML and easy data integrations to the integrated query cache, many out-of-the-box features have proven valuable for multiple use cases.
Beyond storage and compute, Google Cloud offers multiple tools to maximize the value of our data. For example, we can easily connect Data Studio to BigQuery for lightning-fast dashboarding of enterprise KPI reporting. When we need to dive deeper into a metric, Looker provides an interface and semantic model that empowers more business users to answer important questions — without understanding SQL or our vast dataset and table structure.
The combination of all of Google Cloud’s tools enables every Wayfairian the opportunity to self-serve their data visualization and analysis needs. We are able to support all of the requirements of our internal and external users, from descriptive analytics to alerting and ML, in a platform that blends Google’s proprietary technology with open-source standards.we have seen a greater than 90% reduction in the number of analytic queries in production that take more than one minute to run
As a result, we have seen a greater than 90% reduction in the number of analytic queries in production that take more than one minute to run, which delights our users and increases adoption of our analytics tools across the business.
Higher performance means saying “Yes” more often
We went into the BigQuery experience expecting very strong performance on large, aggregate queries and excellent scalability — the kind of performance that could enable consistent 5-15 minute processing queries and 5-10 second response times for large analytics queries.
We weren’t disappointed — we saw slightly better than linear performance profiles as record counts went up from millions to trillions for a flat resource allocation. BigQuery had the expected high performance for aggregate queries. This made our large data processing pipelines predictable and straightforward to maintain and optimize.
Below is a plot of gigabytes processed by a query against query run time in seconds; outliers are filtered and the axes are pruned to ranges where we had a large sample size. This focuses on longer-duration queries. As an example of the linear performance, a 2 terabyte query averages 5 minutes — 2.5min/terabyte — and an 18 terabyte query (9 times as much data) averages 25s — only 1.4min/terabyte. This is despite the fact that complex queries [sorting and analytic functions are particularly problematic] are more common with large data sizes. We do see increasing variability at large sizes as slot limits and other resource constraints come into play, but these factors are controllable and ultimately a business optimization decision.
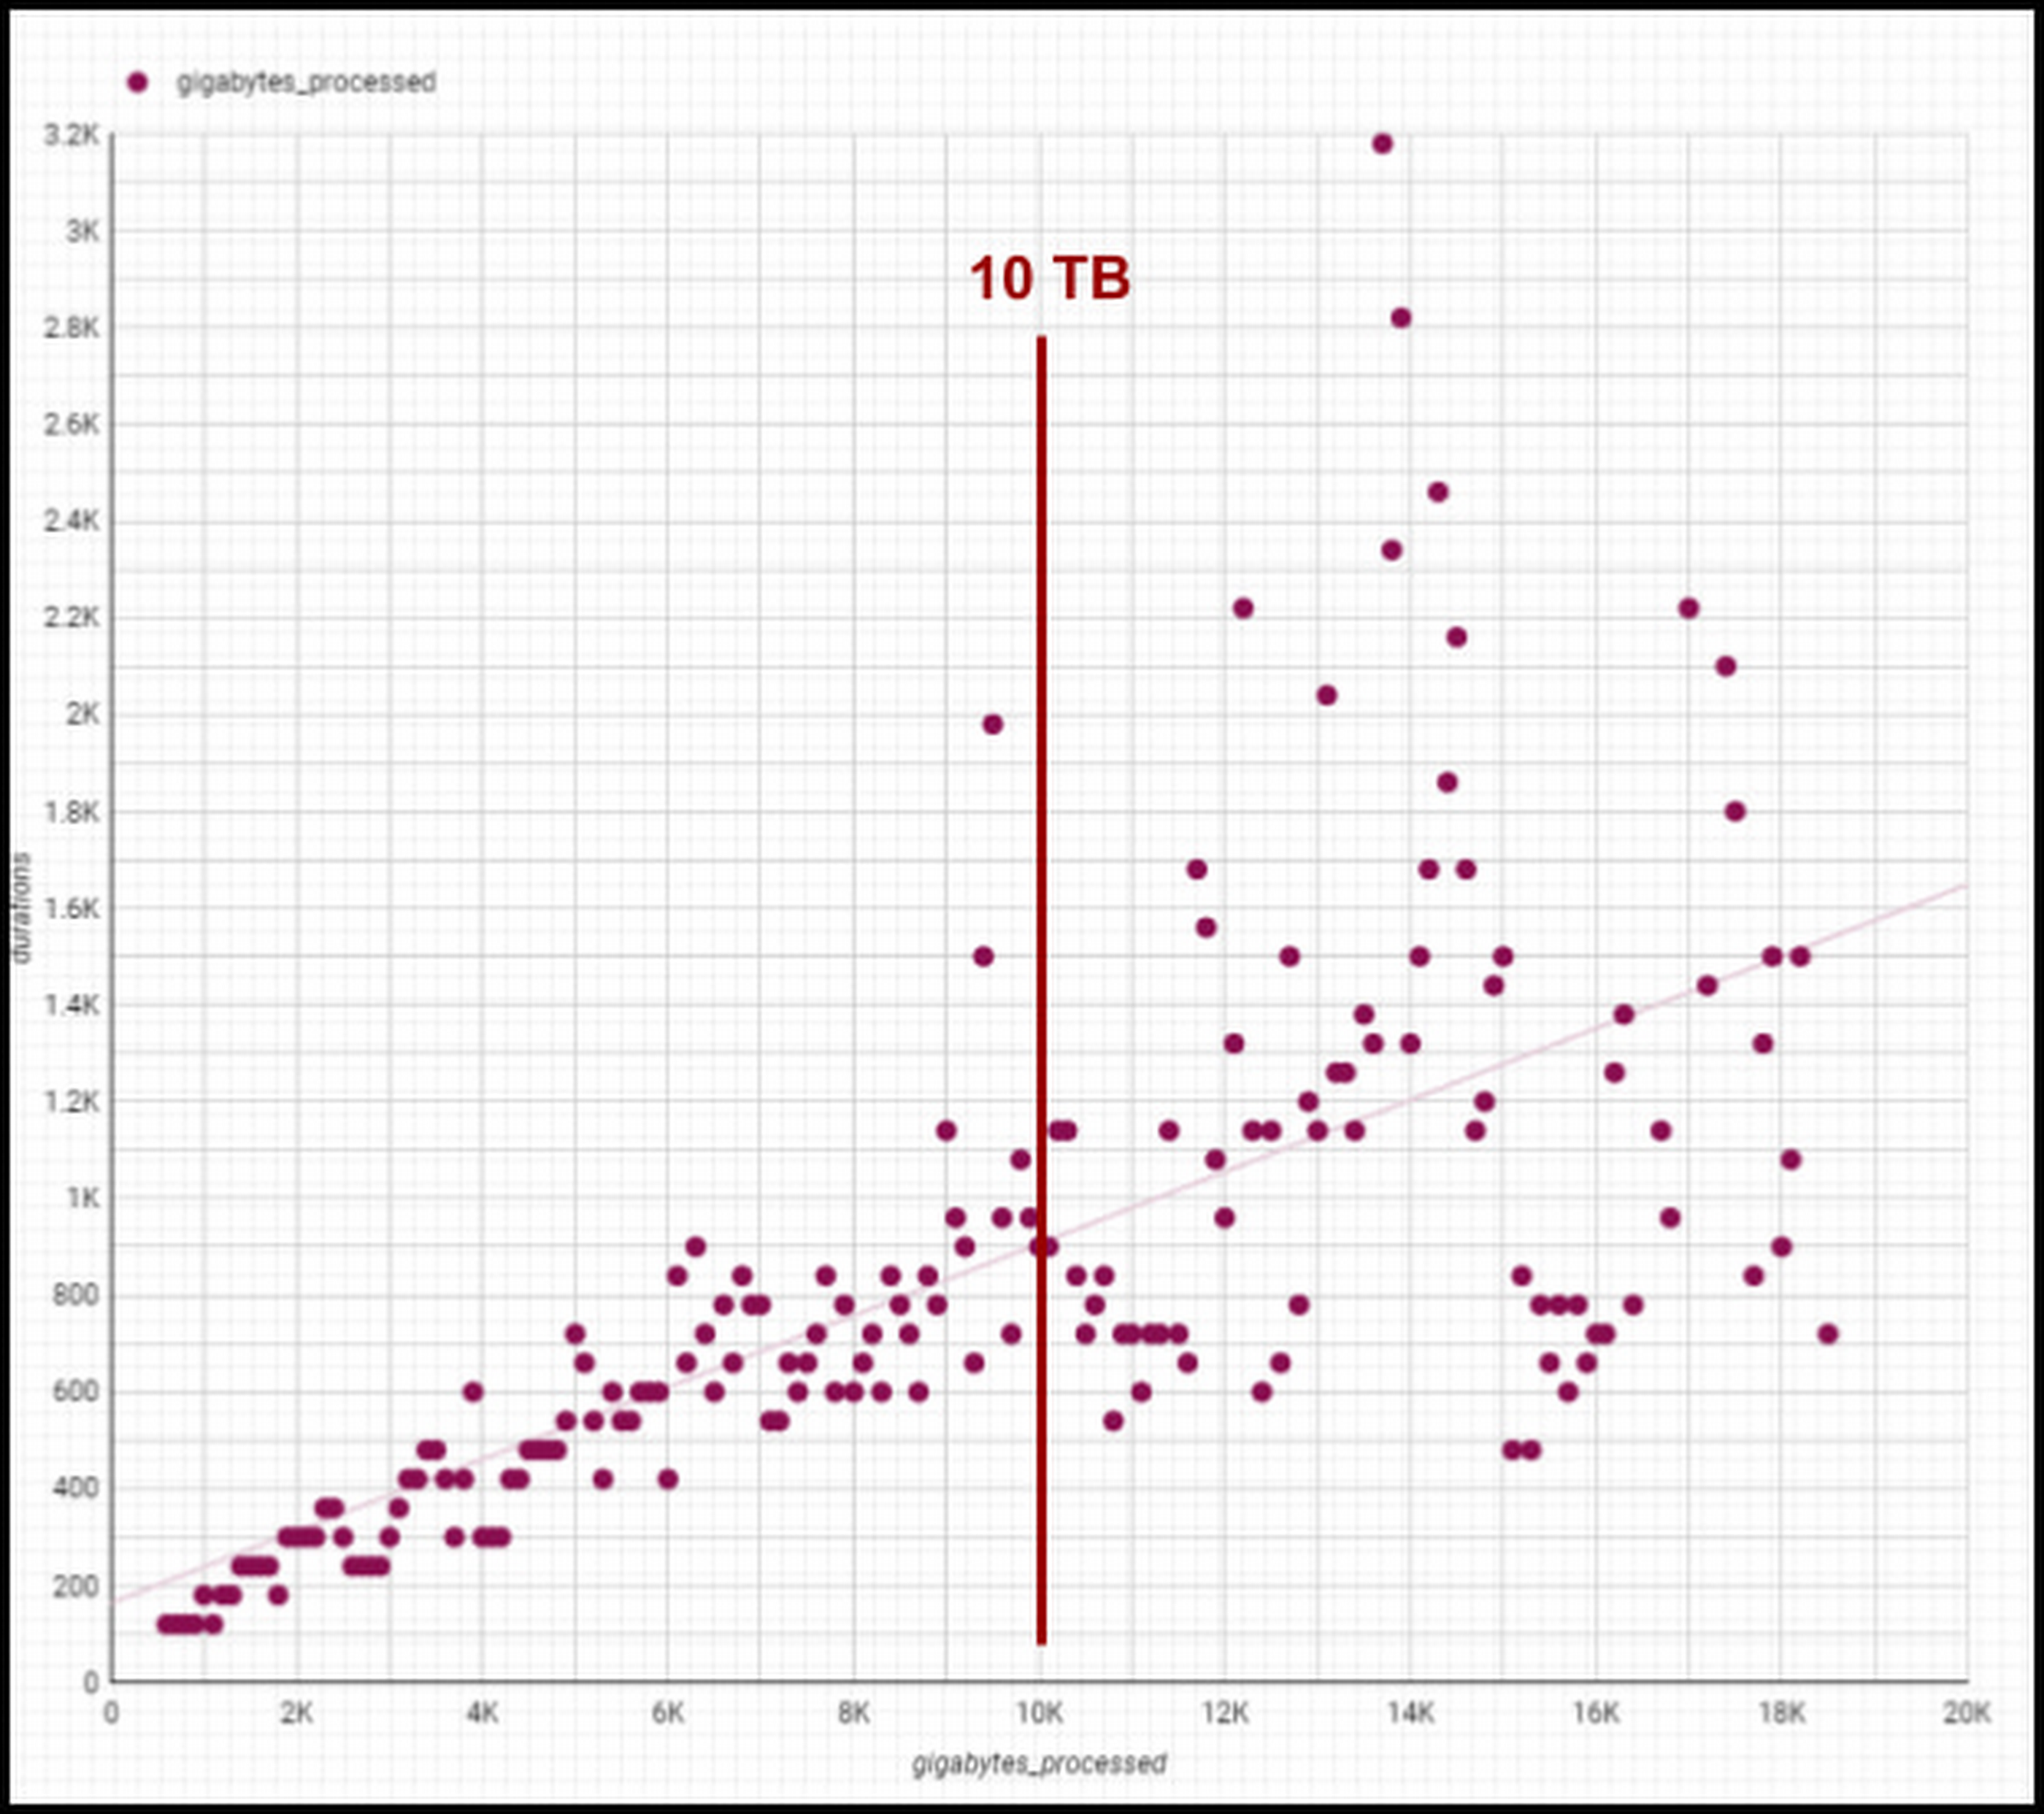
Though individual values vary greatly depending on query complexity [analytic functions/sorting can be computationally expensive], the overall trend line is below 1-1 for bytes versus duration, meaning our BigQuery query runtimes are increasing slower than our data volumes. We are still seeing sub 1:1 threshold runtimes, and we’re already at 100 PB of total data with single queries running on 50PB or more. Going strong!
One unexpected and pleasant surprise has been high performance for smaller queries, such as those required for development, interactive analytics, and internal applications we use for forecasting, segmentation, and other latency-sensitive data workflows. BigQuery’s resource management systems have provided smoother degradation and parallelism profiles than we initially expected for a multi-tenant platform.
We regularly see sub-second p50 query performance for interactive use cases, with p90 performance coming in under 10 seconds for Looker, Data Studio, and AtScale — meeting the threshold we set to avoid analysts losing focus during a business investigation. The chart below shows p50, p90, and p95 timing for core workloads, as well as the number of queries in each bucket and the number of unique users. [Looker and Atscale will use small numbers of service accounts for a large number of users].

This has enabled two important shifts in the way our customers experience analytics services:
- Delivering better user productivity. People no longer have long wait times to get results for a basic query delivering an improved overall user experience.
- Scaling our data transformation. BigQuery has proven, effective data transformation that allows us to embrace the industry shift away towards ELT (extract, load, transform) to transform raw data right within the database.
We no longer have to ask ourselves, “Can we meet the SLA for this data processing task?” The new conversation is, “Of course, we can meet it. What’s the associated cost based on how many resources we assign?” We can make cost and resource trade-offs clear to our users and say “yes” more often to requirements that have measurable business value.
Supporting cost vs. performance decisions
Democratized access to internal analytics is a powerful decision-making tool. With BigQuery’s robust tooling, the decision about how to best allocate computational resources is in the hands of the analytics groups closest to the business decision being made. If they want to spend a sprint optimizing a dashboard, they can show exactly how much money it will save. If they choose not to optimize a report, they can offset the decision with concrete cost savings and other realized value.
Wayfair teams also benefit from visibility into their committed costs by abstracting away the details of the underlying services, including BigQuery slots, the virtual CPUs used to execute SQL queries.
Take a look at this example view consumed by our teams (the metrics for these dashboards are from the BigQuery INFORMATION_SCHEMA (jobs and reservations tables):
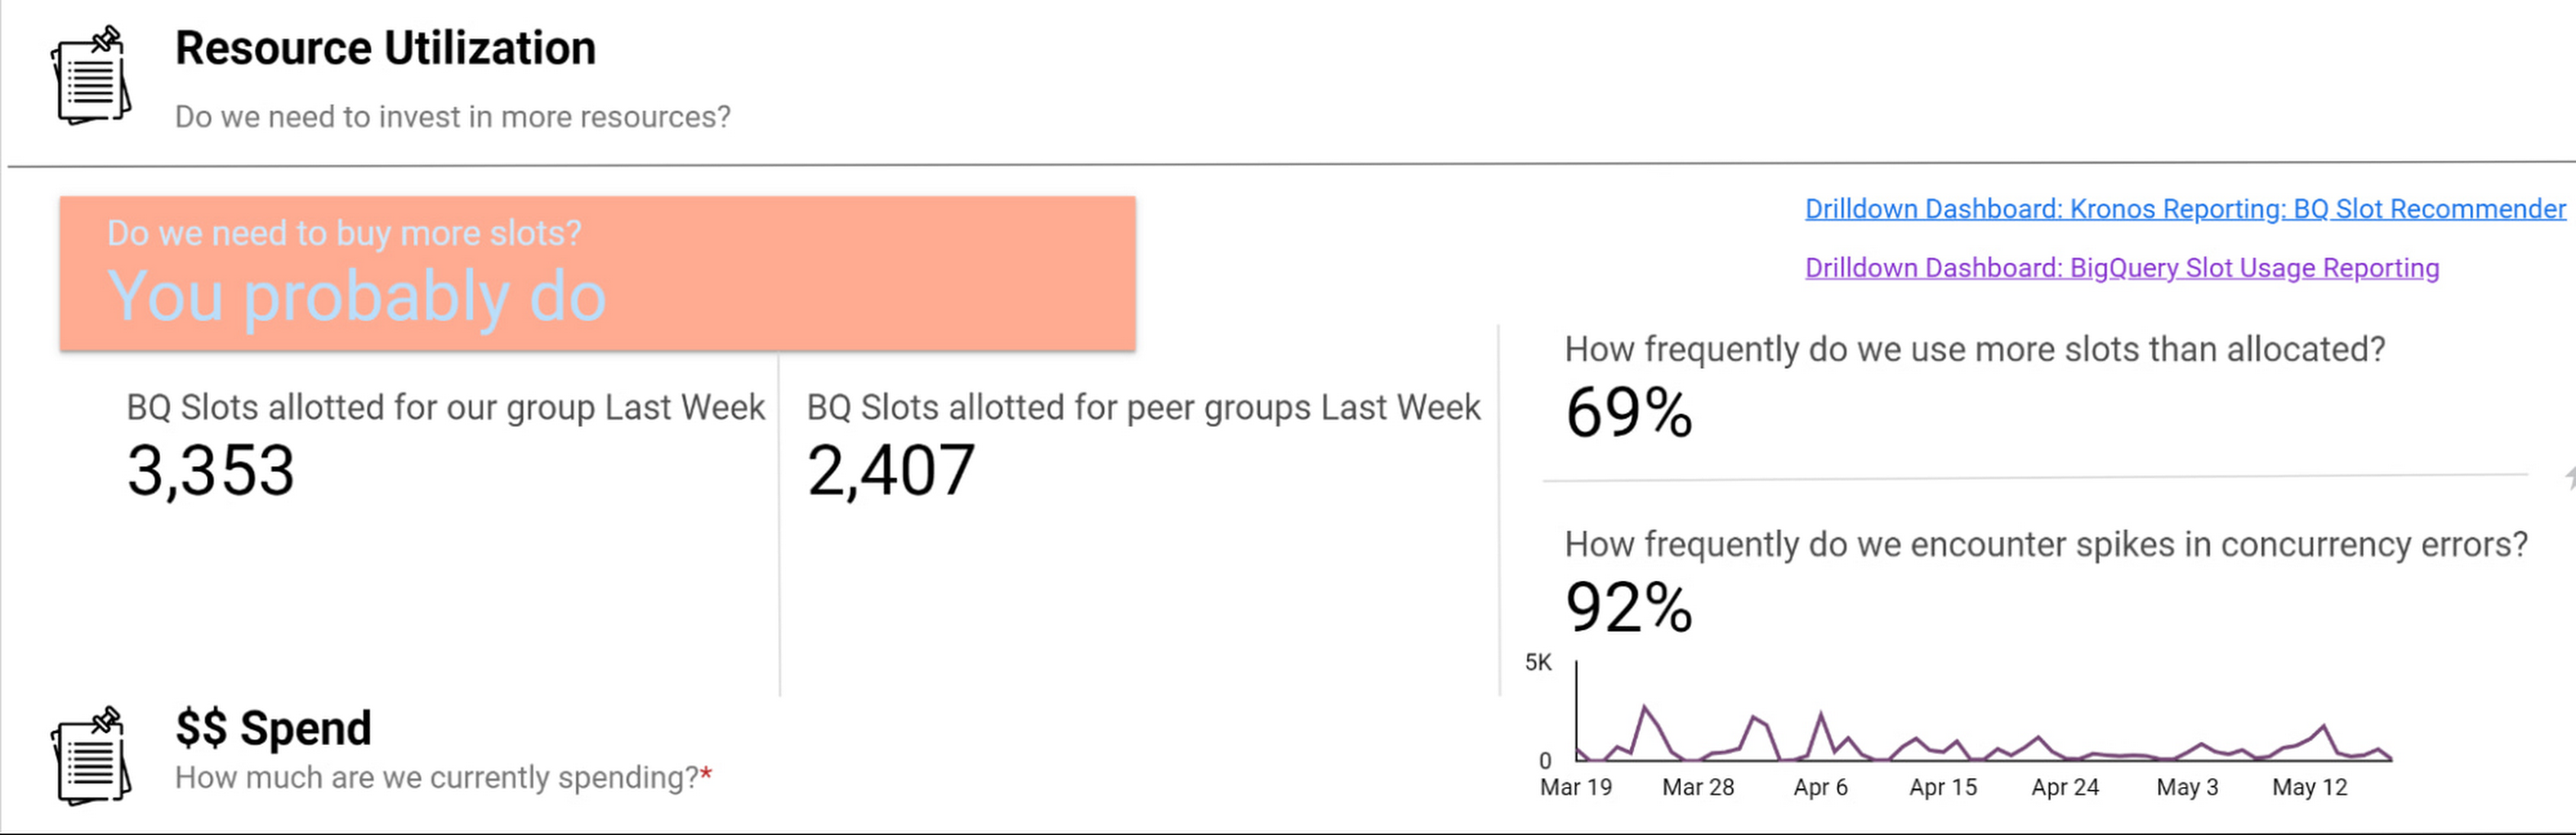
Suppose an organization wants to purchase capacity for a period of time. In that case, we provide an average cost for a slot during that time and charge them based on their slot usage for queries, multiplied by the average price.
Teams can see whether their consumption matches their reservations with a consistent, high-level number. We apply the same approach to tools like Dataproc by aggregating up the costs of component services and providing an organizational cost for those services.
How we use performance signals to improve user efficiency
Instead of overcorrecting for occasional performance fluctuations by allocating excessive resources, we try to align incentives so that people make the right choices for the business. Showback doesn’t work in a vacuum — it requires context and integrated insights. Teams need to show the cost of running a dashboard as well as the ROI is in terms of end user engagement and what peer dashboards with equivalent source datasets might cost.
We want to give users the freedom to do things the way they want and need to while also educating them on achieving their goals and using best practices to reduce their costs and improve their performance. The goal is never for all dashboards to load “less than x seconds” — we believe that any dashboard can load in x seconds when it is properly designed and resourced.
For instance, BigQuery allocates slots for a new workload quickly and efficiently, and queries that are optimized and have dedicated resources consistently complete quickly. When users experience a slowdown, it’s typically because they are sharing resources or inefficiently using their resources. Variable performance is a useful signal to help users discover opportunities to optimize queries and work more productively. We value these signals as we like to focus on the aggregate experience of all users interacting with the tool, not individual interaction.
A natural way to improve user efficiency is to reward ideal behaviors and discourage those that do not align with our analytics strategy. Some examples include splitting out high-demand reporting from ad-hoc exploration to reduce concurrency errors or encouraging people to use materialized tables instead of writing complex custom SQL. For instance, a dedicated reporting project might only include an organization’s Data Studio dashboard if it directly references a table or meets other optimization requirements. Using this approach, we give our users a high degree of freedom and experimentation at the entry-level while providing a well-documented path to scale.
Visibility into query performance improves business performance
The detailed tracking information we get from Google Cloud products is critical — Google’s robust analytics performance has enabled us to scale Data Studio to over 15,000 Wayfarians. Of course, a larger user base always comes with concerns that less sophisticated users may not appropriately optimize their queries or make the best use of the infrastructure.
Evaluating the different Data Studio dashboards helps us identify opportunities to use better query optimization practices, such as reducing custom queries, connecting directly to permanent tables, or using the BI Engine to improve dashboard performance. Recently, our team built new billing projects specific for Data Studio reporting. We can scale up a reservation dedicated to reporting about a major sales event in minutes.
Beyond everyday reporting, holidays and sales events may require higher, guaranteed performance. BigQuery’s flexible capacity commitments allow us to decide at a business level whether an urgent need requires us to reprioritize resources immediately or whether we have the time to optimize queries and rebuild dashboards to be performant. These new billing projects let us evaluate if teams need to scale up resourcing, what areas they can optimize in BigQuery, or if a new reservation is needed to resource that team separately.
Recommendations for achieving high performance at low cost
Are you wondering how to allocate BigQuery slots? Teams must see direct, immediate return on their investment in performance and optimization.
Our first rule of thumb is to align resource utilization with ownership as closely as possible. This makes it easier for teams to secure dedicated resources, even if they start out small. We’re comfortable doing this because BigQuery dynamically reassigns capacity between the targeted reservation and other consumers in milliseconds. We always get the total usage of our slots — there is no wasted capacity even when we break assignments down granularly.
Once a team has a reservation, we provide reporting that consumes various BigQuery information schema views, such as query logs and reservation information, and processes it into aggregated reporting. We look for metrics like the average slots available to a query at a point in time, overall query performance, and how long queries took to execute to pinpoint the overall health of a reservation against our business objectives. Flex slots also let us experiment easily with additional capacity, and BigQuery’s performance is so consistent that we can use straightforward models to estimate return on additional slot investment.
Other key cost optimization tips we have found helpful at Wayfair include:
- Optimize for worst-case performance. Given BigQuery’s ability to share slots, we expect teams will often see much better performance, but we find that thinking it’s more effective when teams think about the most pessimistic case when resourcing their jobs.
- Take advantage of BI Engine reservations. We like to think critically about the data and workload. BI Engine reservations are excellent for workloads that query lots of small dimension tables or a few larger tables loaded into memory. In cases like that, such as with OLAP tools using pre-computed aggregates, we’ve seen BI engine investments drive a 25% reduction in average query time—excellent ROI.
- Leverage Looker for large, longitudinal datasets. Since Looker supports a wide range of use cases, we see a broader range of performance — p50 is still under a second, but p95 can get as high as a minute. For these cases, we recommend modeling user patterns [first of month, first day of week] and dynamically allocating more slots for these periods while deprioritizing batch workloads in the key windows.
- Lean in heavily on the BQ cache for broad-based reporting. To avoid a Monday morning reporting lag, We use the BigQuery cache to avoid Monday morning report loading lags. Up to 30% of our Data Studio queries hit the BQ cache, ensuring our Data Studio p95 consistently stays under 10 seconds.
- Use slots-per-job to improve experience. In our reporting, we find that the most valuable view is slots-per-job. We look for dips in slots available for jobs as this situation often correlates strongly with poor user experiences. For example, our reporting showed us that Looker has the highest volumes of queries and users on Mondays and during each month’s first two business days. We used this information to scale up slots to support these periods of highest demand, delivering on performance SLAs to support business users.

- Get a global picture of usage. We manage slots in a central tool. Teams input their requirements into a calendar to indicate when they want higher or lower capacity to inform our flex slot purchases and annual commitments. It might seem like dozens of relatively inconsistent workloads at the team level, but the picture changes when you look at demand across a week (or our entire business). Understanding global usage makes it easy for us to model baseline capacity recommendations for serving year slots versus flexible demands.
Reaping the rewards of BigQuery
From our first initial undertaking with Google Cloud to transform our storefront, we had a lot of confidence in the underlying technology offerings and the teams that ran them and their ability to meet our unique requirements. But our experience using BigQuery for internal analytics at Wayfair has exceeded our already high expectations.
BigQuery’s fast, dynamic allocation of resources and ability to transform data in place are important to our mission of maintaining consistently high performance for our users while closely managing costs. Moreover, our visibility into query and dashboard performance through BigQuery’s DSP views and other performance metrics have helped us make clearer connections between performance goals and the costs required to meet them — and guide our analysts across the company towards attaining high performance on every project.
Turning the Tide: How PrestaShop Regained Trust in Data

4289
Of your peers have already read this article.
3:30 Minutes
The most insightful time you'll spend today!
Since 2007, PrestaShop has helped companies unlock the power of e-commerce through its open-source platform. Over 300,000 merchants worldwide use the PrestaShop platform to grow their business and serve online shoppers.
“Our open-source strategy to ecommerce enablement sets us apart,” says Rémi Paulin, Ph.D., Data Architect at PrestaShop. “Customization is becoming more crucial to retailers, and our open-source platform allows companies to continually evolve their sites and services to stand out from competitors.”
As PrestaShop grew, it wished to derive more value from its data, but the company ran into issues caused by a legacy, siloed architecture that negatively impacted data consistency and accessibility.
Let’s look at how PrestaShop works with Google Cloud and partners Fivetran and Hightouch to gain more control over data, enable a beyond-BI data strategy, and increase employee engagement from less than 10% to more than 40%.
Improving trust in data
Core systems at PrestaShop, including SQL and NoSQL databases, and SaaS Applications, were siloed; each presenting its own data, often captured from different sources such as support tickets, marketing engagement, purchase activity, and product usage. This setup made data overall inconsistent as no single system would contain a source of truth, resulting in many inefficiencies, poor collaboration across teams, and a reluctance to use data to support key decisions.
“Not long ago, less than 10% of the company regularly relied on data, so we were missing opportunities to make more data-driven decisions,” says Paulin. “Data was underutilized, and people were rapidly losing trust in data.”
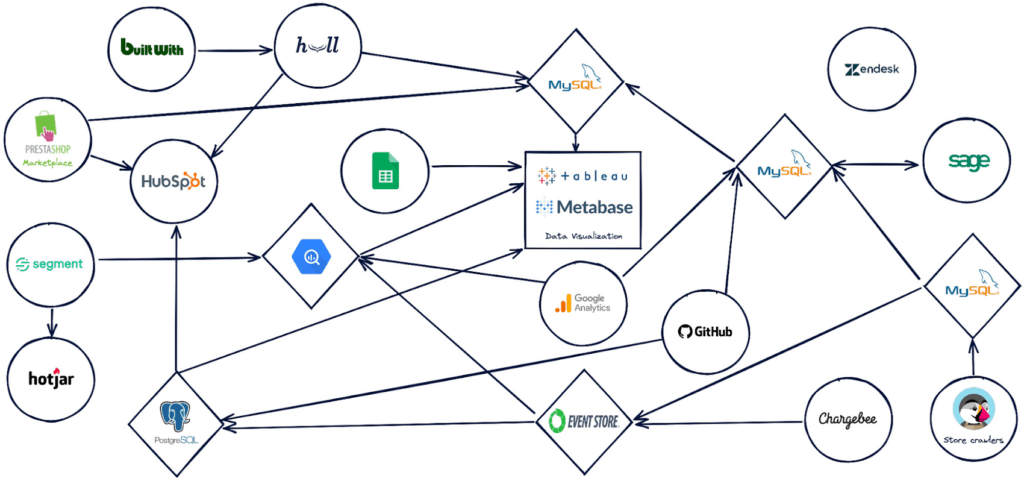
PrestaShop set out to design a new architecture to address past challenges, such as lack of data consistency, and improve data accessibility.
“Google Cloud, along with Hightouch and Fivetran, allowed us to build a modern stack to solve these challenges and support our beyond-BI data strategy.”
Building a modern data stack
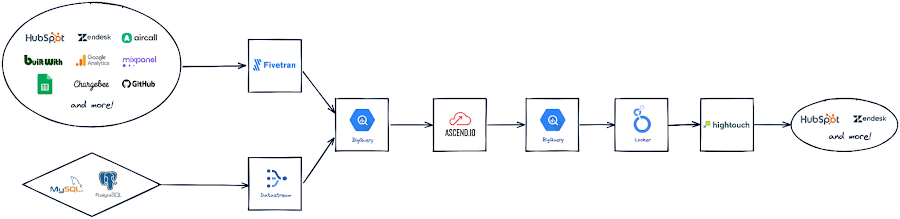
The first step was to build a robust data ingestion pipeline. After considering several vendors, PrestaShop chose to work with Fivetran to extract data from SaaS applications, including Zendesk, HubSpot, and GitHub, to load into BigQuery. They also use Datastream to stream Change Data Capture (CDC) data from transactional databases into BigQuery in real-time.
“Fivetran and Datastream are no-ops, efficient and highly reliable, and relieve our Data Engineers of management tasks. This brings us a high degree of confidence to build the rest of the stack atop these services,” says Paulin.
PrestaShop relies on several Google Cloud solutions, including Dataflow, and a managed Spark service by Ascend.io, for data transformation. It also uses Looker for its semantic modeling capacities and as a self-serve data platform.
As the company continued on its journey to transform how it manages and benefits from data, it engaged Hightouch to enable data accessibility through activation. Sitting on top of Looker, Hightouch unlocks all data models for operational intelligence. For example, in just a few days, the team built a customer knowledge model combining data from multiple sources and used Hightouch to sync data from the semantic layer to Zendesk via Reverse ETL. This allowed the care team to make more data-informed decisions, speeding up the time to resolve support tickets submitted through Zendesk by 33%.
“Hightouch feels like a natural extension of Looker and reinforces the position of the semantic data model as the single source of truth,” says Paulin. “It powers a variety of Data Activation use cases, supporting our beyond-BI strategy by providing teams with access to data when and where they need it to improve everyday operations. This has a big impact on the company, bolstering employee trust in available data.”
Becoming data-driven
In less than six months, PrestaShop managed to get the entire data stack up and running, build over 30 data models and engage over 120 employees with a small team of only two Data Engineers.
“Data is now accessible to every stakeholder within the company, regardless of their technical abilities,” says Paulin.
PrestaShop has already seen much progress in its shift to a more data-driven company and is excited to roll out more self-service intelligence capabilities in the future.
“Google Cloud drives home a culture of simplicity around our data stack, which is essential for us, especially given the small size of our engineering team,” says Paulin. “Fivetran and Hightouch share this culture of simplicity. Together, they offer strong foundations to support our data needs.”
Dashboards, which the company had always had an appetite for, are seamlessly created today. Before moving to Looker, a full-fledged dashboard would take an average of six weeks to develop. Now, it takes less than two days – and a simple dashboard can be created autonomously by business users in as little as 15 minutes.
Furthermore, data usage goes beyond dashboards. Thanks to Looker’s self-service exploration capabilities, many stakeholders can now glean insights surrounding product issues and business opportunities. Thanks to Hightouch, teams can activate their data to make better and smarter operational decisions.
“This is a big leap forward and one of many to come as we continue to add new models, activate our data, and onboard more users,” says Paulin. “Given our global reach and unique approach to e-commerce enablement, we know this is just the start of the great things we can accomplish with Google Cloud, Fivetran, and Hightouch.”
Check out Fivetran on Google Cloud Marketplace, or sign up for a free Hightouch workspace to learn more about what partners can do for your business.

AirAsia Turns to Google Cloud to refine Pricing, Increase Revenue, and Improve Customer Experience
DOWNLOAD CASE STUDY7141
Of your peers have already downloaded this article
1:30 Minutes
The most insightful time you'll spend today!
AirAsia needed a platform incorporating products that could capture, process, analyze, and report on data, while delivering value for money and meeting its speed and availability requirements. The airline also wanted to minimise infrastructure management and system administration demands on its technology team members.
The airline conducted a proof of concept and found Google Cloud Platform—including the Google BigQuery analytics data warehouse—was the best fit.
AirAsia was impressed by the ease and flexibility with which it could extract, transform, and load customer data from its systems, websites, and mobile applications into Google BigQuery for analysis. Reporting and dashboards were quickly and effectively delivered through Google Data Studio.
“With a minimal number of people involved, we can very quickly transform an idea or thought process into a deliverable. Prior to Google Cloud Platform, bringing those ideas to fruition would have been impossible,” says Nikunj Shanti, Chief Data and Digital Officer, AirAsia.
Transform Your Customer Experience with Latest Database Innovations

2990
Of your peers have already read this article.
2:30 Minutes
The most insightful time you'll spend today!
We’re all accustomed to Google magic in our daily lives. When we need information like the time a store closes, the best route to a destination, help cooking a favorite recipe — we just ask Google. Google is known for providing useful information everywhere, wherever you are.
But for business, it isn’t so easy to get answers to important questions. In a recent study by HBR, only 30% of respondents report having a well-articulated data strategy and, at most, 24% of respondents said they thought their organization was data-driven. If you asked, most of these executives would probably tell you they’re drowning in data, so how come they’re struggling to be data-driven?
Data’s journey begins in operational databases, where the data is born as users and systems interact with applications. Operational databases are the backbone of applications and are essential ingredients for building innovative customer experiences. At Google Cloud, we have been focused on building a unified and open platform that provides you the easiest and fastest way to innovate with data. Google’s data cloud enables data teams to manage each stage of the data lifecycle from operational transactions in databases to analytical applications across data warehouses, lakes, data marts, and to rich data-driven experiences.
For example, Merpay, a mobile payment service in Japan, wanted to build its experience on a database that delivered on requirements around availability, scalability and performance. By using Cloud Spanner, Merpay was able to reduce overhead costs and ultimately devote engineering resources to developing new tools and solutions for their customers.
If you’re looking to bring the same kinds of transformation to your organization, let’s dive into the latest database announcements and how they can help you do that:
Tap into transformative database capabilities
Google’s data cloud allows organizations to build transformative applications quickly with our one-of-a-kind databases such as Cloud Spanner, Google Cloud’s fully managed relational database with global scale, strong consistency, and industry leading 99.999% availability. Leading businesses across industries such as Sabre, Vimeo, Uber, ShareChat, Niantic, and Macy‘s use Spanner to power their mission-critical applications and delight customers. Recent innovations in Spanner such as granular instance sizing and PostgreSQL interface lower the barrier to entry for Spanner, thus making it accessible for any developer and for any application, big or small.
In that effort, we are excited to announce Spanner free trial instances to give developers an easy way to explore Spanner at no cost. The new free trial for Spanner provides a zero-cost, hands–on experience to try out Spanner and comes with guided tutorials and a sample database. The Spanner free trial provides a Spanner instance with 10GB storage for 90 days. Customers can upgrade to a paid instance anytime during the 90-day period to continue exploring Spanner and unlock the full capabilities of Spanner, such as unlimited scaling and multi-region deployments. To learn more about the new free trial, you can read this blog and watch this short video. Start your free trial today in the Google Cloud console.
We’re also excited to announce the preview of fine-grained access control for Spanner that lets you authorize access to Spanner data at the table and column level. Spanner already provides access control with Identity and Access Management (IAM) which enables a simple and consistent access control interface for all Google Cloud services. With fine-grained access control, it’s now easier than ever to protect your transactional data in Spanner and ensure appropriate security controls are in place when granting access to data. Learn more about fine-grained access control in this blog.
Generate exponential value from data with a unified data cloud
Google’s common infrastructure for data management has many advantages. Thanks to our highly durable distributed file systems, disaggregated compute and storage at every layer, and high-performance Google-owned global networking, we’re able to provide best-in-class, tightly integrated operational and analytical data services with superior availability and scale at the best price- performance and operational efficiency.
In that effort, today we’re excited to announce Datastream for BigQuery, now in preview. Developed in close partnership with the BigQuery team, Datastream for BigQuery delivers a unique, truly seamless and easy-to-use experience that enables real-time insights in BigQuery with just a few steps.
Datastream efficiently replicates updates directly from source systems into BigQuery tables in real-time by using BigQuery’s newly developed Change Data Capture (CDC) and Storage Write API’s UPSERT functionality. You no longer have to waste valuable resources building and managing complex data pipelines, self-managing staging tables, tricky DML merge logic, or manual conversion from database-specific data types into BigQuery data types. Just configure your source database, connection type, and destination in BigQuery and you’re all set.
Klook, a Hong Kong-based travel company, is one industry-leading enterprise using Datastream for BigQuery to help drive better business decisions. “Prior to adopting Datastream, we had a team of data engineers dedicated to the task of ingesting data into BigQuery, and we spent a lot of time and effort making sure that the data was accurate,” said Stacy Zhu, senior manager for data at Klook. “With Datastream, our data analysts can have accurate data readily available to them in BigQuery with a simple click. We enjoy Datastream’s ease of use and its performance helps us achieve large scale ELT data processing.”
Achievers, an award-winning employee engagement software and platform, recently adopted Datastream, as well. “Achievers had been heavily using Google Cloud VMs (GCE), and Google Kubernetes Engine (GKE)” says Daljeet Saini, lead data architect at Achievers. “With the help of Datastream, Achievers will be streaming data into BigQuery and enabling our analysts and data scientists to start using BigQuery for smart analytics, helping us take the data warehouse to the next level.”
To make it easier to stream database changes to BigQuery and other destinations, Datastream is also adding support for PostgreSQL databases as a source, also in preview. Datastream sources now include MySQL, PostgreSQL, AlloyDB for PostgreSQL, and Oracle databases, which can be hosted on premises, on Google Cloud services such as Cloud SQL or Bare Metal Solution for Oracle, or anywhere else on any cloud.
Key use cases for Datastream include real-time analytics, database replication via continuous change data capture, and enablement of event-driven application architectures. In real-world terms, real-time insights can help a call center provide better service by measuring call wait times continuously, rather than retrospectively at the end of the week or month. And retailers or logistics companies that do inventory management based on real-time data can become far less wasteful than if it were based on periodic reports.
Accelerate your modernization journey to the cloud
In recent years, application developers and IT decision makers have increasingly adopted open-source databases to ensure application portability and extensibility and prevent lock-in. They’re no longer willing to tolerate the opaque costs or the overpriced and restrictive licensing of legacy database vendors.
In particular, PostgreSQL has become the emerging standard for cloud-based enterprise applications. Many organizations are choosing to standardize on PostgreSQL to reduce the learning curve for their teams and avoid the lock-in from the previous generation of databases. Google’s data cloud offers several PostgreSQL database options including AlloyDB for PostgreSQL, a PostgreSQL-compatible database that provides a powerful option for migrating, modernizing, or building commercial-grade workloads
To help developers and data engineers modernize and migrate their applications and databases to the cloud, we’re pleased to announce, in preview, that our Database Migration Service (DMS) now supports PostgreSQL migrations to AlloyDB. DMS makes the journey from PostgreSQL to AlloyDB easier and faster, with a serverless migration you can set up in just a few clicks. Together with Oracle to PostgreSQL data and schema migration support, also in preview, DMS gives you a way to modernize legacy databases and adopt a modern, open technology platform. Learn more about PostgreSQL to AlloyDB migration with DMS in this blog.
Among organizations adopting PostgreSQL is SenseData. A platform created to improve the relationship between companies and customers, SenseData is a market leader in Latin America in the field of Customer Success.
“At Sensedata, we’ve built our customer success platform on PostgreSQL, and are looking to increase our platform performance and scale for the next phase of our growth,” said Paulo Souza, co-founder and CTO of SenseData. “We have a mixed database workload, requiring both fast transactional performance and powerful analytical processing capabilities, and our initial testing of AlloyDB for PostgreSQL has given impressive results, with more than a 350% performance improvement in our initial workload, without any application changes. We’re looking forward to using Database Migration Service for an easy migration of multiple terabytes of data to AlloyDB.”
CURA Grupo is one of Brazil’s largest medical diagnostics conglomerates with over 1,600 employees, 500 qualified physicians, and 6 million examinations conducted every year. With more than 30,000 examinations performed every day, storing the database on premises was becoming increasingly unfeasible. CURA Grupo used Database Migration Service to migrate to Google Cloud, along with synchronization between their on-prem server’s database and the cloud. The result was an easy transition with just around 20 minutes of downtime.
To learn more about these exciting innovations and more, join us at Next 22 happening on October 11-13. You will also hear from customers such as PLAID, Major League Baseball, DaVita, CERC, Credit Karma, Box, and Forbes who are all innovating faster with Google Cloud databases.
Four Key Takeaways from Google and Quantum Metric’s Back-to-School Retail Benchmark Study

4792
Of your peers have already read this article.
2:00 Minutes
The most insightful time you'll spend today!
Is it September yet? Hardly! School is barely out for the summer. But according to Google and Quantum Metric research, the back-to-school and off-to-college shopping season – which in the U.S. is second only to the holidays in terms of purchasing volume1 – has already begun. For retailers, that means planning for this peak season has kicked off as well.
We’d like to share four key trends that emerged from Google research and Quantum Metric’s Back-to-School Retail Benchmarks study of U.S. retail data, explore the reasons behind them, and outline the key takeaways.
- Out-of-stock and inflation concerns are changing the way consumers shop. Back-to-school shoppers are starting earlier every year, with 41% beginning even before school is out – even more so when buying for college1. Why? The behavior is driven in large part by consumers’ concerns that they won’t be able to get what they need if they wait too long. 29% of shoppers start looking a full month before they need something1.
Back-to-school purchasing volume is quite high, with the majority spending up to $500 and 21% spending more than $1,0001. In fact, looking at year-over-year data, we see that average cart values have not only doubled since November 2021, but increased since the holidays1. And keep in mind that back-to-school spending is a key indicator leading into the holiday season.
That said, as people are reacting to inflation, they are comparing prices, hunting for bargains, and generally taking more time to plan. This is borne out by the fact that 76% of online shoppers are adding items to their carts and waiting to see if they go on sale before making the purchase1. And, to help stay on budget and reduce shipping costs, 74% plan to make multiple purchases in one checkout1. That carries over to in-store shopping, when consumers are buying more in one visit to reduce trips and save on gas.
2. The omnichannel theme continues. Consumers continue to use multiple channels in their shopping experience. As the pandemic has abated, some 82% expect that their back-to-school buying will be in-store, and 60% plan to purchase online. But in any case, 45% of consumers report that they will use both channels; more than 50% research online first before ever setting foot in a store2. Some use as many as five channels, including video and social media, and these 54% of consumers spend 1.5 times more compared to those who use only two channels4.
And mobile is a big part of the journey. Shoppers are using their phones to make purchases, especially for deadline-driven, last-minute needs, and often check prices on other retailers’ websites while shopping in-store. Anecdotally, mobile is a big part of how we ourselves shop with our children, who like to swipe on the phone through different options for colors and styles. We use our desktops when shopping on our own, especially for items that require research and represent a larger investment – and our study shows that’s quite common.
3. Consumers are making frequent use of wish lists. One trend we have observed is a higher abandonment rate, especially for apparel and general home and school supplies, compared to bigger-ticket items that require more research. But that can be attributed in part to the increasing use of wish lists. Online shoppers are picking a few things that look appealing or items on sale, saving them in wish lists, and then choosing just a few to purchase. Our research shows that 39% of consumers build one or two wish lists per month, while 28% said they build one or two each week, often using their lists to help with budgeting1.
4. Frustration rates have dropped significantly. Abandonment rates aside, shopper annoyance rates are down by 41%, year over year1. This is despite out-of-stock concerns and higher prices. But one key finding showed that both cart abandonment and “rage clicks” are more frequent on desktops, possibly because people investing time on search also have more time to complain to customer service.
And frustration does still exist. Some $300 billion is lost each year in the U.S. from bad search experiences5. Data collected internationally shows that 80% of consumers view a brand differently after experiencing search difficulties, and 97% favor websites where they can quickly find what they are looking for5.
Lessons to Learn
What are the key takeaways for retailers? In general, consider the sources of customer pain points and find ways to erase friction. Improve search and personalization. And focus on improving the customer experience and building loyalty. Specifically:
80% of shoppers want personalization6. Think about how you can drive personalized promotions or experiences that will drive higher engagement with your brand.
46% of consumers want more time to research1. Drive toward providing more robust research and product information points, like comparison charts, images, and specific product details.
43% of consumers want a discount1, but given current economic trends, retailers may not be offering discounts. In order to appease budget-conscious shoppers, retailers can consider other retention strategies such as driving loyalty using points, rewards, or faster-shipping perks.
Be sure to keep returns as simple as possible so consumers feel confident when making a purchase, and reduce possible friction points if a consumer decides to make a return. 43% of shoppers return at least a quarter of the products they buy and do not want to pay for shipping or jump through hoops1.
How We Can Help
Google-sponsored research shows that price, deals, and promotions are important to 68% of back-to-school shoppers.7 In addition, shoppers want certainty that they will get what they want. Google Cloud can make it easier for retailers to enable customers to find the right products with discovery solutions. These solutions provide Google-quality search and recommendations on a retailer’s own digital properties, helping to increase conversions and reduce search abandonment. In addition, Quantum Metric solutions, available on the Google Cloud Marketplace, are built with BigQuery, which helps retailers consolidate and unlock the power of their raw data to identify areas of friction and deliver improved digital shopping experiences.
We invite you to watch the Total Retail webinar “4 ways retailers can get ready for back-to-school, off-to college” on demand and to view the full Back-to-School Retail Benchmarks report from Quantum Metric.
Sources:
1. Back-to-School Retail Benchmarks report from Quantum Metric
2. Google/Ipsos,Moments 2021, Jun 2021, Online survey, US, n=335 Back to School shoppers
3. Google/Ipsos, Moments 2021, Jun 2021, Online survey, US, n=2,006 American general population 18+
4. Google/Ipsos, Holiday Shopping Study, Oct 2021 – Jan 2022, Online survey, US, n=7,253, Americans 18+ who conducted holiday shopping activities in past two days
5. Google Cloud Blog, Nov 2021, “Research: Search abandonment has a lasting impact on brand loyalty”
6. McKinsey & Company, “Personalizing the customer experience: Driving differentiation in retail”
7. Think with Google, July 2021, “What to expect from shoppers this back-to-school season”
More Relevant Stories for Your Company

Transforming Software Development Education with CourseMatix
As the world increasingly relies on software, businesses have struggled to find enough developer talent to build and maintain their applications. IDC estimates the global shortage of software developers reached 1.4 million in 2021 and expects that number to balloon to 4 million by 2025. Higher education is a great starting

Google Cloud Migration Speeds Up The New York Times’ Journey to New Normal
Like virtually every business across the globe, The New York Times had to quickly adapt to the challenges of the coronavirus pandemic last year. Fortunately, our data system with Google Cloud positioned us to perform quickly and efficiently in the new normal. How we use data We have an end-to-end type of

Tyson Foods’ Story of Unlocking Opportunities by Integrating Real-time Analytics with AI and BI
As data environments become more complex, companies are turning to streaming analytics solutions that analyze data as it’s ingested and deliver immediate, high-value insights into what is happening now. These insights enable decision makers to act in real time to take advantage of opportunities or respond to issues as they

Principles to Make Organizations Data Engineering Driven
In the “What type of data processing organisation” paper, we examined that you can build a data culture whether your organization consists mostly of data analysts, or data engineers, or data scientists. However, the path and technologies to become a data-driven innovator are different and success comes from implementing the right
