






3134
Of your peers have already downloaded this article
22:30 Minutes
The most insightful time you'll spend today!
6813
Of your peers have already watched this video.
2:30 Minutes
The most insightful time you'll spend today!
What is BigQuery?
BigQuery is Google Cloud’s enterprise data warehouse designed to help you ingest, store, analyze, and visualize big data with ease.
Organizations rely on data warehouses to aggregate data from disparate sources, process it, and make it readily available for data analysis that supports their strategic decision-making.
You can ingest data into BigQuery either through batch uploading or streaming data directly to deliver real-time insights.
As a fully-managed data warehouse, Google takes care of the infrastructure so you can focus on analyzing your data up to petabyte scale.
BigQuery supports the same Structured Query Language, or SQL, for analyzing your data, which you may be familiar with if you’ve worked with ANSI-compliant relational databases in the past.
If you’re looking to create machine learning models using your enterprise data, you can do so with BigQuery ML.
With only a few lines of SQL, you can train and execute models on your BigQuery data without needing to move it around.
When it comes time to visualize your data, BigQuery integrates with Looker, as well as several other business intelligence tools across our partner ecosystem.
Now, how do you use BigQuery?
Luckily, it’s straightforward to get up and running with BigQuery.
After creating a GCP project, you can immediately start querying public data sets, which Google Cloud hosts and makes available to all BigQuery users, or you can load your own data into BigQuery to analyze.
Interacting with BigQuery to load data, run queries, or even create ML models can be done in three different ways.
First is by using the UI and the Cloud Console. Second is by using the BigQuery command line tool. And third is by making calls to the BigQuery API, using client libraries available in several languages.
BigQuery is integrated with Google Cloud’s Identity and Access Management Service so you can securely share your data and analytical insights across the organization.
What does it cost to use BigQuery?
With BigQuery, you pay for storing and querying data and streaming inserts.
Loading and exporting data are free of charge.
Storage costs are based on the amount of data stored and have two rates based on how often the data is changing.
Query costs can be either on demand, meaning you are charged per query by the amount of data processed, or flat rate for customers who want to purchase dedicated resources.
Vector Search: The Tech Powering Billions of Search Results for Google Users

4551
Of your peers have already read this article.
1:30 Minutes
The most insightful time you'll spend today!
Recently, Google Cloud partner Groovenauts, Inc. published a live demo of MatchIt Fast. As the demo shows, you can find images and text similar to a selected sample from a collection of millions in a matter of milliseconds:

Give it a try — and either select a preset image or upload one of your own. Once you make your choice, you will get the top 25 similar images from two million images on Wikimedia images in an instant, as you can see in the video above. No caching involved.
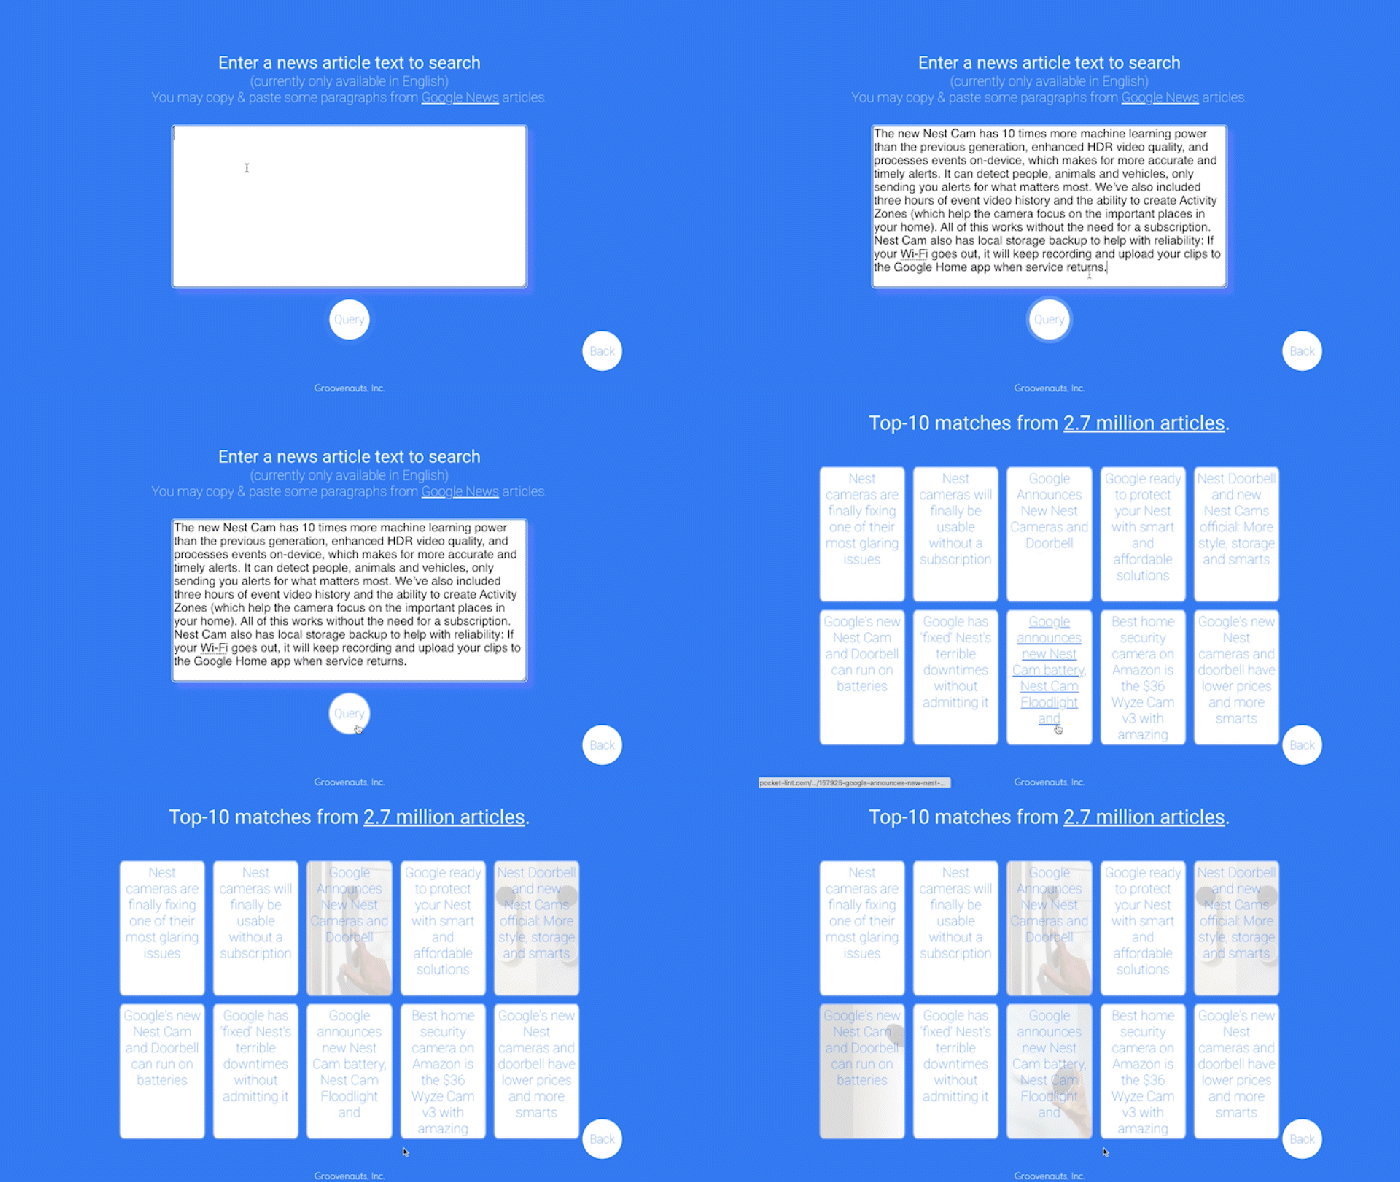
The demo also lets you perform the similarity search with news articles. Just copy and paste some paragraphs from any news article, and get similar articles from 2.7 million articles on the GDELT project within a second.
Vector Search: the technology behind Google Search, YouTube, Play, and more
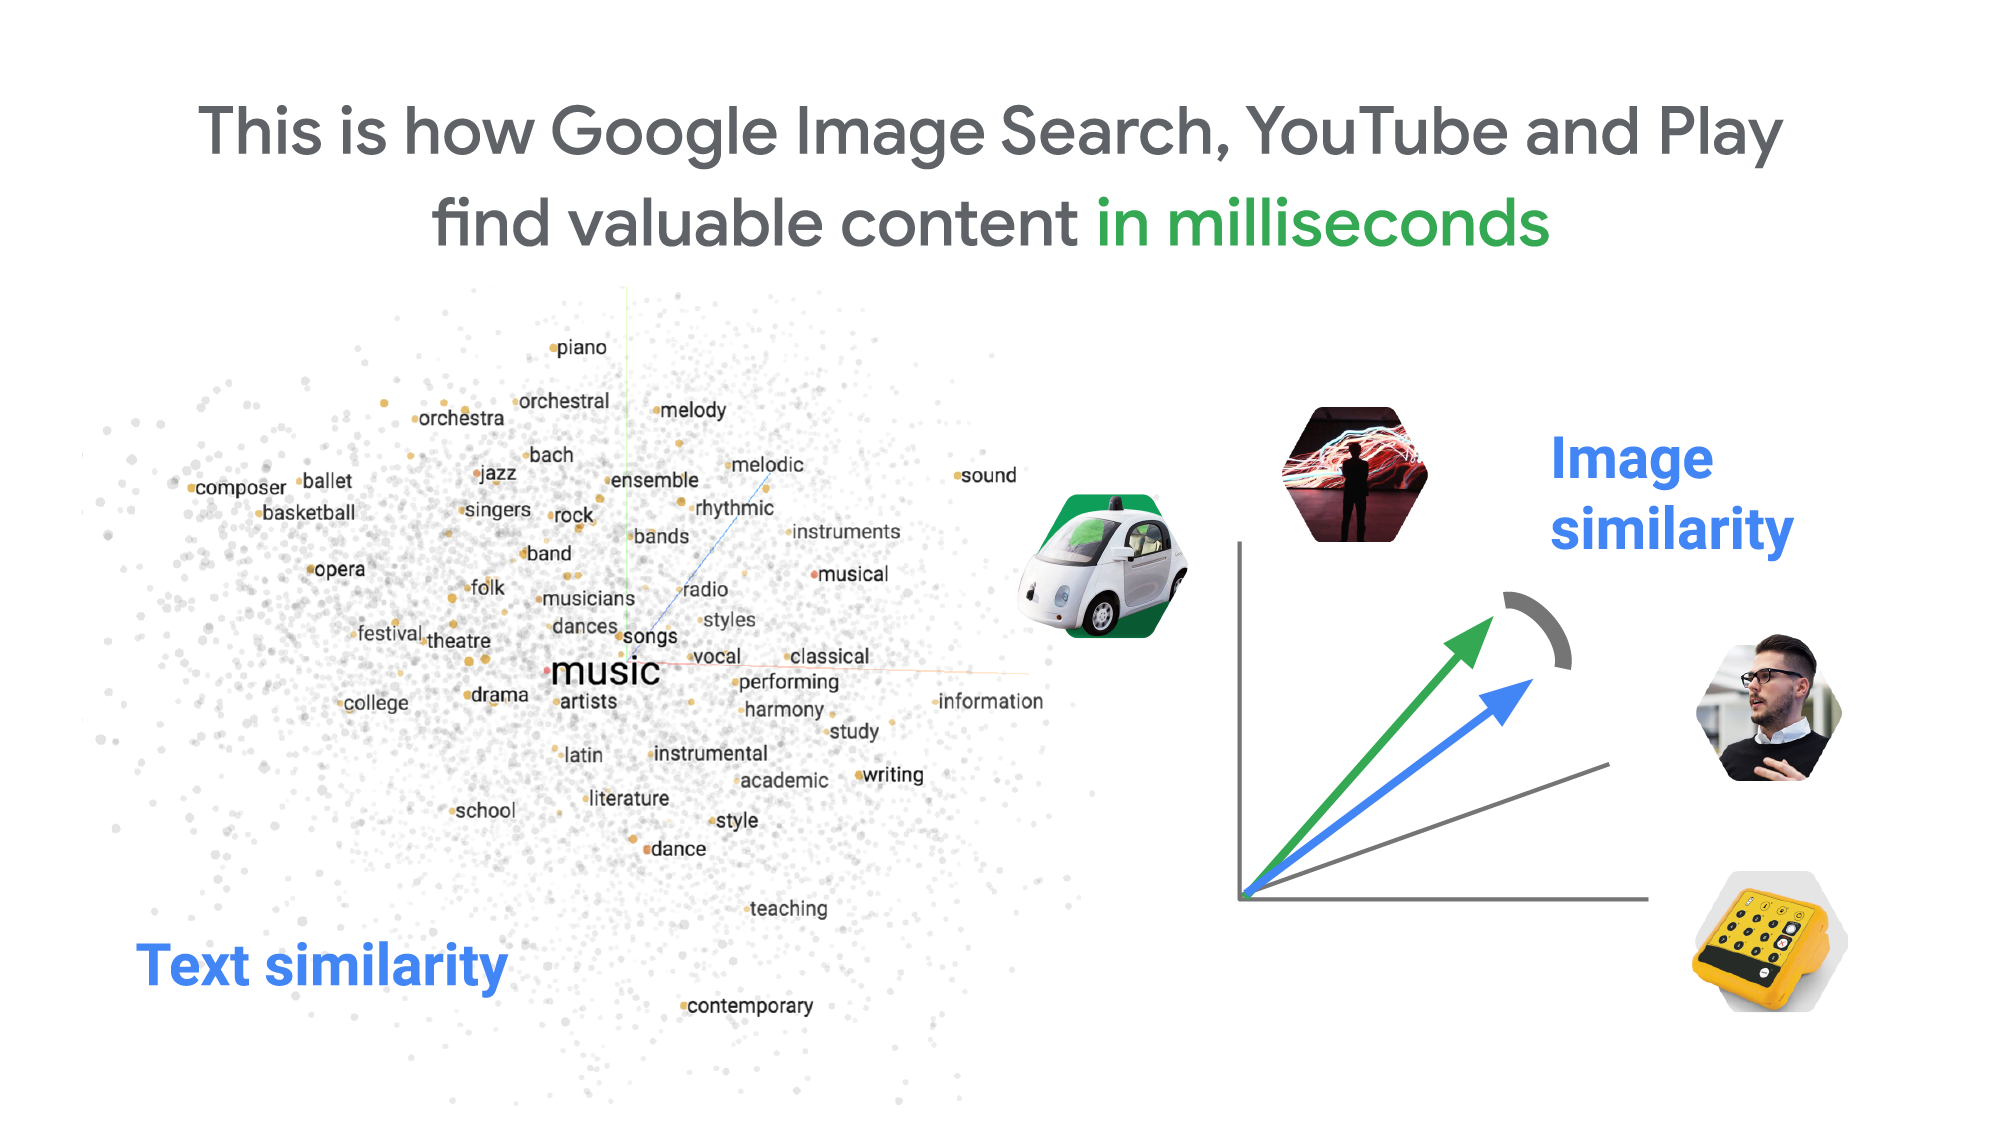
How can it find matches that fast? The trick is that the MatchIt Fast demo uses the vector similarity search (or nearest neighbor search or simply vector search) capabilities of the Vertex AI Matching Engine, which shares the same backend as Google Image Search, YouTube, Google Play, and more, for billions of recommendations and information retrievals for Google users worldwide. The technology is one of the most important components of Google’s core services, and not just for Google: it is becoming a vital component of many popular web services that rely on content search and information retrieval accelerated by the power of deep neural networks.
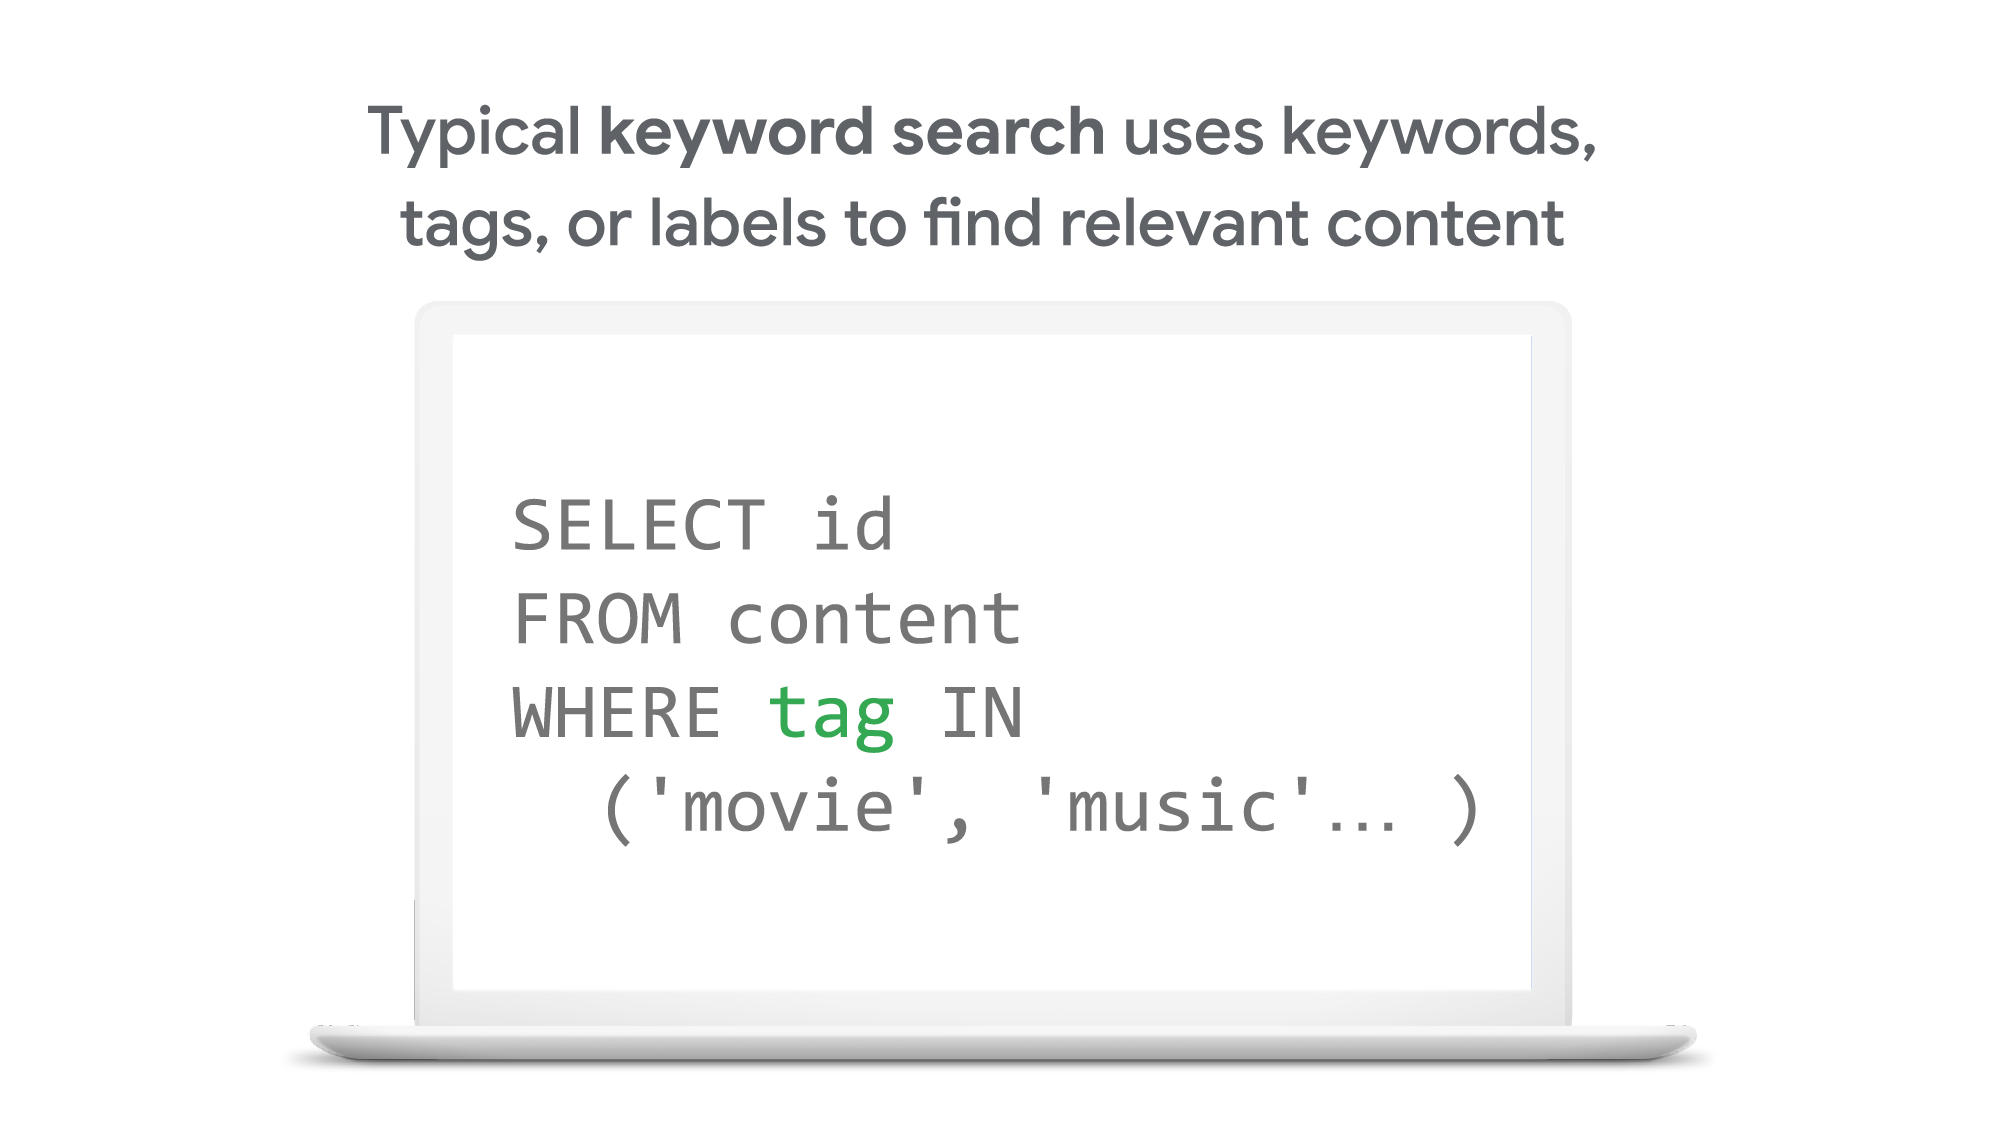
So what’s the difference between traditional keyword-based search and vector similarity search? For many years, relational databases and full-text search engines have been the foundation of information retrieval in modern IT systems. For example, you would add tags or category keywords such as “movie”, “music”, or “actor” to each piece of content (image or text) or each entity (a product, user, IoT device, or anything really). You’d then add those records to a database, so you could perform searches with those tags or keywords.
In contrast, vector search uses vectors (where each vector is a list of numbers) for representing and searching content. The combination of the numbers defines similarity to specific topics. For example, if an image (or any content) includes 10% of “movie”, 2% of “music”, and 30% of “actor”-related content, then you could define a vector [0.1, 0.02, 0.3] to represent it. (Note: this is an overly simplified explanation of the concept; the actual vectors have much more complex vector spaces). You can find similar content by comparing the distances and similarities between vectors. This is how Google services find valuable content for a wide variety of users worldwide in milliseconds.
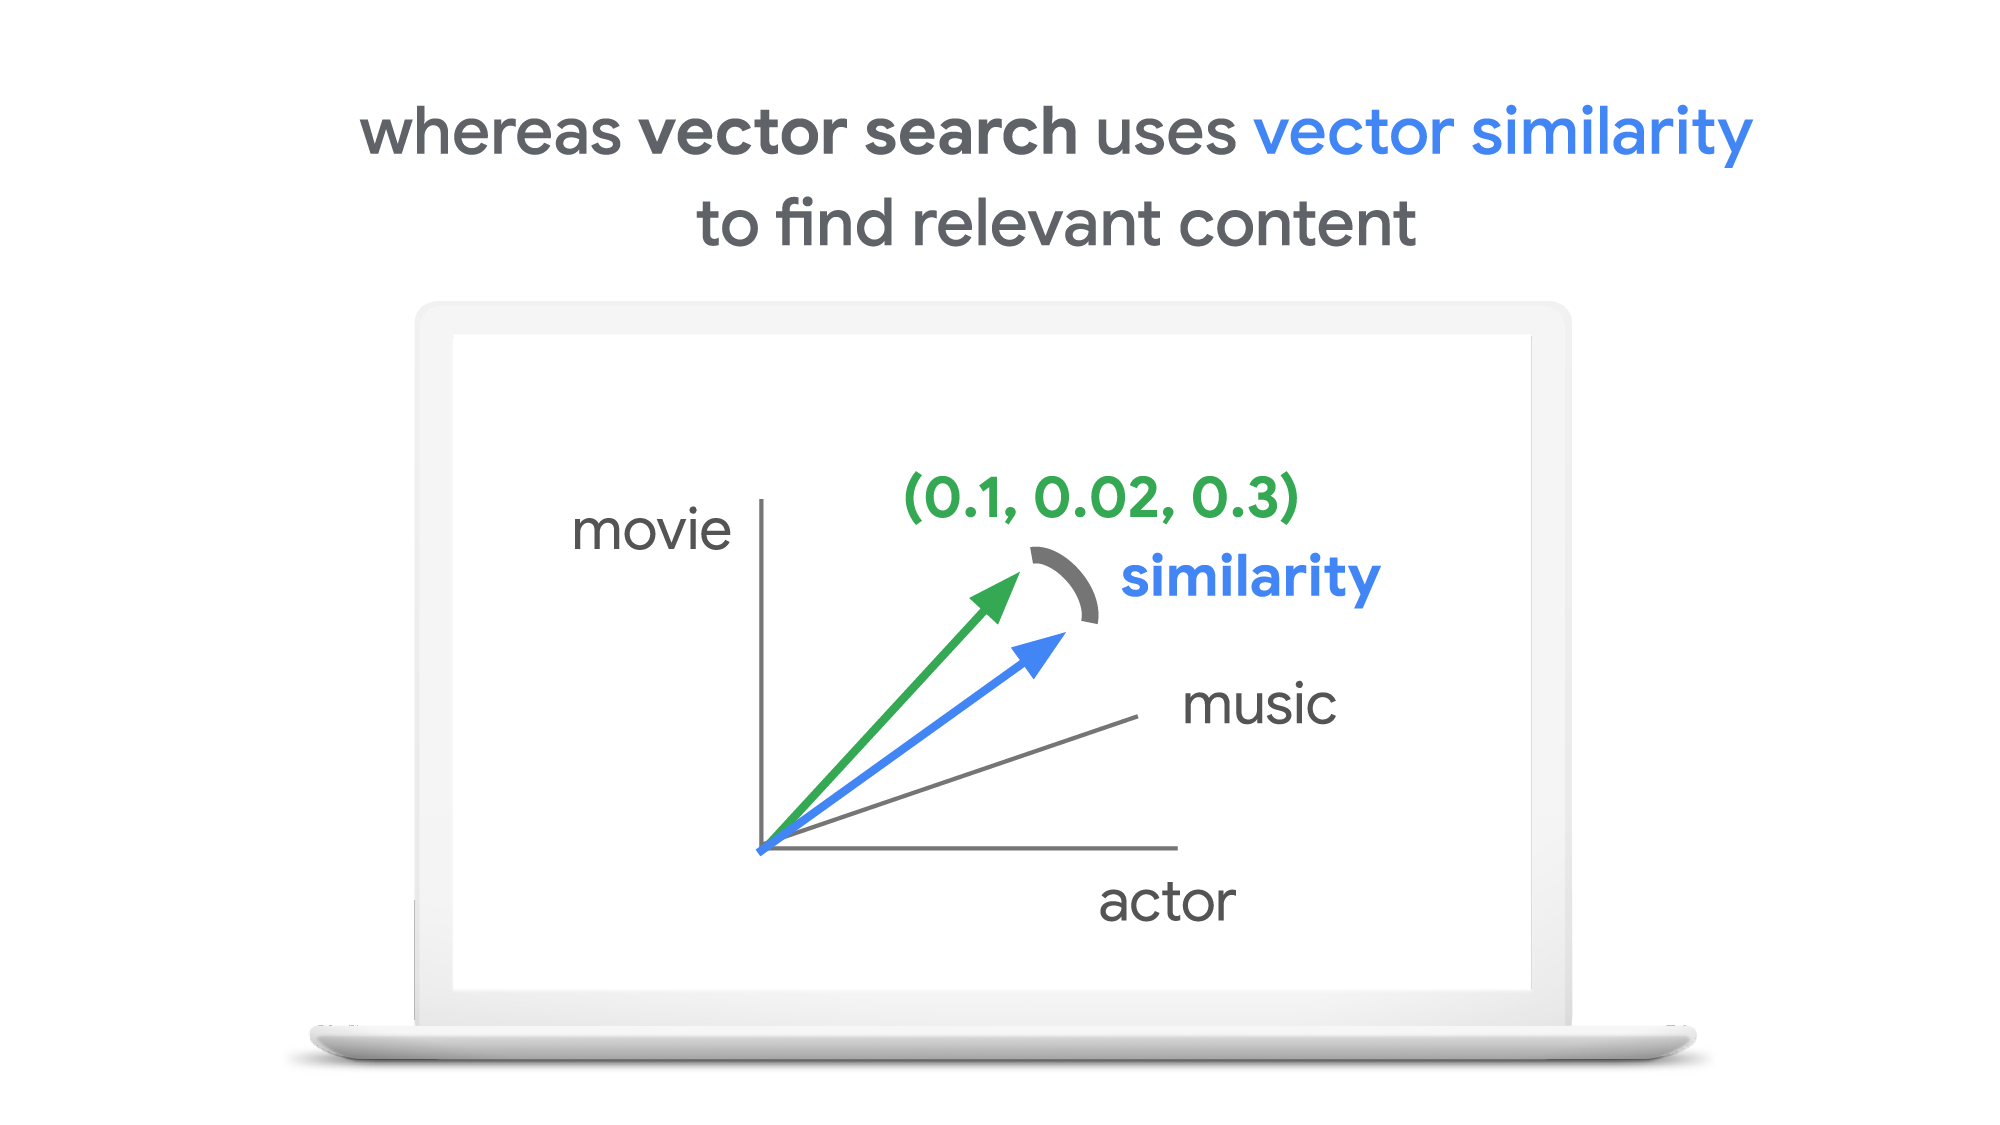
With keyword search, you can only specify a binary choice as an attribute of each piece of content; it’s either about a movie or not, either music or not, and so on. Also, you cannot express the actual “meaning” of the content to search. If you specify a keyword “films”, for example, you would not see any content related to “movies” unless there was a synonyms dictionary that explicitly linked these two terms in the database or search engine.
Vector search provides a much more refined way to find content, with subtle nuances and meanings. Vectors can represent a subset of content that contains “much about actors, some about movies, and a little about music”. Vectors can represent the meaning of content where “films”, “movies”, and “cinema” are all collected together. Also, vectors have the flexibility to represent categories previously unknown to or undefined by service providers. For example, emerging categories of content primarily attractive to kids, such as ASMR or slime, are really hard for adults or marketing professionals to predict beforehand, and going back through vast databases to manually update content with these new labels would be all but impossible to do quickly. But vectors can capture and represent never-before-seen categories instantly.
Vector search changes business
Vector search is not only applicable to image and text content. It can also be used for information retrieval for anything you have in your business when you can define a vector to represent each thing. Here are a few examples:
- Finding similar users: If you define a vector to represent each user in your business by combining the user’s activities, past purchase history, and other user attributes, then you can find all users similar to a specified user. You can then see, for example, users who are purchasing similar products, users that are likely bots, or users who are potential premium customers and who should be targeted with digital marketing.
- Finding similar products or items: With a vector generated from product features such as description, price, sales location, and so on, you can find similar products to answer any number of questions; for example, “What other products do we have that are similar to this one and may work for the same use case?” or “What products sold in the last 24 hours in this area?” (based on time and proximity)
- Finding defective IoT devices: With a vector that captures the features of defective devices from their signals, vector search enables you to instantly find potentially defective devices for proactive maintenance.
- Finding ads: Well-defined vectors let you find the most relevant or appropriate ads for viewers in milliseconds at high throughput.
- Finding security threats: You can identify security threats by vectorizing the signatures of computer virus binaries or malicious attack behaviors against web services or network equipment.
- …and many more: Thousands of different applications of vector search in all industries will likely emerge in the next few years, making the technology as important as relational databases.
OK, vector search sounds cool. But what are the major challenges to applying the technology to real business use cases? Actually there are two:
- Creating vectors that are meaningful for business use cases
- Building a fast and scalable vector search service
Embeddings: meaningful vectors for business use cases
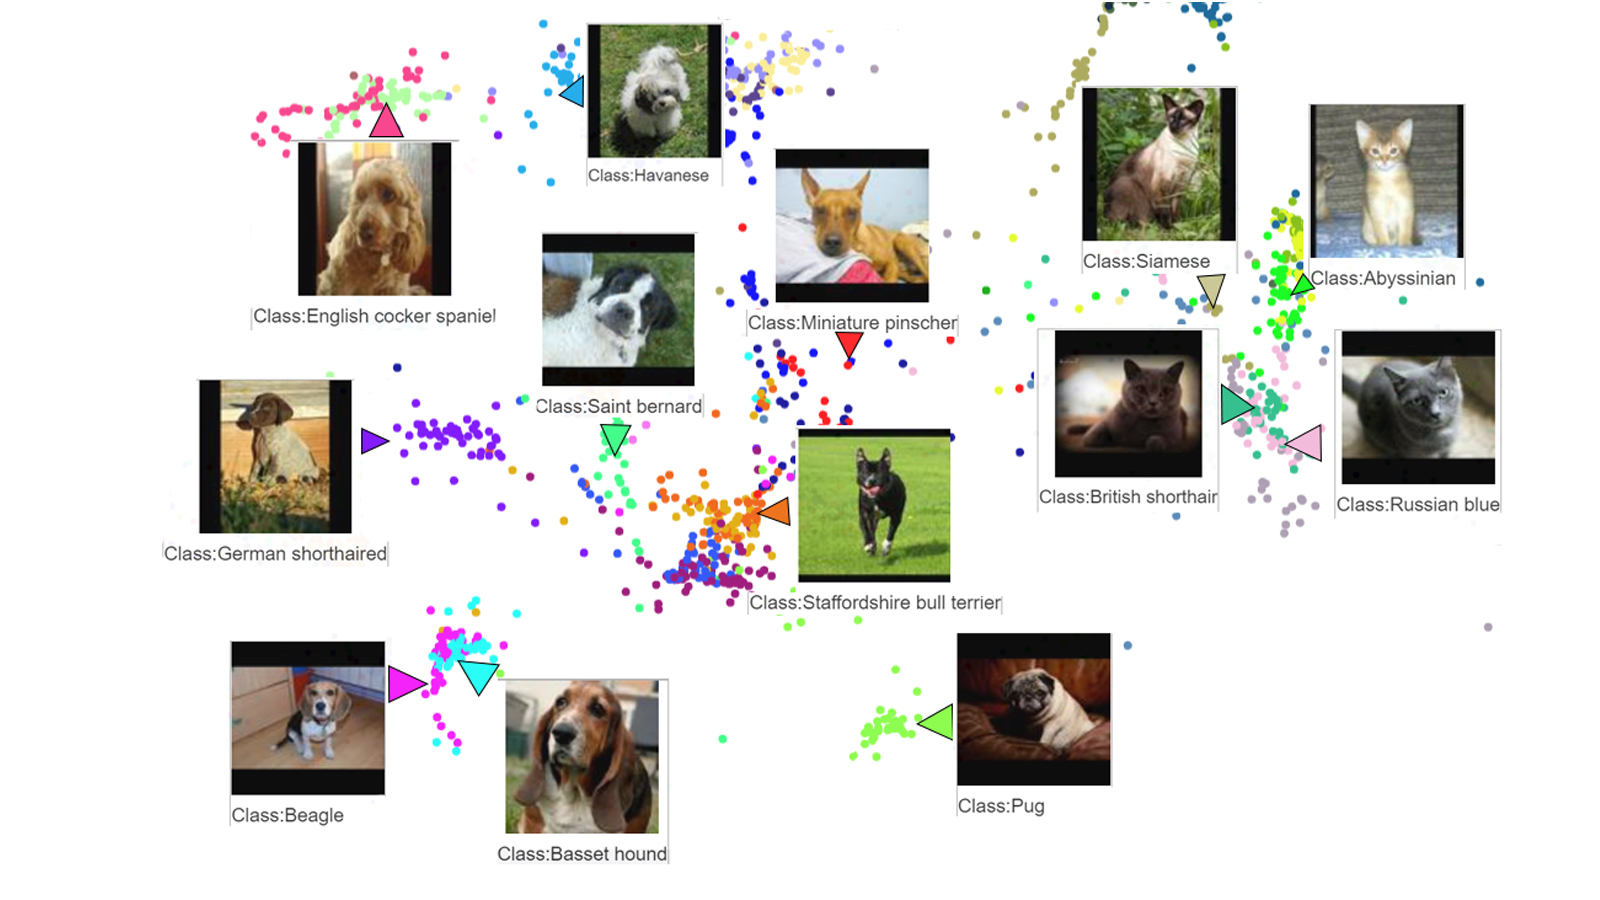
The first challenge is creating vectors for representing various entities that are meaningful and useful for business use cases. This is where deep learning technology can really shine. In the case of the MatchIt Fast demo, the application simply uses a pre-trained MobileNet v2 model for extracting vectors from images, and the Universal Sentence Encoder (USE) for text. By applying such models to raw data, you can extract “embeddings” – vectors that map each row of data in a space of their “meanings”. MobileNet puts images that have similar patterns and textures closer to one another in the embedding space, and USE puts texts that have similar topics closer.
For example, a carefully designed and trained machine learning model could map movies into an embedding space like the following:
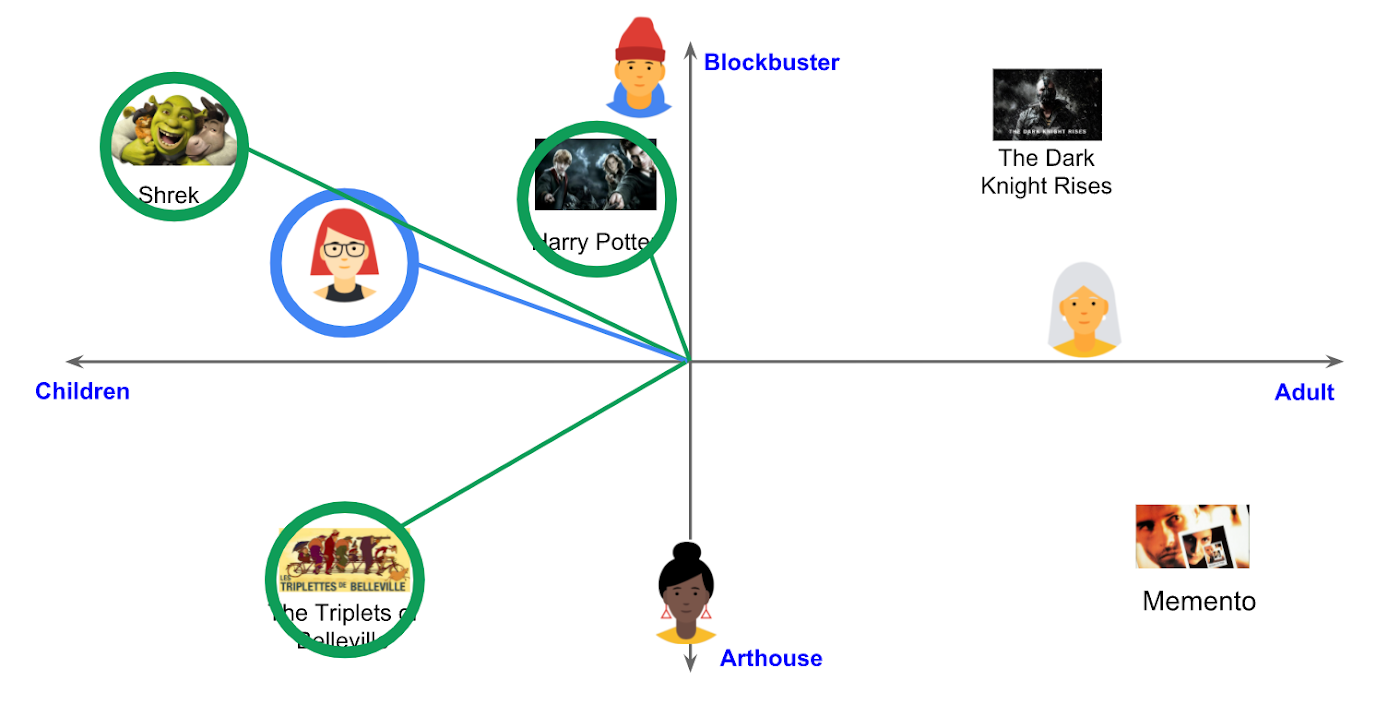
With the embedding space shown here, users could find recommended movies based on the two dimensions: is the movie for children or adults, and is it a blockbuster or arthouse movie? This is a very simple example, of course, but with an embedding space like this that fits your business requirements, you can deliver a better user experience on recommendation and information retrieval services with insights extracted from the model.
For more about creating embeddings, the Machine Learning Crash Course on Recommendation Systems is a great way to get started. We will also discuss how to extract better embeddings from business data later in this post.
Building a fast and scalable vector search service
Suppose that you have successfully extracted useful vectors (embeddings) from your business data. Now the only thing you have to do is search for similar vectors. That sounds simple, but in practice it is not. Let’s see how the vector search works when you implement it with BigQuery in a naive way:https://www.youtube.com/embed/wHNJspvxj2w?enablejsapi=1&
It takes about 20 seconds to find similar items (fish images in this case) from a pool of one million items. That level of performance is not so impressive, especially when compared to the MatchIt Fast demo. BigQuery is one of the fastest data warehouse services in the industry, so why does the vector search take so long?
This illustrates the second challenge: building a fast and scalable vector search engine isn’t an easy task. The most widely used metrics for calculating the similarity between vectors are L2 distance (Euclidean distance), cosine similarity, and inner product (dot product).
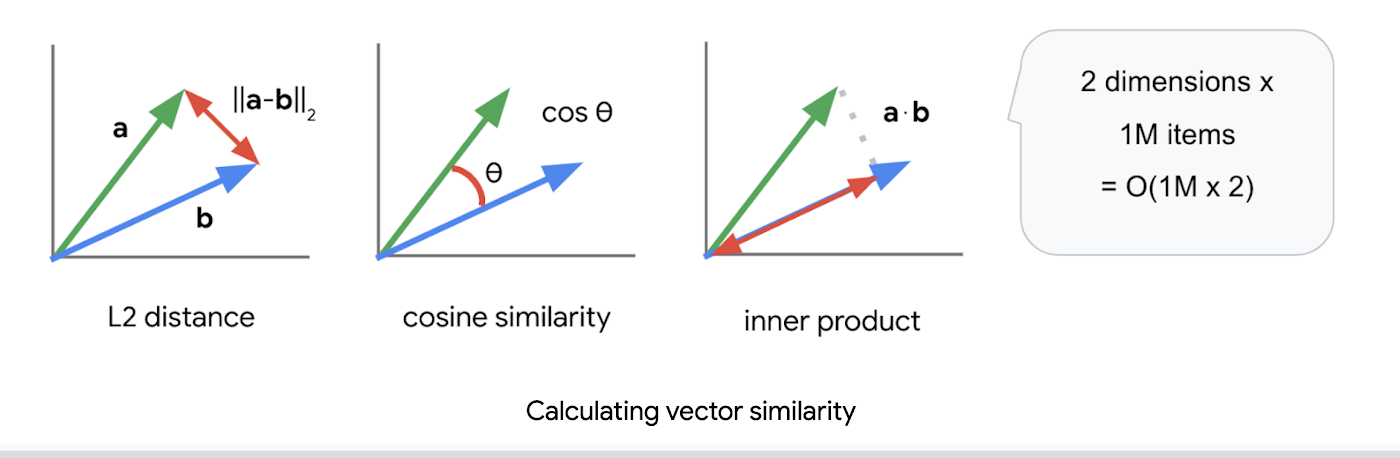
But all require calculations proportional to the number of vectors multiplied by the number of dimensions if you implement them in a naive way. For example, if you compare a vector with 1024 elements to 1M vectors, the number of calculations will be proportional to 1024 x 1M = 1.02B. This is the computation required to look through all the entities for a single search, and the reason why the BigQuery demo above takes so long.
Instead of comparing vectors one by one, you could use the approximate nearest neighbor (ANN) approach to improve search times. Many ANN algorithms use vector quantization (VQ), in which you split the vector space into multiple groups, define “codewords” to represent each group, and search only for those codewords. This VQ technique dramatically enhances query speeds and is the essential part of many ANN algorithms, just like indexing is the essential part of relational databases and full-text search engines.
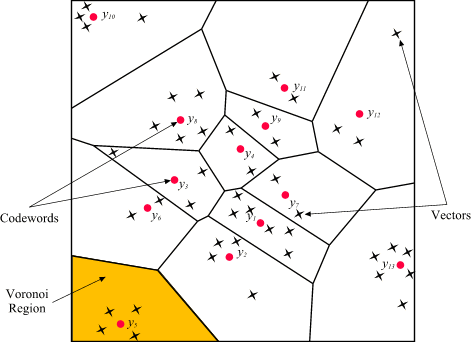
As you may be able to conclude from the diagram above, as the number of groups in the space increases the speed of the search decreases and the accuracy increases. Managing this trade-off — getting higher accuracy at shorter latency — has been a key challenge with ANN algorithms.
Last year, Google Research announced ScaNN, a new solution that provides state-of-the-art results for this challenge. With ScaNN, they introduced a new VQ algorithm called anisotropic vector quantization:
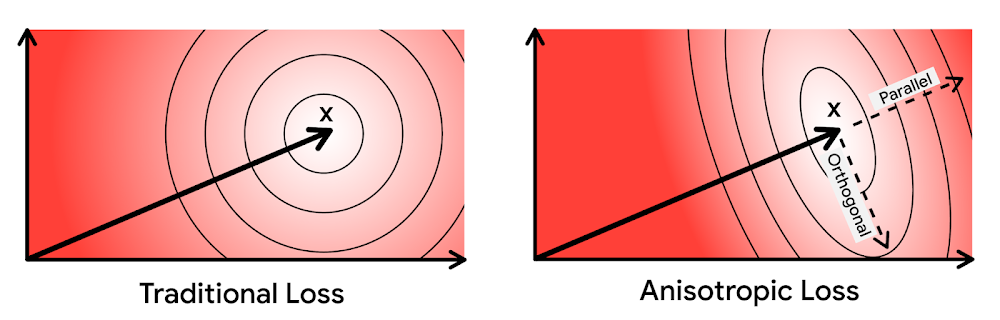
Anisotropic vector quantization uses a new loss function to train a model for VQ for an optimal grouping to capture farther data points (i.e. higher inner product) in a single group. With this idea, the new algorithm gives you higher accuracy at lower latency, as you can see in the benchmark result below (the violet line):
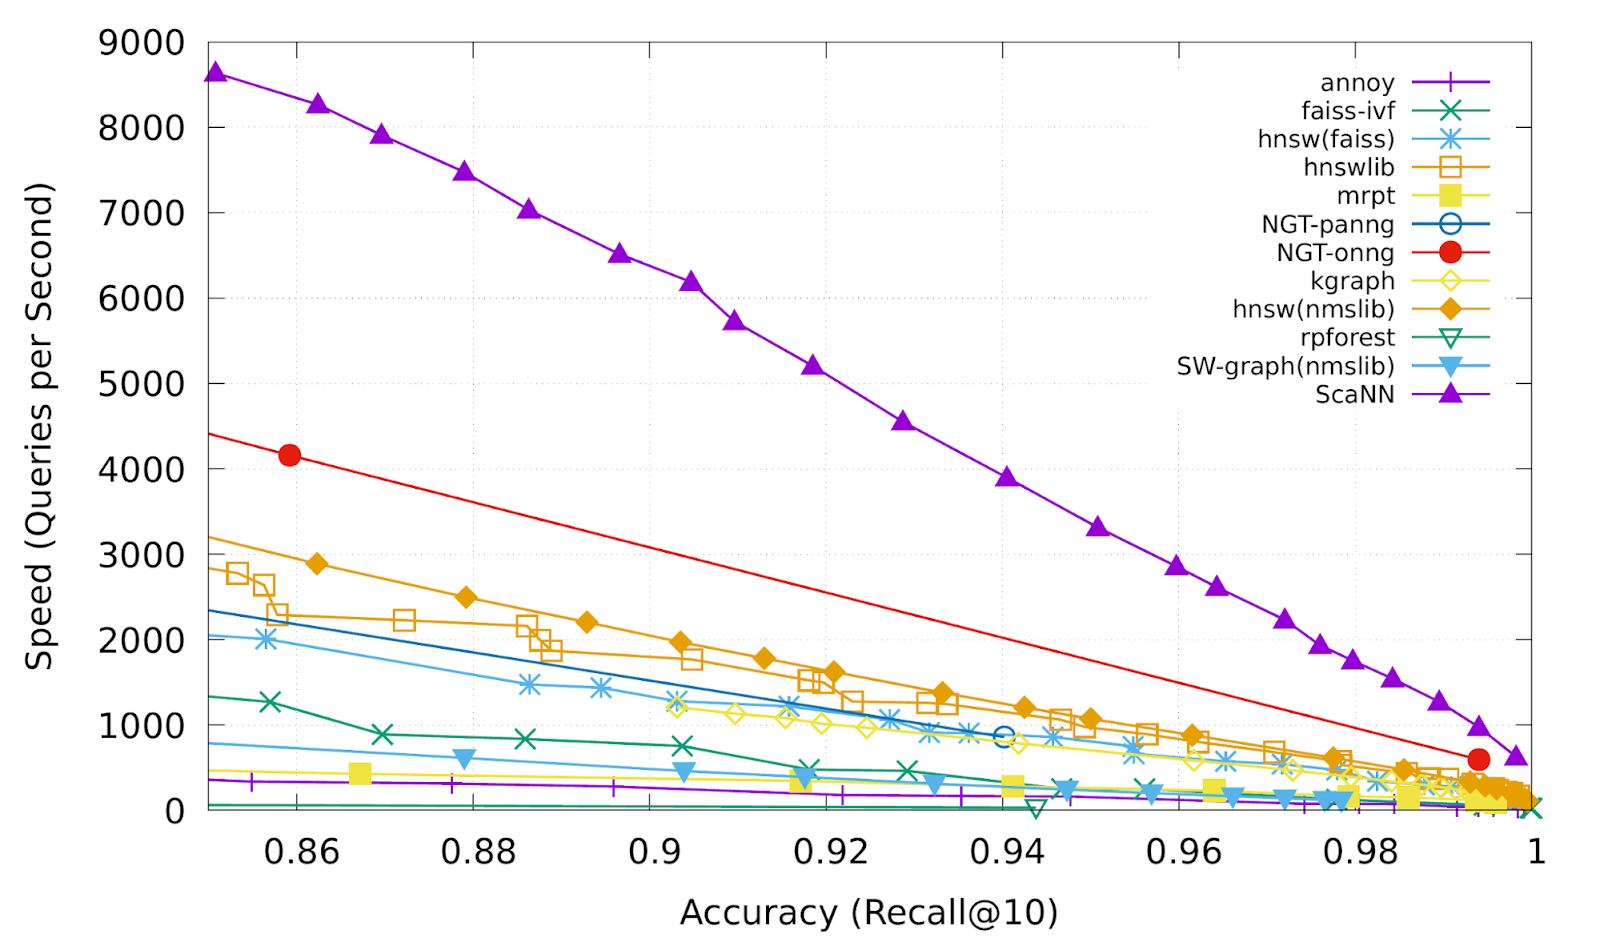
This is the magic ingredient in the user experience you feel when you are using Google Image Search, YouTube, Google Play, and many other services that rely on recommendations and search. In short, Google’s ANN technology enables users to find valuable information in milliseconds, in the vast sea of web content.
How to use Vertex AI Matching Engine
Now you can use the same search technology that powers Google services with your own business data. Vertex AI Matching Engine is the product that shares the same ScaNN based backend with Google services for fast and scalable vector search, and recently it became GA and ready for production use. In addition to ScaNN, Matching Engine gives you additional features as a commercial product, including:
- Scalability and availability: The open source version of ScaNN is a good choice for evaluation purposes, but as with most new and advanced technologies, you can expect challenges when putting it into production on your own. For example, how do you operate it on multiple nodes with high scalability, availability, and maintainability? Matching Engine uses Google’s production backend for ScaNN, which provides auto-scaling and auto-failover with a large worker pool. It is capable of handling tens of thousands of requests per second, and returns search results in less than 10 ms for the 90th percentile with a recall rate of 95 – 98%.
- Fully managed: You don’t have to worry about building and maintaining the search service. Just create or update an index with your vectors, and you will have a production-ready ANN service deployed. No need to think about rebuilding and optimizing indexes, or other maintenance tasks.
- Filtering: Matching Engine provides filtering functionality that enables you to filter search results based on tags you specify on each vector. For example, you can assign “country” and “stocked” tags to each fashion item vector, and specify filters like “(US OR Canada) AND stocked” or “not Japan AND stocked” on your searches.
Let’s see how to use Matching Engine with code examples from the MatchIt Fast demo.
Generating embeddings
Before starting the search, you need to generate embeddings for each item like this one:
{"Id":"b5c65fea9b0b8a57bfa574ea","Embedding": [0.16329009830951691,0.92436742782592773,0.00095699273515492678,0.011479727923870087,0.0089491046965122223,0.019959751516580582,0.031516745686531067,0.0066015380434691906,0.46404418349266052,...
This is an embedding with 1280 dimensions for a single image, generated with a MobileNet v2 model. The MatchIt Fast demo generates embeddings for two million images with the following code:
class Vectorizer:def __init__(self):self._model = tf.keras.Sequential([hub.KerasLayer("https://tfhub.dev/google/imagenet/mobilenet_v2_100_224/feature_vector/5", trainable=False)])self._model.build([None, 224, 224, 3]) # Batch input shape.def vectorize(self, jpeg_file):...snip...embedding = self._model.predict({"inputs": input_tensor})[0].tolist()return embedding
After you generate the embeddings, you store them in a Google Cloud Storage bucket.
Configuring an index
Then, define a JSON file for the index configuration:
{"contentsDeltaUri": "gs://match-it-fast-us-central1/wikimedia_images/index-1","config": {"dimensions": 1280,"approximateNeighborsCount": 150,"distanceMeasureType": "SQUARED_L2_DISTANCE","algorithm_config": {"treeAhConfig": {"leafNodeEmbeddingCount": 1000,"leafNodesToSearchPercent": 5}}}}
You can find a detailed description for each field in the documentation, but here are some important fields:
contentsDeltaUri: the place where you have stored the embeddingsdimensions: how many dimensions in the embeddingsapproximateNeighborsCount: the default number of neighbors to find via approximate searchdistanceMeasureType: how the similarity between embeddings should be measured, either L1, L2, cosine or dot product (this page explains which one to choose for different embeddings)
To create an index on the Matching Engine, run the following gcloud command where the metadata-file option takes the JSON file name defined above.
gcloud --project=gn-match-it-fast beta ai indexes create \--display-name=wikimedia-images \--description="Wikimedia Image Demo" \--metadata-file=metadata/wikimedia_images_index_metadata.json \--region=us-central1
Run the search
Now the Matching Engine is ready to run. The demo processes each search request in the following order:
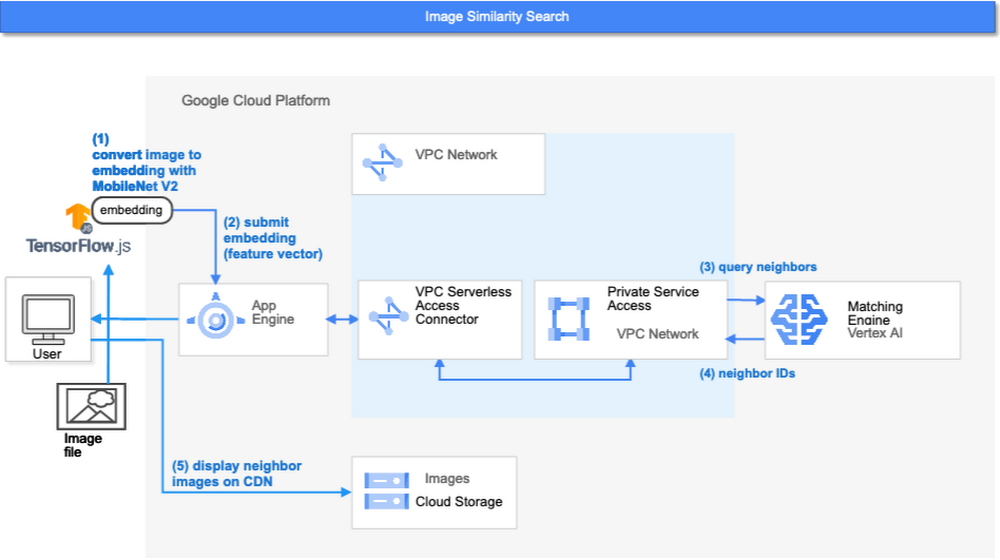
- First, the web UI takes an image (the one chosen or uploaded by the user) and encodes it into an embedding using the TensorFlow.js MobileNet v2 model running inside the browser. Note: this “client-side encoding” is an interesting option for reducing network traffic when you can run the encoding at the client. In many other cases, you would encode contents to embeddings with a server-side prediction service such as Vertex AI Prediction, or just retrieve pre-generated embeddings from a repository like Vertex AI Feature Store.
- The App Engine frontend receives the embedding and submits a query to the Matching Engine. Note that you can also use any other compute services in Google Cloud for submitting queries to Matching Engine, such as Cloud Run, Compute Engine, or Kubernetes Engine, or whatever is most suitable for your applications.
- Matching Engine executes its search. The connection between App Engine and Matching Engine is provided via a VPC private network for optimal latency.
- Matching Engine returns the IDs of similar vectors in its index.
Step 3 is implemented with the following code:
class MatchingQueryClient:...snip...def query_embedding(self, embedding, num_neighbors=30):request = match_service_pb2.MatchRequest()request.deployed_index_id = self._deployed_index_idfor v in embedding:request.float_val.append(v)request.num_neighbors = num_neighborsresponse = self._stub.Match(request)return response
The request to the Matching Engine is sent via gRPC as you can see in the code above. After it gets the request object, it specifies the index id, appends elements of the embedding, specifies the number of neighbors (similar embeddings) to retrieve, and calls the Match function to send the request. The response is received within milliseconds.
Next steps: Making changes for various use cases and better search quality
As we noted earlier, the major challenges in applying vector search on production use cases are:
- Creating vectors that are meaningful for business use cases
- Building a fast and scalable vector search service
From the example above, you can see that Vertex AI Matching Engine solves the second challenge. What about the first one? Matching Engine is a vector search service; it doesn’t include the creating vectors part.
The MatchIt Fast demo uses a simple way of extracting embeddings from images and contents; specifically it uses an existing pre-trained model (either MobileNet v2 or Universal Sentence Encoder). While those are easy to get started with, you may want to explore other options to generate embeddings for other use cases and better search quality, based on your business and user experience requirements.
For example, how do you generate embeddings for product recommendations? The Recommendation Systems section of the Machine Learning Crash Course is a great resource for learning how to use collaborative filtering and DNN models (the two-tower model) to generate embeddings for recommendation. Also, TensorFlow Recommenders provides useful guides and tutorials for the topic, especially on the two-tower model and advanced topics. For integration with Matching Engine, you may also want to check out the Train embeddings by using the two-tower built-in algorithm page.
Another interesting solution is the Swivel model. Swivel is a method for generating item embeddings from an item co-occurrence matrix. For structured data, such as purchase orders, the co-occurrence matrix of items can be computed by counting the number of purchase orders that contain both product A and product B, for all products you want to generate embeddings for. To learn more, take a look at this tutorial on how to use the model with Matching Engine.
If you are looking for more ways to achieve better search quality, consider metric learning, which enables you to train a model for discrimination between entities in the embedding space, not only classification:
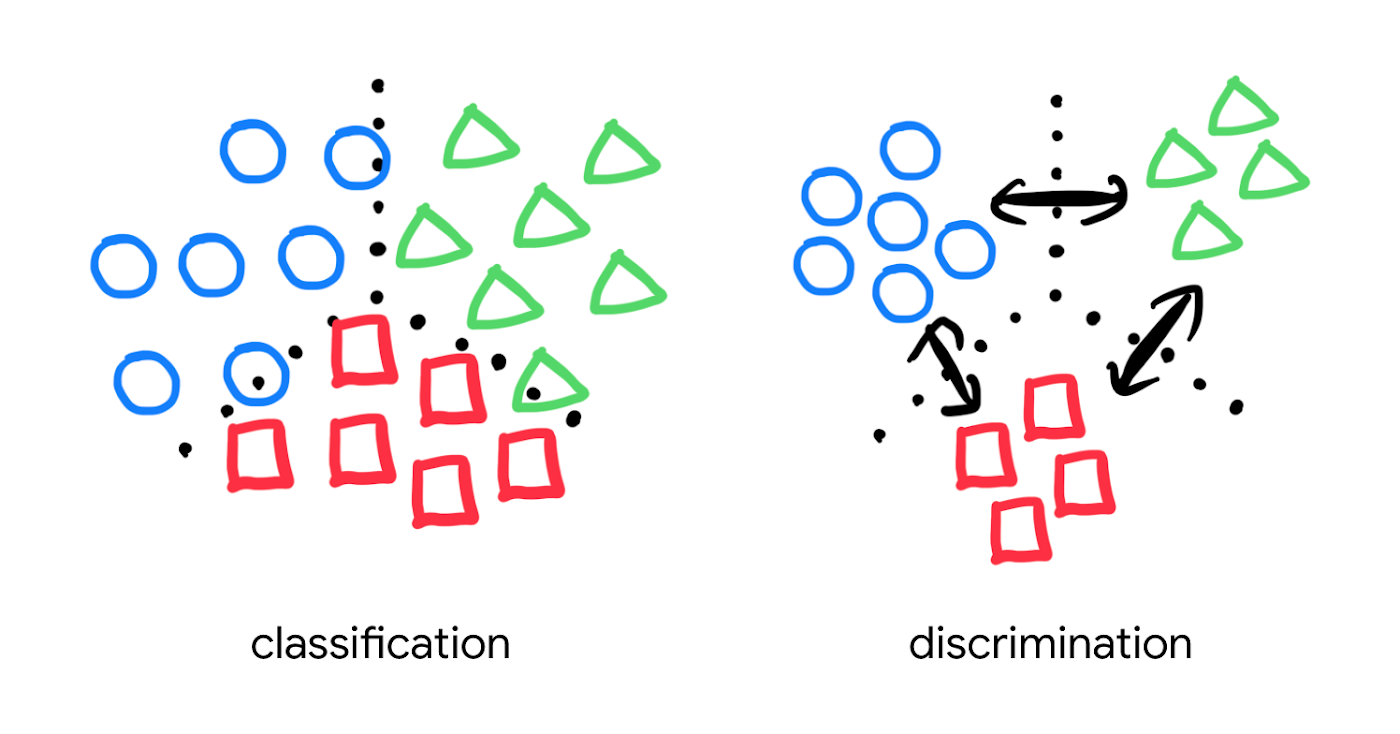
Popular pre-trained models such as the MobileNet v2 can classify each object in an image, but they are not explicitly trained to discriminate the objects from each other with a defined distance metric. With metric learning, you can expect better search quality by designing the embedding space optimized for various business use cases. TensorFlow Similarity could be an option for integrating metric learning with Matching Engine.
Interested? Today, we’re just beginning the migration from traditional search technology to new vector search. Over the next 5 to 10 years, many more best practices and tools will be developed in the industry and community. These tools and best practices will help answer many questions, like… How do you design your own embedding space for a specific business use case? How do you measure search quality? How do you debug and troubleshoot the vector search? How do you build a hybrid setup with existing search engines for meeting sophisticated requirements? There are many new challenges and opportunities ahead for introducing the technology to production. Now’s the time to get started delivering better user experiences and seizing new business opportunities with Matching Engine powered by vector search.
Acknowledgements
We would like to thank Anand Iyer, Phillip Sun, and Jeremy Wortz for their invaluable feedback to this post.
Combining IoT and Analytics to Warn Manufacturers of Line Break Downs and Increase Profitability

7598
Of your peers have already read this article.
2:45 Minutes
The most insightful time you'll spend today!
Oden Technologies is using the Internet of Things (IoT) to improve the factories of today. The giant network of “things” (including people) connected to each other via the Internet has the potential to reduce waste, increase efficiency, and improve safety across all walks of life. Oden is leading IoT innovation in manufacturing by combining wireless connectivity, big data, and cloud computing.
The use of data to improve manufacturing is practically as old as manufacturing itself. But the computerization of manufacturing has resulted in broad and rapid changes to the way data is collected and processed, as well as the sheer volume of data available.
Oden’s goal is to help manufacturers tap into this data to quickly identify process trends and even warning signs of machine breakdown. Such visibility can reveal opportunities to improve manufacturing and maintenance processes that reduce waste and increase profit margins.
Oden designs and develops data collection devices that can plug into almost any kind of machine and can wirelessly transmit data with minimal complexity and setup time.
Once devices are installed, the Oden technology platform processes data to give manufacturers cutting-edge analytics that are easy to comprehend. Analysis produced by the platform provides factory engineers with data points such as detailed root-cause analysis down to the second, factory-wide performance in real-time, and trend analysis.
Improving cloud delivery
Oden’s previous cloud platform performed satisfactorily, but the company evaluated alternatives in search of potential reductions in cost and complexity and increases in performance.
When evaluating Google Cloud Platform, Oden discovered it would require fewer virtual machine (VM) instances for equivalent performance, which would cut costs. Furthermore, Oden could gain more sophisticated data analytics and machine learning capabilities compared with its existing cloud provider.
Today, Oden runs its entire platform on Google Cloud Platform including Google Compute Engine, Google Cloud Pub/Sub, Google Cloud Bigtable, Google Stackdriver, and Google Kubernetes Engine.
“In order to serve our customers, we need a cloud platform that can scale reliably while keeping costs low, perform under heavy loads, and consistently deliver sophisticated features such as machine learning,” says Willem Sundblad, CEO and Founder at Oden Technologies. “Google Cloud Platform is way ahead in all of these areas compared to our previous cloud provider.”
Capturing tens of millions of metrics a day
Using Google Cloud Platform, Oden can help an average factory capture and store approximately 10 million metrics on a single manufacturing line every day.
Metrics can include extremely granular detail, such as the amount of electricity going to machines, the amount of raw material consumed, and the volume of material produced. Sensors can also capture and transmit environmental information such as temperature, humidity, and dew point so that manufacturers can identify weather-related and seasonal impacts on production.
The updated Oden Cloud Platform uses Kubernetes Engine—powered by the open source Kubernetes system—to run application program interfaces (APIs) that capture data from Oden’s wireless devices on the factory floor.
Google Cloud Pub/Sub then sends the data in real time to Google Cloud Bigtable, where data is processed using Oden’s proprietary analytics tools. Google Stackdriver supports Google Cloud Platform monitoring, logging, and diagnostics, which help Oden deliver its cloud platform with confidence.
Oden Technologies builds dashboards powered by Kubernetes Engine, which pull analyzed data from Google Cloud Bigtable. The dashboards provide customers with real-time visibility into their manufacturing lines. Oden Factory Cloud dashboards allow customers to delve deeper into their data to fine-tune production processes or discover the root causes of production issues.
With the previous cloud provider, Oden required 80 VM instances to run the dashboards. With Google Cloud Platform that number has been cut to 45, which dramatically reduces costs and complexity.
“We migrated from our previous cloud provider to Google Cloud Platform in just one month,” says Willem. “Further, our storage and data analytics costs have decreased by 30%. Cost savings like these allow us to protect customers from rising expenses, keeping us focused on bringing the best products possible to market.”
Faster data access; more efficient factories
With Google Cloud Platform, Oden can now deliver a complete factory analytics picture to manufacturers. In environments where thousands of variables affect the bottom line, businesses can now automatically and perpetually record machine and performance measurement. Oden Factory Cloud gives customers access to comprehensive data insights and can eliminate reliance on onsite infrastructure investments to run their own analytics.
Because manufacturers have access to live data and can analyze production data quickly, they can troubleshoot and resolve problems in minutes rather than months. Such information helps improve product quality, minimize unplanned downtime, cut costs, and improve profitability.
“With the help of Google Cloud Platform, we are helping our customers to be data-driven, which wasn’t possible before,” adds Willem. “They now understand that data is their most important asset. That allows them to be more innovative and continually improve their production processes.”
Datashare for Financial Services: Securing the Publishers and Consumers’ Access to Market Data

8581
Of your peers have already read this article.
4:30 Minutes
The most insightful time you'll spend today!
Access to the cloud has advanced the distribution and consumption of financial information on a global scale. In parallel, the global financial data landscape has been transformed by an influx of alternative data sources, including social media, meteorological data, satellite imagery, and other data. Exchanges and market data providers now find they need to include these new datasets to enrich their products and compete, which has meant they now must consider cloud-based models to keep up with the demands of their customers who expect easy, quick, flexible and cost-efficient ways to consume market data.
To address these needs, today we’re announcing the general availability of Datashare for financial services, a new Google Cloud solution that brings together the entire capital markets ecosystem—data publishers, and data consumers—to exchange market data securely and easily.
Datashare helps organize third-party financial information, making it accessible and useful to market data publishers and data consumers. We open-sourced the entire Datashare solution so market data publishers can now onboard their licensed datasets to Google Cloud securely, quickly and easily, while data consumers can consume that data as a service in tools of their preference, such as BigQuery.
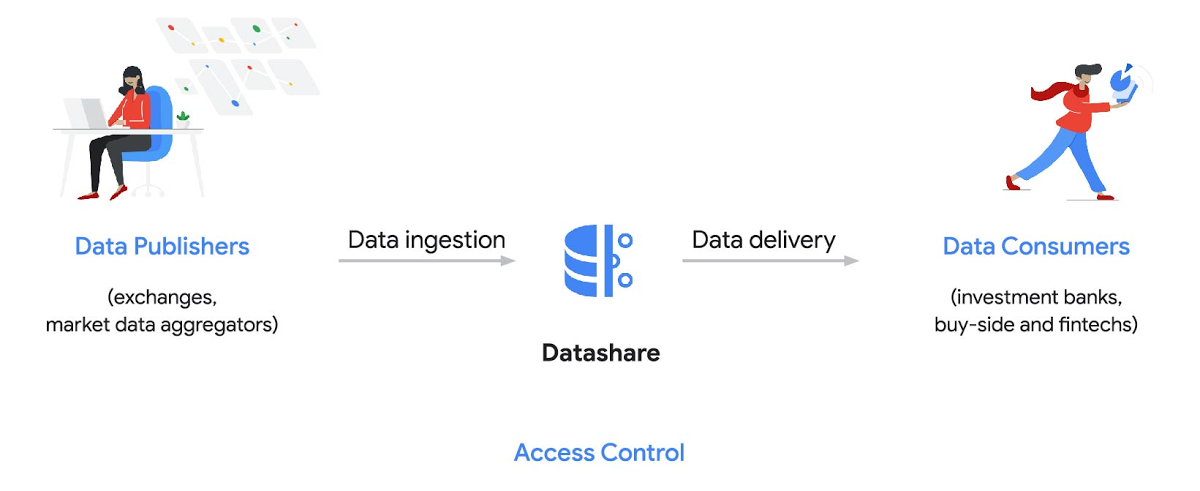
Three ways to distribute and consume your data
Batch data delivery
Datashare provides a batch data delivery mechanism for data publishers to deliver their reference data, historical tick data, alternative market data sources and more via BigQuery, reducing the administrative burden on data consumers to extract insights from data.
Real-time data streaming delivery
By using this event-based data delivery channel for rapidly changing instrument prices, tick data, orders, news and others via Pub/Sub, data consumers can reliably process individual messages or rewind to a point in time to replay a prior market scenario and test model changes.
Monetizing licensed datasets
Market data publishers can onboard their licensed datasets to Google Cloud and make them available via a one-stop-shop on Google Cloud Marketplace, enabling a new sales channel to expand market reach.
Reference architecture
Check out the diagram below to see how you can share your batch and real-time data directly to your Google Cloud customers with BigQuery and Pub/Sub.

As you can see in the above reference architecture, both publishers and consumers can derive several benefits from the solution:
Benefits for data publishers
- You no longer have to maintain your own delivery and licensing infrastructure.
- You can easily package and deliver granular data products and experiments with SQL.
- You can have a solution that scales with your business as data volumes and number of customers grow.
Benefits for data consumers
- Your data is ready for analysis and machine learning (ML)— you no longer have to maintain extract, transform, and load (ETL) pipelines to load files and transform data.
- You can avoid the expense and burden of maintaining multiple copies of large data files.
- You can be more targeted with consumption of data using BigQuery queries, improving performance, and compliance, and reducing cost.
Accessing the datasets
Google Cloud has been working with multiple industry firms on innovating in the market data space. By using Datashare for publishing, data publishers can make their entire datasets available on Google Cloud. Early adopters of Datashare include firms such as OneTick and Accern. OneTick’s datasets include reference and historical futures data (that can be accessed in our console with your login). Accern’s datasets include alternative data such as market sentiment and credit analysis data (that can be accessed in our console with your login).
To make it more helpful, we partnered with Accern to create a hypothetical scenario to describe the data acquisition and analytics process step-by-step.
Accern use case
As a sustainability analyst, you require an economic, social and governance (ESG) dataset to determine which sector is the most widely covered ESG sector by analysts, and to also identify the sector with the lowest ESG sentiment score. Now, you can discover and acquire an ESG dataset in Google Cloud.
Step 1. Navigate to the Financial Services solutions page in the Google Cloud console:

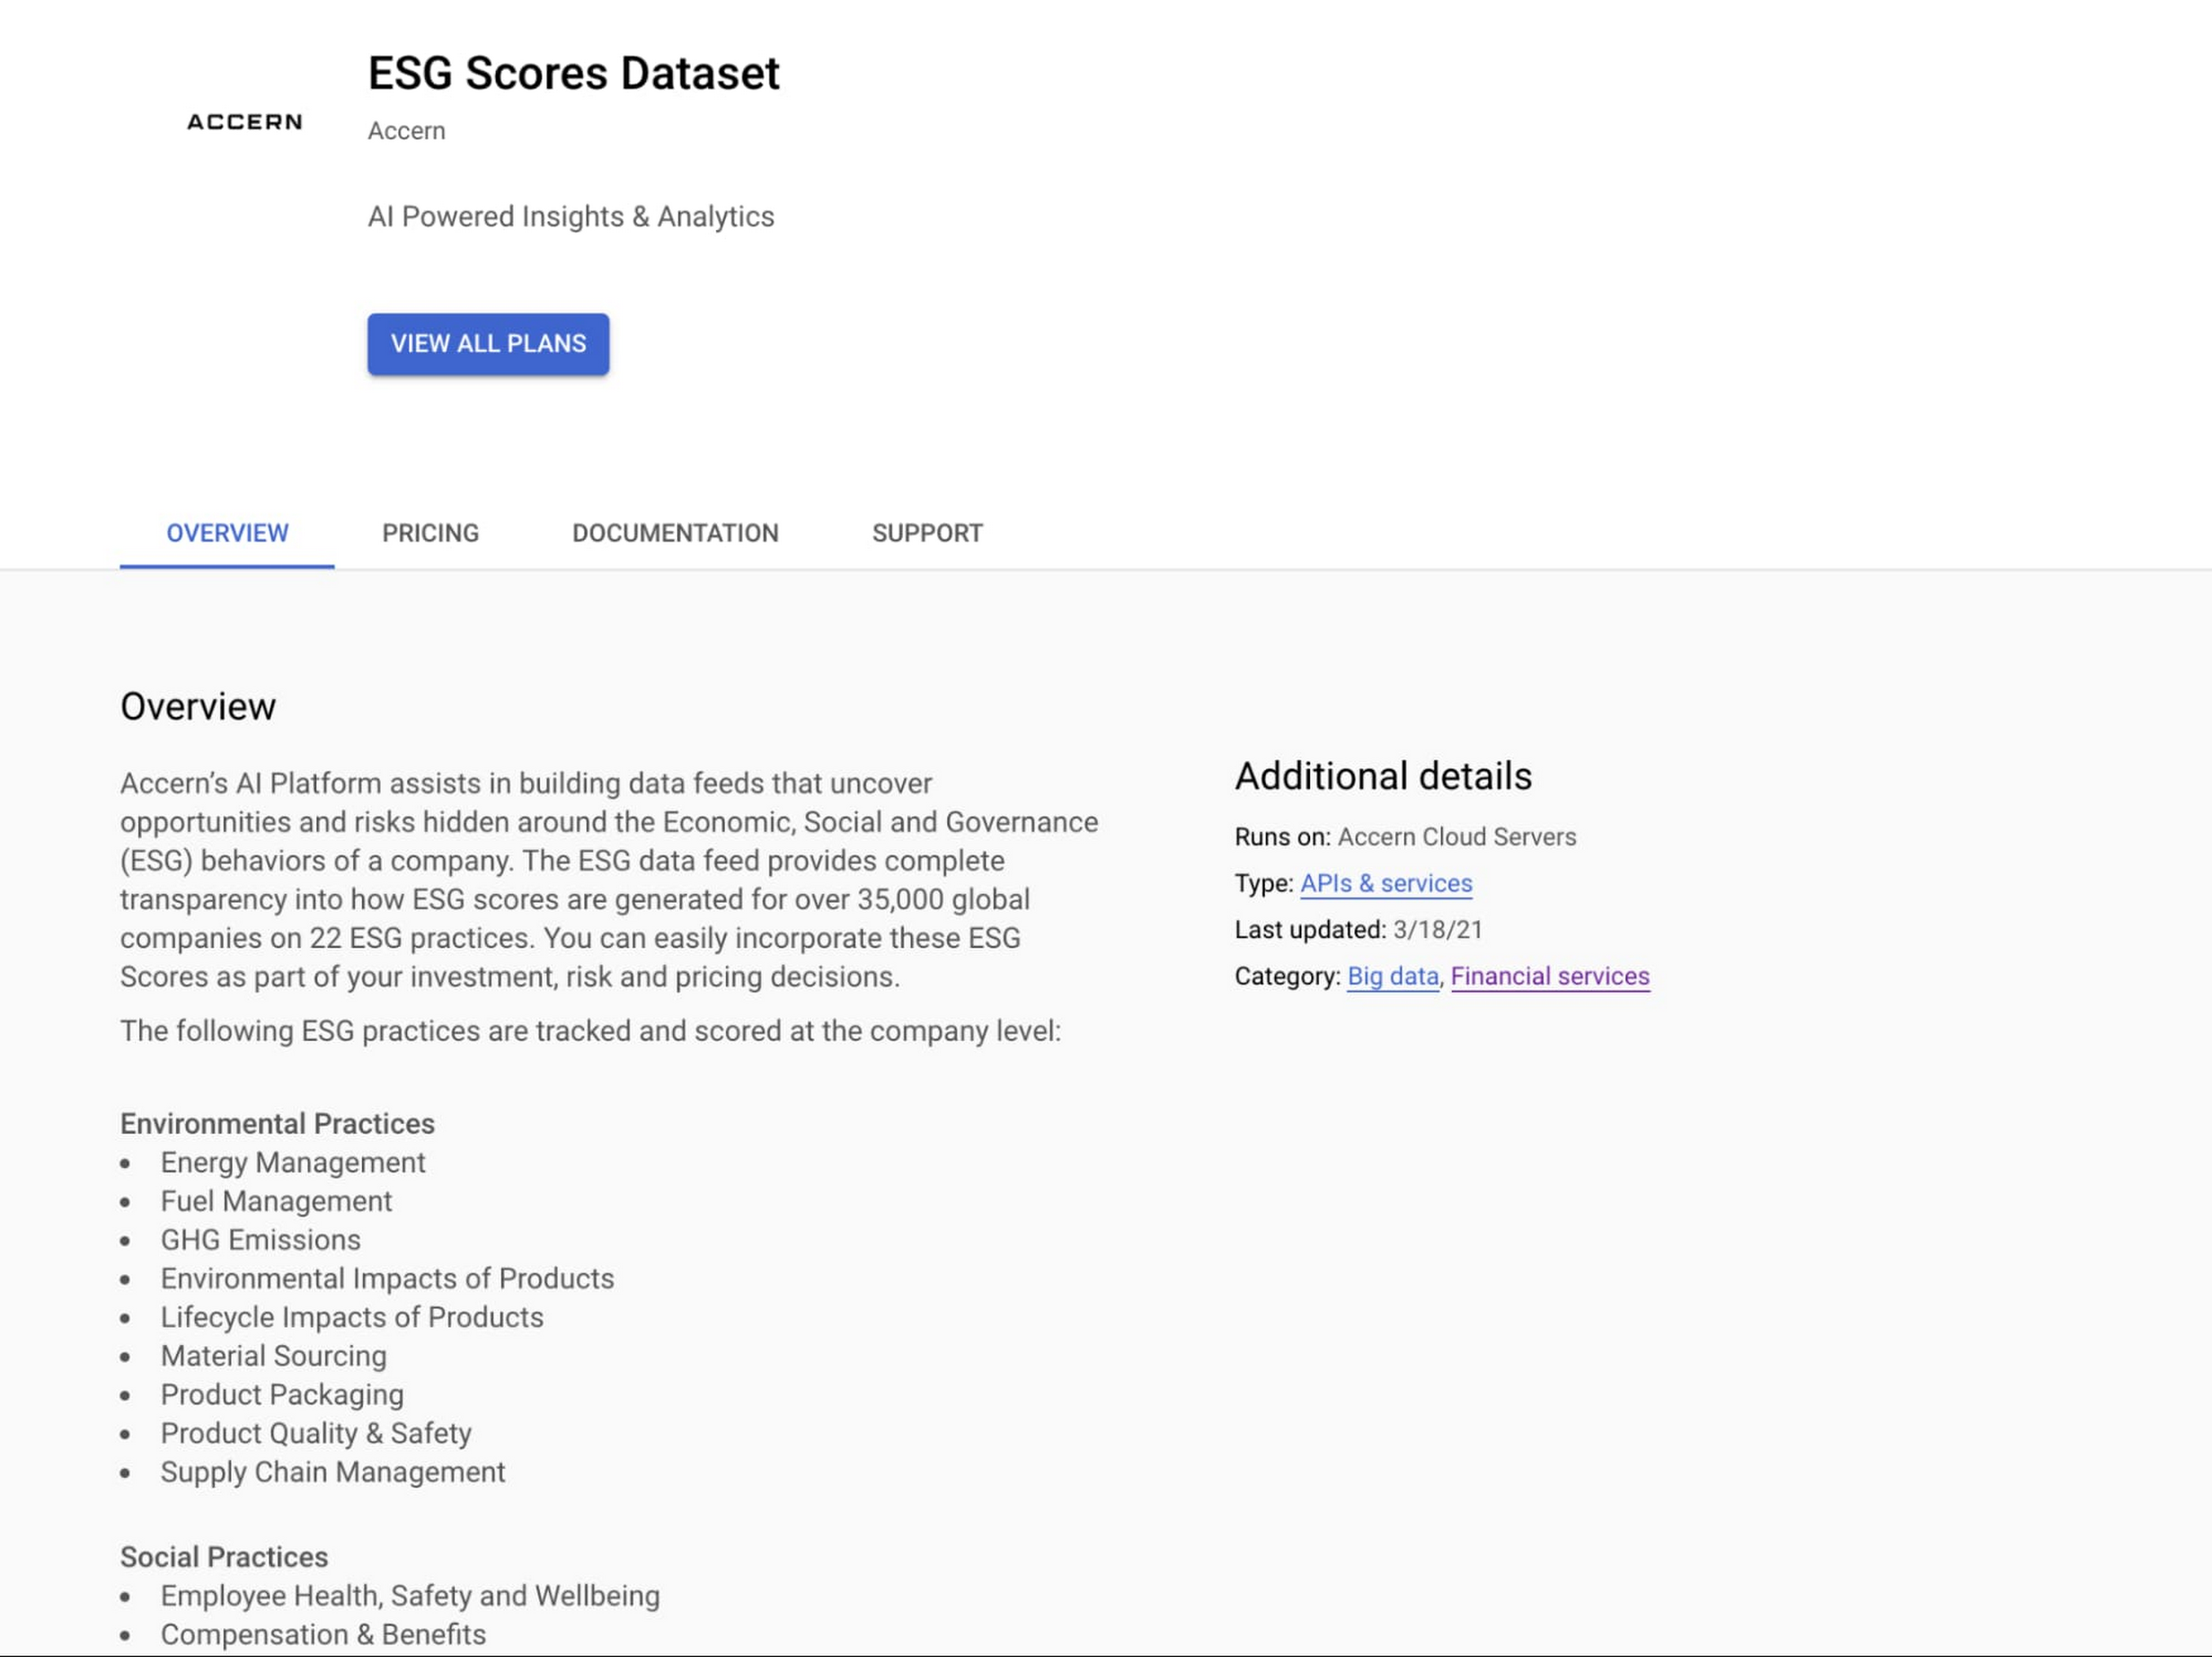
Step 2. Click a dataset, for example Accern AI-Generated ESG Insights, then review the overview details, plans and pricing, documentation and support information. To view the available pricing tiers, click ‘View All Plans’. Once you’ve decided on a tier that you would like to subscribe to, click ‘Select’, choose a billing account and review and accept the terms of service to complete the subscription. Once the steps are complete, click ‘Subscribe’ at the bottom. An overlay window will appear, click ‘Register with Accern’ to activate and complete the subscription.

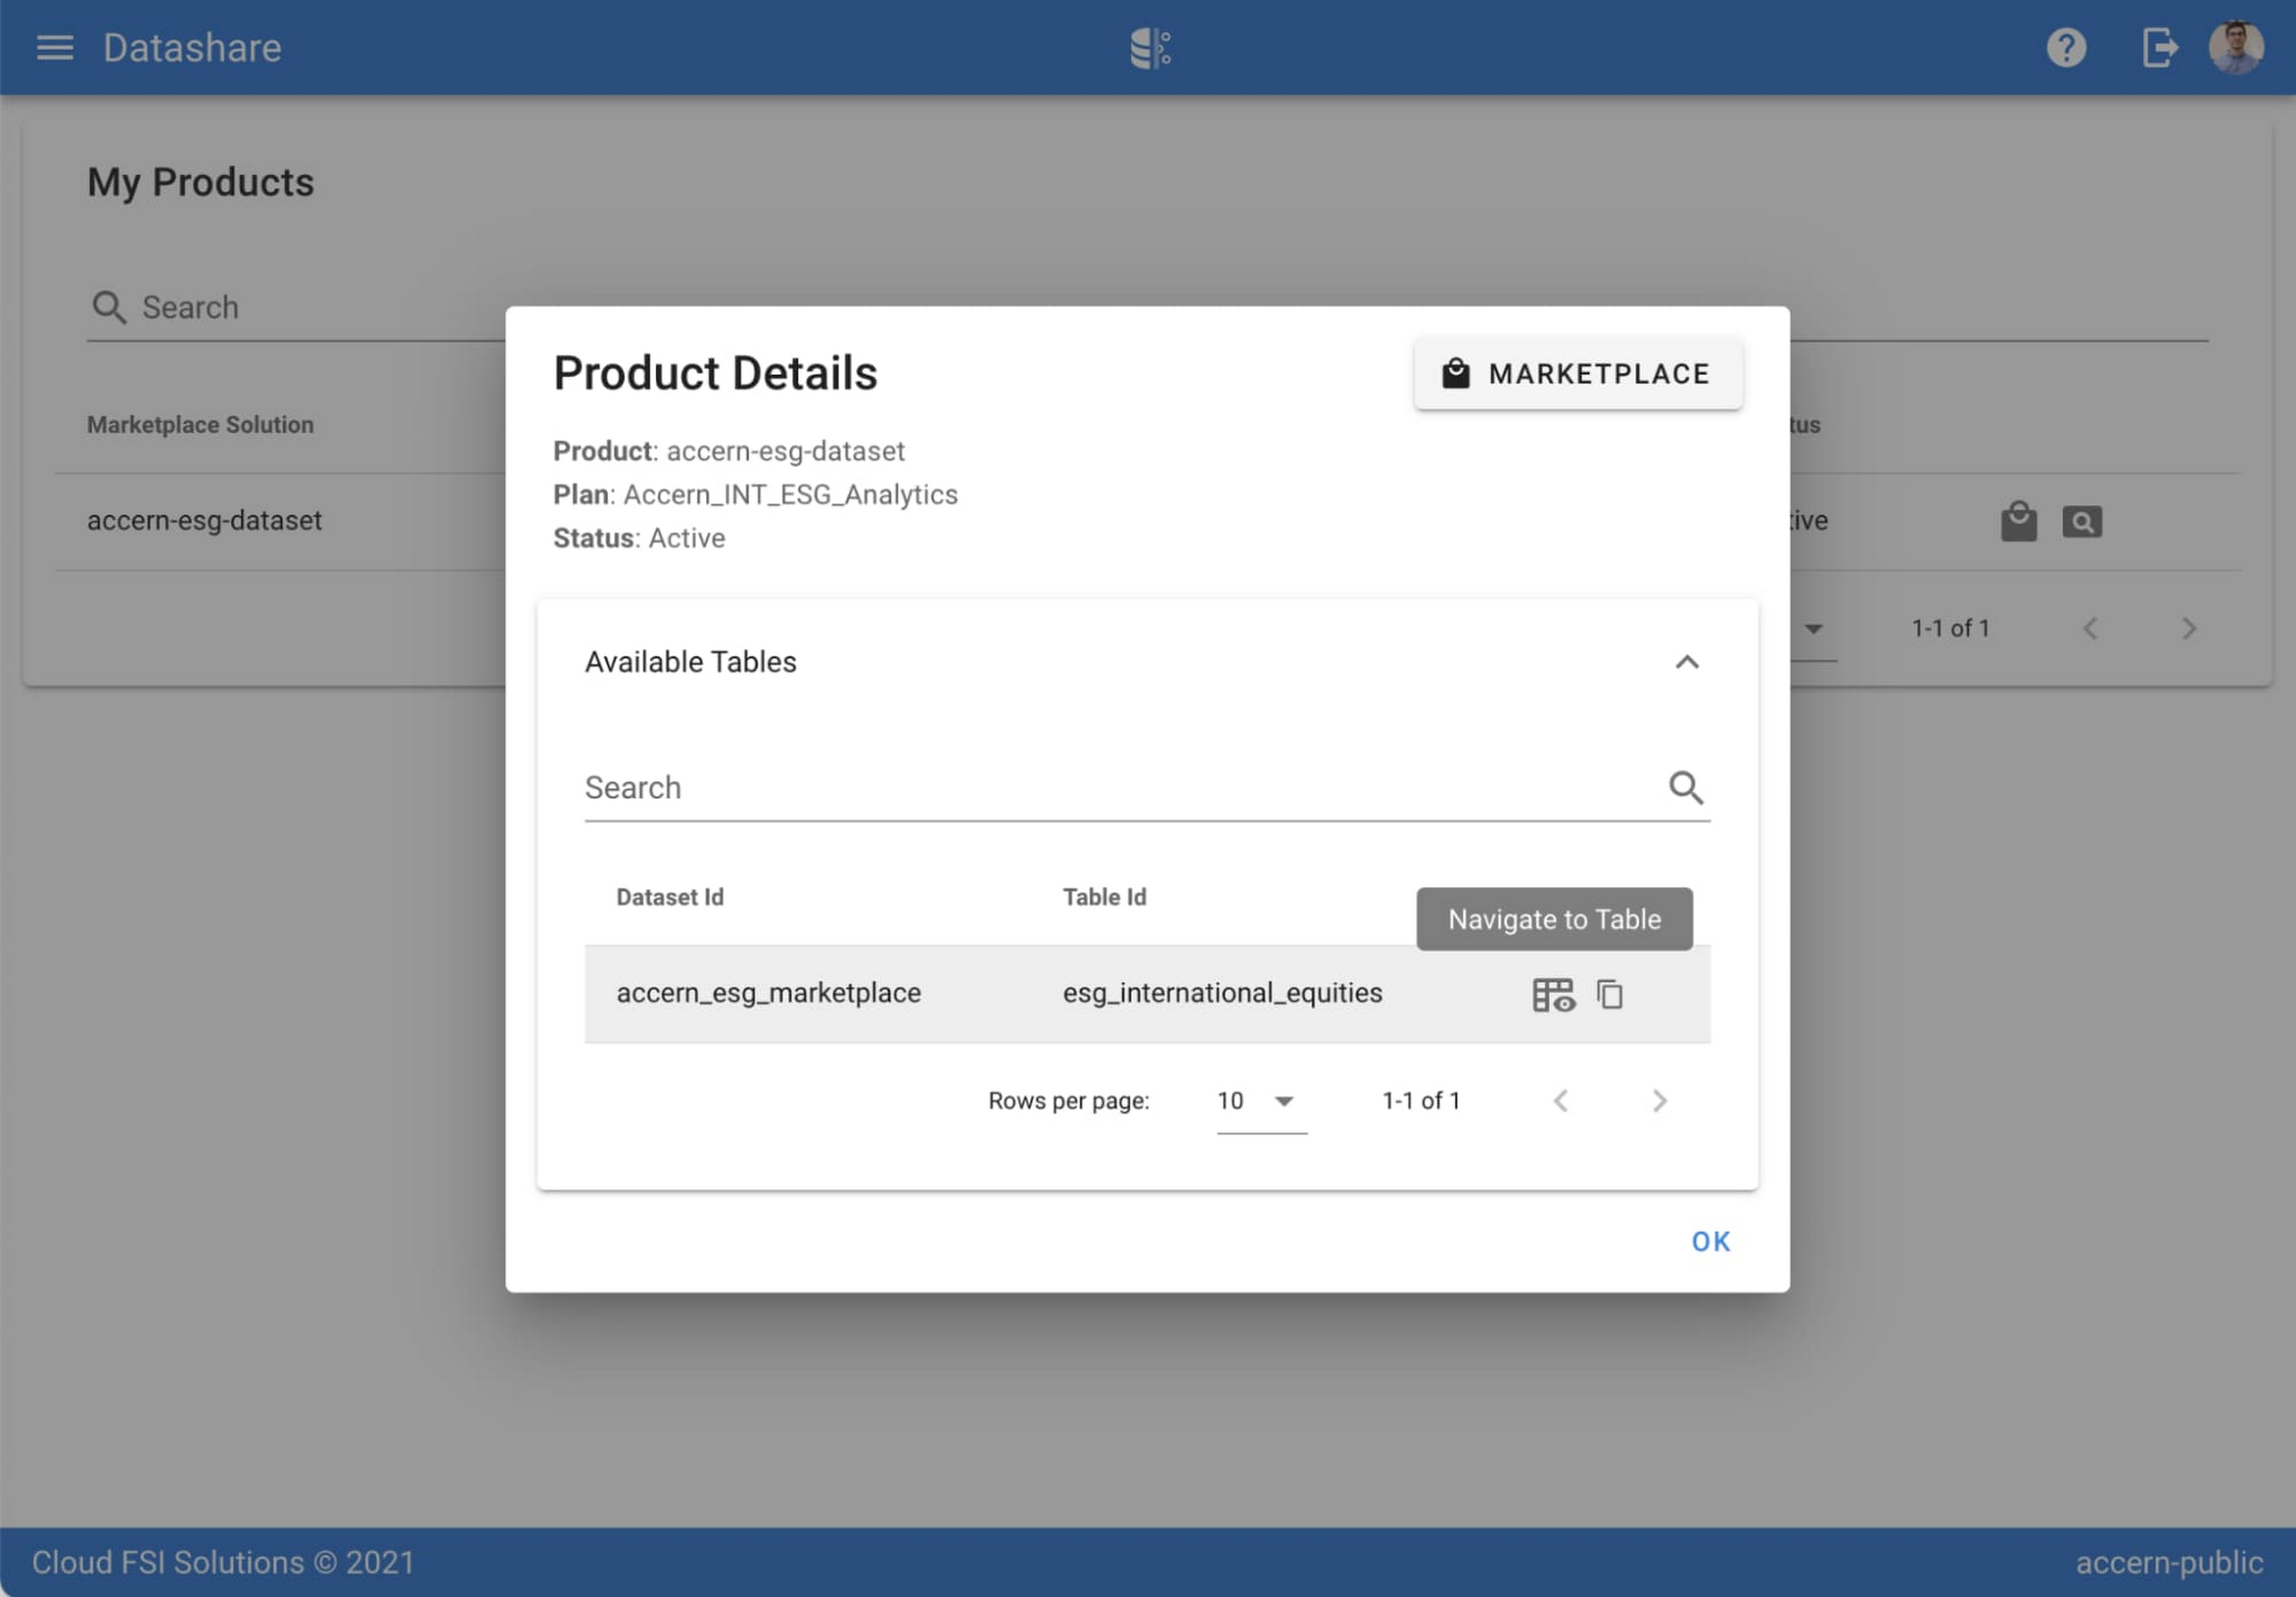
Step 3. Once activation is complete, you’ll be directed to the Datashare ‘My Products’ screen. Voila! You are now subscribed to Accern’s ESG Scores dataset and can access it in your Google Cloud instance using BigQuery. To access the data, click the hour glass icon on the corresponding ‘My Products’ record that you just purchased. An overlay will present you with the details on the dataset and/or table. Click the ‘Navigate to Table’ button to navigate through to the BigQuery console.


Step 4. Now that you have access and are in the BigQuery console, it’s time to generate data insights.
For this example, we’ve eliminated the company identifying information that is included as part of the subscription and aggregated company ESG in a view where each row represents a day, an industry sector, a specific identified ‘ESG Issues’ (event_group and event) and the respective ‘ESG Sentiment’ per issue.

For example, row 1 indicates that within the ‘Healthcare’ sector, there was a ‘Social – Civil Society’ issue identified and it had a negative ESG sentiment score of -15.35.
Step 5. Generate a report by exporting it to Data Studio to build visualizations and conduct additional analysis on the ESG data.
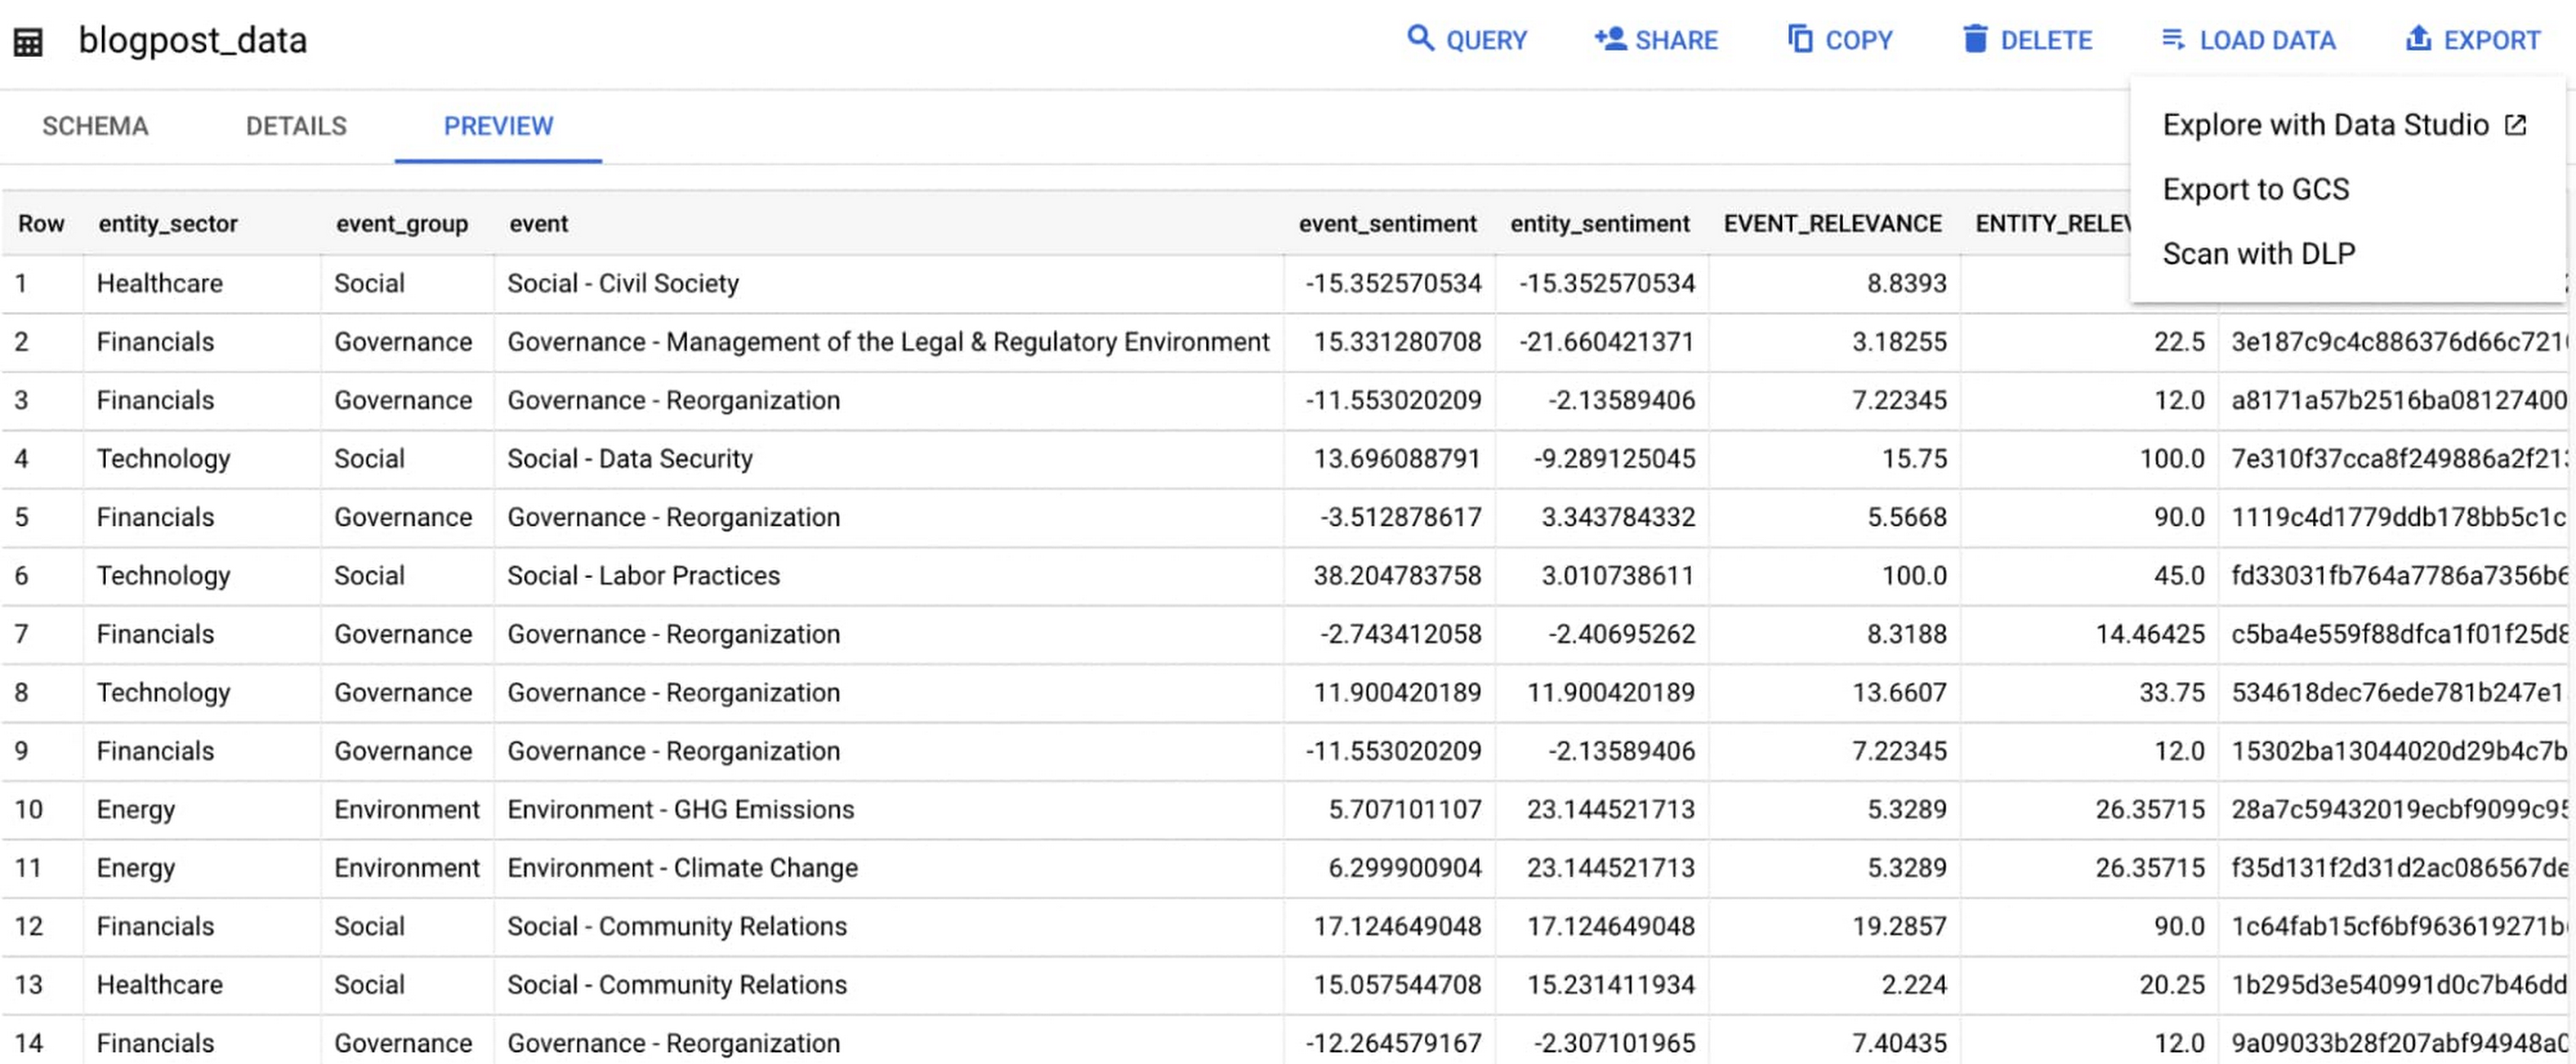
Select ‘Export’ and ‘Explore with Data Studio’.
Step 6. Build a simple/basic report.
Now that the ESG data appears in Data Studio, you can start by building a simple chart to help you understand which industry sectors have the highest volume of discussions around ESG and the overall ESG Sentiment per industry sector.
To build the chart:
- Select the chart type ‘Table’.
- Include
Entity_Sectoras your dimension to aggregate results by ‘Industry Sector.’ - Include
Signal_IDas a measure to count the number of ESG passages identified per ‘Industry Sector.’ - Include
AVG(Event_Sentiment)as a measure to display the overall ESG Sentiment per ‘Industry Sector’ across ESG Issues.

You can see sectors that are most discussed when it comes to ESG related topics and their corresponding ‘ESG Sentiment’ scores.
Step 7. Build your final report in Data Studio.
As a next step you can further drill into the data to understand ESG data specific to each ‘Industry Sector’ and identify positive and negative ESG practices.
Accern has built a more complex sample dashboard and made it available publicly here. You can interact with this report and play around with the data. The dashboard can help to identify material ESG insights for each sector to inform your investment and risk processes. If you have additional questions, you can reach out to Accern directly.

Discovering, accessing and analyzing licensed datasets is quick and easy. Stay tuned for more updates on new licensed datasets.
Publishing your data via Datashare
If you are a publisher of market data, alternative, or exotic data, you can use Datashare to get it published on Google Cloud Marketplace.
Start by joining the Partner Advantage program by registering for the Partner Advantage Portal and applying for the Partner Advantage Build Model engagement. Visit our getting started guide for information to get started on publishing licensed datasets in the Marketplace. Stay tuned for a future blog post about using Datashare to publish datasets in the Marketplace.
More solutions for capital markets
Check out other Google Cloud solutions for capital markets.

5648
Of your peers have already downloaded this article
5:30 Minutes
The most insightful time you'll spend today!
Public cloud, big data, and AI technologies offer competitive advantages and cost savings for capital markets firms ready to make the transition. This paper discusses the three phases capital markets firms go through in transitioning to public cloud, and the workloads, benefits, and cultural changes that characterize the three phases:
Infrastructure Optimizers: The first step on the public cloud journey, where firms focus on migrating specific workloads to save costs.
Cautious Strategists: Firms build on the success of their first public cloud migrations, and begin to change the way they develop technology to increase cost savings and start taking advantage of capabilities only available on public cloud.
Transformative Innovators: Firms shift to a fully public cloud-enabled mentality, and fully leverage the flexibility and agility of the public cloud to build industry-changing solutions and attract top IT talent.
Additionally, we reveal the five things that capital markets innovators who have advanced to the transformation phase do well in their adoption of cloud, big data, and AI technologies across the front, middle, and back office functions.
More Relevant Stories for Your Company


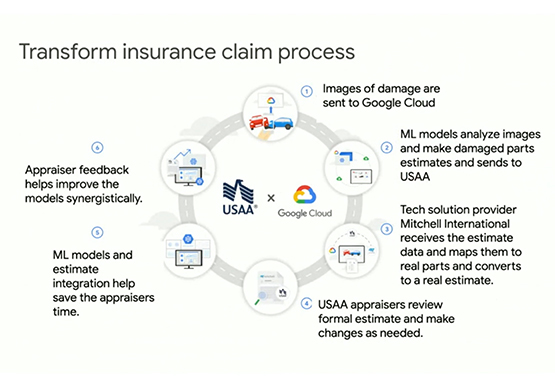

Driving Business Transformation in Financial Services Using Google Cloud and AI/ML
These are challenging times with financial services institutions navigating the pandemic. Interest rates are an all-time low, and customer expectations are changing with the shift to digital. For example, digital banking has increased from 63 in 2019 to 72 percent today. Then regulatory requirements are evolving and compliance costs are

How AI and ML Helps Interpret Baseball Fandom during this MLB Season
The game of baseball has no shortage of statistics -- from batting average to exit velocity, strikeouts to wins above replacement. Among all sports, Major League Baseball (MLB) arguably contains the most analytical and data-driven participants and fan base. Subconsciously or viscerally, players and managers on the field and those following from

How Kinguin Notched Up Shopping Experience with Google Recommendations AI
Over 2.14 billion people worldwide are expected to buy online this year, according to Statista. Online retail sales will account for 22% of all purchases by 2023. But in a competitive retail landscape, positive interactions can mean the difference between a sale and an abandoned shopping cart. One of the leading global

IT Team Figures Out Easiest Way to Build Data Pipelines and Create ML Models
Building a strong brand in today's hyper-competitive business environment takes vision. It also requires a flexible, easily managed approach to digital asset management (DAM), so marketing professionals and other stakeholders can easily share, store, track, and manipulate assets to build the brand. Many of today's leading companies, including JetBlue, Slack,
