






Anthos for Manufacturing: Tackle DevOps Complexities and Drive Digital Transformation
READ FULL INTRODOWNLOAD AGAIN6271
Of your peers have already downloaded this article
2:00 Minutes
The most insightful time you'll spend today!
Combining IoT and Analytics to Warn Manufacturers of Line Break Downs and Increase Profitability

7605
Of your peers have already read this article.
2:45 Minutes
The most insightful time you'll spend today!
Oden Technologies is using the Internet of Things (IoT) to improve the factories of today. The giant network of “things” (including people) connected to each other via the Internet has the potential to reduce waste, increase efficiency, and improve safety across all walks of life. Oden is leading IoT innovation in manufacturing by combining wireless connectivity, big data, and cloud computing.
The use of data to improve manufacturing is practically as old as manufacturing itself. But the computerization of manufacturing has resulted in broad and rapid changes to the way data is collected and processed, as well as the sheer volume of data available.
Oden’s goal is to help manufacturers tap into this data to quickly identify process trends and even warning signs of machine breakdown. Such visibility can reveal opportunities to improve manufacturing and maintenance processes that reduce waste and increase profit margins.
Oden designs and develops data collection devices that can plug into almost any kind of machine and can wirelessly transmit data with minimal complexity and setup time.
Once devices are installed, the Oden technology platform processes data to give manufacturers cutting-edge analytics that are easy to comprehend. Analysis produced by the platform provides factory engineers with data points such as detailed root-cause analysis down to the second, factory-wide performance in real-time, and trend analysis.
Improving cloud delivery
Oden’s previous cloud platform performed satisfactorily, but the company evaluated alternatives in search of potential reductions in cost and complexity and increases in performance.
When evaluating Google Cloud Platform, Oden discovered it would require fewer virtual machine (VM) instances for equivalent performance, which would cut costs. Furthermore, Oden could gain more sophisticated data analytics and machine learning capabilities compared with its existing cloud provider.
Today, Oden runs its entire platform on Google Cloud Platform including Google Compute Engine, Google Cloud Pub/Sub, Google Cloud Bigtable, Google Stackdriver, and Google Kubernetes Engine.
“In order to serve our customers, we need a cloud platform that can scale reliably while keeping costs low, perform under heavy loads, and consistently deliver sophisticated features such as machine learning,” says Willem Sundblad, CEO and Founder at Oden Technologies. “Google Cloud Platform is way ahead in all of these areas compared to our previous cloud provider.”
Capturing tens of millions of metrics a day
Using Google Cloud Platform, Oden can help an average factory capture and store approximately 10 million metrics on a single manufacturing line every day.
Metrics can include extremely granular detail, such as the amount of electricity going to machines, the amount of raw material consumed, and the volume of material produced. Sensors can also capture and transmit environmental information such as temperature, humidity, and dew point so that manufacturers can identify weather-related and seasonal impacts on production.
The updated Oden Cloud Platform uses Kubernetes Engine—powered by the open source Kubernetes system—to run application program interfaces (APIs) that capture data from Oden’s wireless devices on the factory floor.
Google Cloud Pub/Sub then sends the data in real time to Google Cloud Bigtable, where data is processed using Oden’s proprietary analytics tools. Google Stackdriver supports Google Cloud Platform monitoring, logging, and diagnostics, which help Oden deliver its cloud platform with confidence.
Oden Technologies builds dashboards powered by Kubernetes Engine, which pull analyzed data from Google Cloud Bigtable. The dashboards provide customers with real-time visibility into their manufacturing lines. Oden Factory Cloud dashboards allow customers to delve deeper into their data to fine-tune production processes or discover the root causes of production issues.
With the previous cloud provider, Oden required 80 VM instances to run the dashboards. With Google Cloud Platform that number has been cut to 45, which dramatically reduces costs and complexity.
“We migrated from our previous cloud provider to Google Cloud Platform in just one month,” says Willem. “Further, our storage and data analytics costs have decreased by 30%. Cost savings like these allow us to protect customers from rising expenses, keeping us focused on bringing the best products possible to market.”
Faster data access; more efficient factories
With Google Cloud Platform, Oden can now deliver a complete factory analytics picture to manufacturers. In environments where thousands of variables affect the bottom line, businesses can now automatically and perpetually record machine and performance measurement. Oden Factory Cloud gives customers access to comprehensive data insights and can eliminate reliance on onsite infrastructure investments to run their own analytics.
Because manufacturers have access to live data and can analyze production data quickly, they can troubleshoot and resolve problems in minutes rather than months. Such information helps improve product quality, minimize unplanned downtime, cut costs, and improve profitability.
“With the help of Google Cloud Platform, we are helping our customers to be data-driven, which wasn’t possible before,” adds Willem. “They now understand that data is their most important asset. That allows them to be more innovative and continually improve their production processes.”
What’s New in Retail: Bits from Google Cloud’s Retail & Consumer Goods Summit

7974
Of your peers have already read this article.
3:00 Minutes
The most insightful time you'll spend today!
Today we’re hosting our Retail & Consumer Goods Summit, a digital event dedicated to helping leading retailers and brands digitally transform their business. For me, this is a personally exciting moment, as I see tremendous opportunities for those companies that choose to focus on their customers and leverage technology to elevate experiences.
Our event includes breakout sessions to help retailers and brands become customer centric, embrace the digital moment and transform their operations. Some of my favorite sessions include:
- Why Search Abandonment is the metric that matters, highlighting Retail Search, and featuring a conversation with Macy’s
- Driving Consumer Closeness in a Privacy-Centric World, discussing how retailers and brands can create a successful first party data strategy, featuring a conversation with P&G
- The Modern Store: 7 Innovation Hotspots, sharing how retailers and brands can approach store transformation to unlock the most value from technology, featuring a conversation with The Home Depot.
I’ll be speaking in our Retail Spotlight session, discussing the current retail landscape and our industry approach, followed by conversations with Albert Bertilsson, Head of Engineering – Edge at IKEA Retail (Indga Group) and Neelima Sharma, Senior Vice President, Technology Ecommerce, Marketing and Merchandising at Lowe’s.
Let me share a bit more about the topics we’ll discuss in that session.
In retail specifically, digital-first shopping journeys are blurring the lines between the physical and digital brand experience. Shoppers want to know what’s available before they visit your stores, and they expect fulfillment options like curbside pickup. We see this when tracking trends for interest in curbside pickup or in-stock items.

This has left many retailers asking how they can get smarter with their data, tackle the $300 billion dollar problem of “search abandonment,” move faster to create new customer experiences, and do a better job of connecting their employees and customers – with confidence.
Our team has been spending time thinking about how we can rise and succeed in this new era together. We continue to focus on areas where we can bring the best of our capabilities to our retail customers around the world. And we’re focused on ways we can bring the best of what Google has to offer through cloud integrations.
Our goal is to help retailers become customer-centric and data-driven, capture digital and omni-channel revenue growth, create the modern store and drive operational improvement.

Let’s dig into each of these strategic pillars in a bit more detail.
Become customer centric and data driven
Customers today expect experiences that are timely, targeted, and tailored for them and their needs, and reject experiences that can’t deliver these features. Data modeling, legacy technology, and siloed systems often prevent retailers from providing that level of personalized experience.
At Google Cloud, we work with global retailers and our ecosystem partners to activate and bring value from first-party data, particularly in the field of customer data platforms (CDPs). This includes integrations from Google Cloud, such as our business intelligence platform Looker and other popular platforms to power one source of customer data through the organization. We also help retailers modernize their data warehouse with Looker for gathering business intelligence across their organization. This is important not just for consumer data, but inventory, supply chain, and store operations as well.
Capture Digital and Omnichannel Growth
We power some of the largest e-commerce sites in the world, helping them scale for Black Friday, Cyber Monday, and other holiday events. While scale is critically important, it’s also important to consider the quality of the online experience. How do your customers find products? How can you help deliver seamless online and omnichannel experiences?
To help, we’re building product discovery solutions that bring together the best of our technologies that help retailers drive engagement with their consumers. Retail Search, for example, gives retailers the ability to provide Google-quality search on their own digital properties – search that is customizable for their unique business needs and built upon Google’s advanced understanding of user intent & context.
The imperative is clear. Recent research found that retailers lose more than $300 billion to search abandonment — when purchase intent is not converted into a sale due to bad search results — every year in the US alone.
Today, we announced that Retail Search is available to a larger set of retailers. If you are interested in learning more about Retail Search you can contact your sales representative for additional details.
Create the modern store
With the rise of buying trends like curbside pickup and proximity-based search, our Google Maps Platform team is working on new products and features to help raise inventory awareness for your shoppers. We want to help you make it easier for them to understand what’s available to purchase in their channel of choice.
With Product Locator, each product page connects customers with information they need for local pickup and delivery options. This ensures customers are aware of pickup and delivery options throughout the buying journey—not just checkout.
Awareness of local inventory can boost a wide range of key metrics for your business. Shopify recently shared that shoppers who opt for local pickup over delivery had a +13% higher conversion rate and that 45% of local pickup customers make an additional purchase upon arrival.
This is just one quick example of how our Google Maps Platform team can improve experiences for your shoppers.
Operational improvement
It can be challenging to operate in a world and at a time when consumer behavior and supply chains are so disrupted and volatile, and where entire retail teams had to go remote during the pandemic and beyond.
We’re working with retailers to leverage artificial intelligence (AI) to improve consumer experience through chat bots or conversational commerce that solves problems for customers from anywhere. You can learn more about these offerings in our Conversational Commerce with Google breakout session, featuring Albertsons.
As the need for digital transformation continues to accelerate, Google Cloud is helping retailers stay ahead of the curve with solutions for digital and omnichannel growth, data-driven and customer-focused experiences, and operational improvement. For every era of cloud technologies, from the past into the future, Google Cloud is committed to providing solutions to retailers.
Read more about our solutions for retail, and check out additional sessions, including the CPG Industry Spotlight Session How To Grow Brands in Times of Rapid Change – Featuring L’Oréal at our Retail & Consumer Goods Summit.
Apollo24|7 partnered with Google Cloud to build the Clinical Decision Support System (CDSS) together

2741
Of your peers have already read this article.
4:30 Minutes
The most insightful time you'll spend today!
Clinical Decision Support System (CDSS) is an important technology for the healthcare industry that analyzes data to help healthcare professionals make decisions related to patient care. The market size for the global clinical decision support system appears poised for expansion, with one study predicting a compound annual growth rate (CAGR) of 10.4%, from 2022 to 2030, to $10.7 billion.
For any health organization that wants to build a CDSS system, one key block is to locate and extract the medical entities that are present in the clinical notes, medical journals, discharge summaries, etc. Along with entity extraction, the other key components of the CDSS system are capturing the temporal relationships, subjects, and certainty assessments.
At Google Cloud, we know how critical it is for the healthcare industry to build CDSS systems, so we worked with Apollo 24|7, the largest multi-channel digital healthcare platform in India, to build the key blocks of their CDSS solution.
We helped them to parse the discharge summaries and prescriptions to extract the medical entities. These entities can then be used to build a recommendation engine that would help doctors with the “Next Best Action” recommendation for medicines, lab tests, etc.
Let’s take a sneak peek at Apollo 24|7’s entity extraction solutions, and the various Google AI technologies that were tested to form the technology stack.
Datasets Used
To perform our experiments on entity extraction, we used two types of datasets.
- i2b2 Dataset – i2b2 is an open-source clinical data warehousing and analytics research platform that provides annotated deidentified patient discharge summaries made available to the community for research purposes. This dataset was primarily used for training and validation of the models.
- Apollo 24|7’s Dataset – De-identified doctor’s notes from Apollo24|7 were used for testing. Doctors annotated them to label the entities and offset values.
Experimentation and choosing the right approach — Four models put to test
For entity extraction, both Google Cloud products and open-source approaches were explored. Below are the details:
- Healthcare Natural Language API: This is a no-code approach that provides machine learning solutions for deriving insights from medical text. Using this, we parsed unstructured medical text and then generated a structured data representation of the medical knowledge entities stored in the data for downstream analysis and automation. The process includes:
- Extract information about medical concepts like diseases, medications, medical devices, procedures, and their clinically relevant attributes;
- Map medical concepts to standard medical vocabularies such as RxNorm, ICD-10, MeSH, and SNOMED CT (US users only);
- Derive medical insights from text and integrate them with data analytics products in Google Cloud.
The advantage of using this approach is that it not only extracts a wide range of entity types like MED_DOSE, MED_DURATION, LAB_UNIT, LAB_VALUE, etc, but also captures functional features such as temporal relationships, subjects, and certainty assessments, along with the confidence scores. Since it is available on Google Cloud, this offers long-term product support. It is also the only fully-managed NLP service among all the approaches tested and hence, it requires the least effort to implement and manage.
But one thing to keep in mind is that since the Healthcare NL API offers natural language models that are pre-trained, it currently cannot be used for custom entity extraction models trained using custom annotated medical text or to extract custom entities. This has to be done via AutoML Entity Extraction for Healthcare, another Google Cloud service for custom model development. Custom model development is important for adapting the pre-trained models to new languages or region-specific natural language processing, such as medical terms whose use may be more prevalent in India than in other regions
- Vertex AutoML Entity Extraction for Healthcare: This is a low-code approach that’s already available on Google Cloud. We used AutoML Entity Extraction to build and deploy custom machine learning models that analyzed documents, categorized them, and identified entities within them. This custom machine learning model was trained on the annotated dataset provided by the Apollo 24|7 team.
The advantage of AutoML Entity Extraction is that it gives the option to train on a new dataset. However, one of the prerequisites to keep in mind is that it needs a little pre-processing to capture the input data in the required JSONL format. Since this is an AutoML model just for Entity Extraction, it does not extract relationships, certainty assessments, etc.
- BERT-based Models on Vertex AI: Vertex AI is Google Cloud’s fully managed unified AI platform to build, deploy, and scale ML models faster, with pre-trained and custom tooling. We experimented with multiple custom approaches based on pre-trained BERT-based models, which have shown state-of-the-art performance in many natural language tasks. To gain better contextual understanding of medical terms and procedures, these BERT-based approaches are explicitly trained on medical domain data. Our experiments were based on BioClinical BERT, BioLink BERT, Blue BERT trained on Pubmed dataset, and Blue BERT trained on Pubmed + MIMIC datasets.
The major advantage of these BERT-based models is that they can be finetuned on any Entity Recognition task with minimal efforts.
However, since this is a custom approach, it requires some technical expertise. Additionally, it does not extract relationships, certainty assessments, etc. This is one of the main limitations of using BERT-based models.
- ScispaCy on Vertex AI: We used Vertex AI to perform experiments based on ScispaCy, which is a Python package containing spaCy models for processing biomedical, scientific or clinical text.
Along with Entity Extraction, Scispacy on Vertex AI provides additional components like Abbreviation Detector, Entity Linking, etc. However, when compared to other models, it was less precise, with too many junk phrases, like “Admission Date,” captured as entities.
“Exploring multiple approaches and understanding the pros/cons of each approach helped us to decide the one that would fit our business requirements.” according to Abdussamad M, Engineering Lead at Apollo 24|7.
Evaluation Strategy
In order to match the parsed entity with the test data labels, we used extensive matching logic that comprised of the below four methods:
- Exact Match – Exact match captures entities where the model output and the entities in the test dataset match. Here, the offset values of the entities have also been considered. For example, the entity “gastrointestinal infection” that is present as-is in both the model output and the test label will be considered an “Exact Match.”
- Match-Score Logic – We used a scoring logic for matching the entities. For each word in the test data labels, every word in the model output is matched along with the offset. A score is calculated between the entities and based on the threshold, it is considered as a match.
- Partial Match – In this matching logic, entities like “hypertension” and “hypertensive” are matched based on the Fuzzy logic.
- UMLS Abbreviation Lookup – We also observed that the medical text had some abbreviations, like AP meaning abdominal pain. These were first expanded by doing a lookup on the respective UMLS (Unified Medical Language System) tables and then passed to the individual entity extraction models.
Performance Metrics
We used precision and recall metrics to compare the outcomes of different models/experiments.
Precision (also called positive predictive value) is the fraction of relevant instances among the retrieved instances, while recall (also known as sensitivity) is the fraction of relevant instances that were retrieved.
The below example shows how to calculate these metrics for a given sample.
Example sample: “Krish has fever, headache and feels uncomfortable”
Expected Entities: [“fever”, “headache”]
Model Output: [“fever”, “feels”, “uncomfortable”]
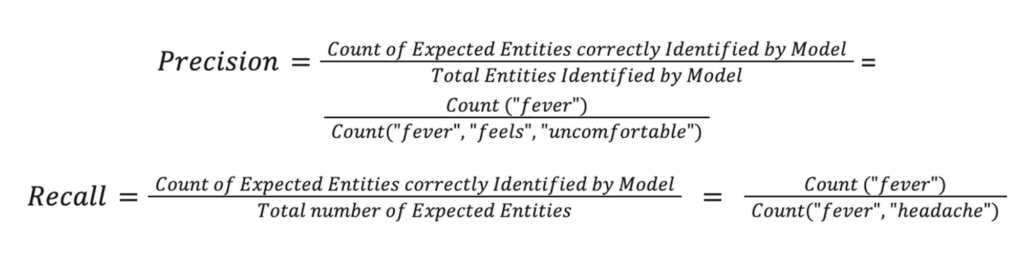
Thus,

Experimentation Results
The following table captures the results of the above experiments on Apollo24|7’s internal datasets.
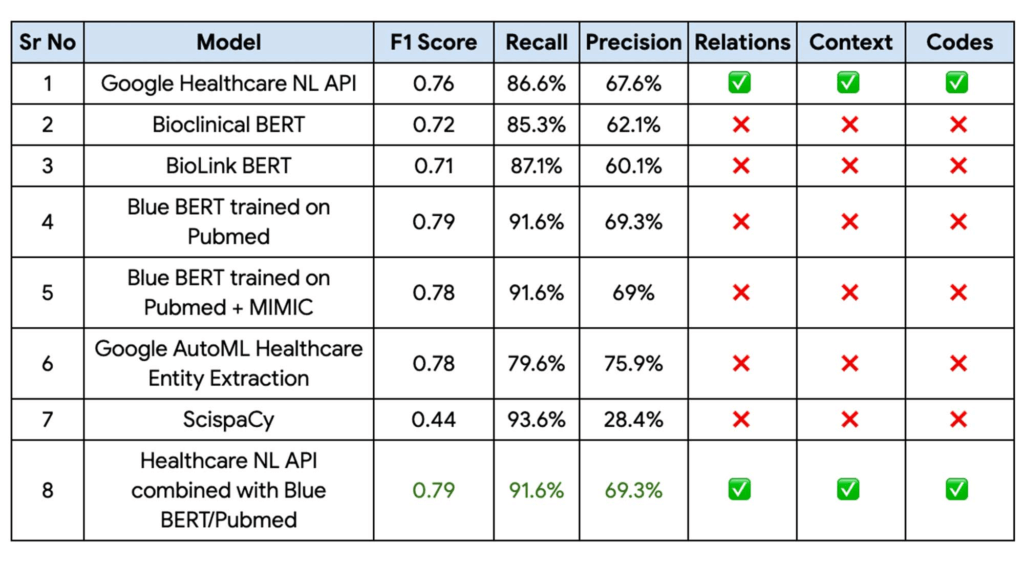
Finally, the Blue BERT model trained on the Pubmed dataset had the best performance metrics with a 81% improvement on Apollo 24|7’s baseline mode with the Healthcare Natural Language API providing the context, relationships, and codes. This performance could be further improved by implementing an ensemble of these two models.
“With the Blue BERT model giving the best performance for entity extraction on Vertex AI and the Healthcare NL API being able to extract the relationships, certainty assessments etc, we finally decided to go with an ensemble of these 2 approaches,“ Abdussamad added.
Fast track end-to-end deployment with Google Cloud AI Services (AIS)
Google AIS (Professional Services Organization) helped Apollo24|7 to build the key blocks of the CDSS system.
The partnership between Google Cloud and Apollo 24|7 is just one of the latest examples of how we’re providing AI-powered solutions to solve complex problems to help organizations drive the desired outcomes. To learn more about Google Cloud’s AI services, visit our AI & ML Products page, and to learn more about Google Cloud solutions for health care, explore our Google Cloud Healthcare Data Engine page.
Acknowledgements
We’d like to give special thanks to Nitin Aggarwal, Gopala Dhar and Kartik Chaudhary for their support and guidance throughout the project. We are also thankful to Manisha Yadav, Santosh Gadgei and Vasantha Kumar for implementing the GCP infrastructure. We are grateful to the Apollo team (Chaitanya Bharadwaj, Abdussamad GM, Lavish M, Dinesh Singamsetty, Anmol Singh and Prithwiraj) and our partner team from HCL/Wipro (Durga Tulluru and Praful Turanur) who partnered with us in delivering this successful project. Special thanks to the Cloud Healthcare NLP API team (Donny Cheung, Amirhossein Simjour, and Kalyan Pamarthy).
Custom Voice Feature Can Help Brands Tweak IVR for Better Customer Experiences

5142
Of your peers have already read this article.
1:30 Minutes
The most insightful time you'll spend today!
With the rise of digital assistants and conversational interfaces, people have grown accustomed to hearing and speaking to synthetic voices. But what do those voices sound like? Often, pretty repetitive. We’re all familiar with the Google Assistant voice, for example.
That’s why we are excited to announce the general availability of Custom Voice in our Cloud Text-to-Speech (TTS) API, a new feature that lets you train custom voice models with your own audio recordings to create unique experiences.
For businesses looking to build a strong brand identity, establishing a unique voice can help turn mobile app interactions or customer service based on interactive voice responses (IVR) into differentiated customer experiences. Our TTS API has included a speech synthesis service with a static list of voices for some time, but now, with Custom Voice, moving beyond these predefined options is easier than ever.
Custom Voice lets you simply submit your audio recordings to get access to the new voice directly in the TTS API. Custom Voice TTS includes guidance on the audio requirements to help make sure you generate a high quality custom TTS voice model. Once this new model is trained, all you have to do to start using the newly trained voice is reference the model ID in your calls to the Cloud TTS API.
At Google, we are committed to building safe and accountable AI products, not only because it’s the right thing to do, but because it is a critical step in ensuring successful use in production. As part of Google Cloud’s Responsible AI governance process, we conducted a deep ethical evaluation of Custom Voice TTS, and its relation to synthetic media, in order to surface and mitigate potential harms that it may create. If you are interested in Custom Voice TTS, there is a review process to help ensure each use case is aligned with our AI Principles and adequate voice actor consent is given.
Additionally, to verify that voice actors are actually the ones producing the audio, you will need to submit an audio file producing a sentence that Google Cloud chooses (for example: “I agree that my voice will be used to create a synthetic custom Text-to-Speech voice).
We’re looking forward to seeing this API help businesses solve problems in an easy, fast, and scalable way. TTS Custom Voice is now GA in these languages:
English (US)
English (AU)
English (UK)
Spanish (US)
Spanish (Spain)
French (France)
French (Canada)
Italian (Italy)
German (Germany)
Portugues (Brazil)
Japanese (Japan)
We plan to continue expanding this lineup in order to meet your needs. Ready to try for yourself? Contact your seller to get started on your use case evaluation today!
BigQuery Explainable AI for Demystifying the Inner Workings of ML Models. Now GA!

6572
Of your peers have already read this article.
2:00 Minutes
The most insightful time you'll spend today!
Explainable AI (XAI) helps you understand and interpret how your machine learning models make decisions. We’re excited to announce that BigQuery Explainable AI is now generally available (GA). BigQuery is the data warehouse that supports explainable AI in a most comprehensive way w.r.t both XAI methodology and model types. It does this at BigQuery scale, enabling millions of explanations within seconds with a single SQL query.
Why is Explainable AI so important? To demystify the inner workings of machine learning models, Explainable AI is quickly becoming an essential and growing need for businesses as they continue to invest in AI and ML. With 76% of enterprises now prioritizing artificial intelligence (AI) and machine learning (ML) over other initiatives in 2021 IT budgets, the majority of CEOs (82%) believe that AI-based decisions must be explainable to be trusted according to a PwC survey.
While the focus of this blogpost is on BigQuery Explainable AI, Google Cloud provides a variety of tools and frameworks to help you interpret models outside of BigQuery, such as with Vertex Explainable AI, which includes AutoML Tables, AutoML Vision, and custom-trained models.
So how does Explainable AI in BigQuery work exactly? And how might you use it in practice?
Two types of Explainable AI: global and local explainability
When it comes to Explainable AI, the first thing to note is that there are two main types of explainability as they relate to the features used to train the ML model: global explainability and local explainability.
Imagine that you have a ML model that predicts housing price (as a dollar amount), based on three features: (1) number of bedrooms, (2) distance to the nearest city center, and (3) construction date.
Global explainability (a.k.a. global feature importance) describes the features’ overall influence on the model and helps you understand if a feature had a greater influence than other features over the model’s predictions. For example, global explainability can reveal that the number of bedrooms and distance to city center typically has a much stronger influence than the construction date on predicting housing prices. Global explainability is especially useful if you have hundreds or thousands of features and you want to determine which features are the most important contributors to your model. You may also consider using global explainability as a way to identify and prune less important features to improve the generalizability of their models.
Local explainability (a.k.a. feature attributions) describes the breakdown of how each feature contributes towards a specific prediction. For example, if the model predicts that house ID#1001 has a predicted price of $230,000, local explainability would describe a baseline amount (e.g. $50,000) and how each of the features contributes on top of the baseline towards the predicted price. For example, the model may say that on top of the baseline of $50,000, having 3 bedrooms contributed an additional $50,000, close proximity to the city center added $100,000, and construction date of 2010 added $30,000, for a total predicted price of $230,000. In essence, understanding the exact contribution of each feature used by the model to make each prediction is the main purpose of local explainability.
What ML models does BigQuery Explainable AI apply to?
BigQuery Explainable AI applies to a variety of models, including supervised learning models for IID data and time series models. The documentation for BigQuery Explainable AI provides an overview of the different ways of applying explainability per model. Note that each explainability method has its own way of calculation (e.g. Shapley values), which are covered more in-depth in the documentation.

Examples with BigQuery Explainable AI
In this next section, we will show three examples of how to use BigQuery Explainable AI in different ML applications:
Regression models with BigQuery Explainable AI
Let’s use a boosted tree regression model to predict how much a taxi cab driver will receive in tips for a taxi ride, based on features such as number of passengers, payment type, total payment and trip distance. Then let’s use BigQuery Explainable AI to help us understand how the model made the predictions in terms of global explainability (which features were most important?) and local explainability (how did the model arrive at each prediction?).
The taxi trips dataset comes from the BigQuery public datasets and is publicly available in the table: bigquery-public-data.new_york_taxi_trips.tlc_yellow_trips_2018.
First, you can train a boosted tree regression model.
CREATE OR REPLACE MODEL bqml_tutorial.taxi_tip_regression_modelOPTIONS (model_type='boosted_tree_regressor',input_label_cols=['tip_amount'],max_iterations = 50,tree_method = 'HIST',subsample = 0.85,enable_global_explain = TRUE) ASSELECTvendor_id,passenger_count,trip_distance,rate_code,payment_type,total_amount,tip_amountFROM`bigquery-public-data.new_york_taxi_trips.tlc_yellow_trips_2018`WHERE tip_amount >= 0LIMIT 1000000
Now let’s do a prediction using ML.PREDICT, which is the standard way in BigQuery ML to make predictions without explainability.
SELECT *FROMML.PREDICT(MODEL bqml_tutorial.taxi_tip_regression_model,(SELECT"0" AS vendor_id,1 AS passenger_count,CAST(5.85 AS NUMERIC) AS trip_distance,"0" AS rate_code,"0" AS payment_type,CAST(55.56 AS NUMERIC) AS total_amount))

But you might wonder—how did the model generate this prediction of ~11.077?
BigQuery Explainable AI can help us answer this question. Instead of using ML.PREDICT, you use ML.EXPLAIN_PREDICT with an additional optional parameter top_k_features. ML.EXPLAIN_PREDICT extends the capabilities of ML.PREDICT by outputting several additional columns that explain how each feature contributes to the predicted value. In fact, since ML.EXPLAIN_PREDICT includes all the output from ML.PREDICT anyway, you may want to consider using ML.EXPLAIN_PREDICT every time instead.
SELECT *FROMML.EXPLAIN_PREDICT(MODEL bqml_tutorial.taxi_tip_regression_model,(SELECT"0" AS vendor_id,1 AS passenger_count,CAST(5.85 AS NUMERIC) AS trip_distance,"0" AS rate_code,"0" AS payment_type,CAST(55.56 AS NUMERIC) AS total_amount),STRUCT(6 AS top_k_features))

The way to interpret these columns is:
Σfeature_attributions + baseline_prediction_value = prediction_value
Let’s break this down. The prediction_value is ~11.077, which is simply the predicted_tip_amount. The baseline_prediction_value is ~6.184, which is the tip amount for an average instance. top_feature_attributions indicates how much each of the features contributes towards the prediction value. For example, total_amount contributes ~2.540 to the predicted_tip_amount.
ML.EXPLAIN_PREDICT provides local feature explainability for regression models. For global feature importance, see the documentation for ML.GLOBAL_EXPLAIN.
Classification models with BigQuery Explainable AI
Let’s use a logistic regression model to show you an example of BigQuery Explainable AI with classification models. We can use the same public dataset as before: bigquery-public-data.new_york_taxi_trips.tlc_yellow_trips_2018.
Train a logistic regression model to predict the bracket of the percentage of the tip amount out of the taxi bill.
CREATE OR REPLACE MODEL bqml_tutorial.taxi_tip_classification_modelOPTIONS(model_type='logistic_reg',input_label_cols=['tip_bucket'],enable_global_explain=true) ASSELECTvendor_id,passenger_count,trip_distance,rate_code,payment_type,total_amount,CASEWHEN tip_amount > total_amount*0.20 THEN '20% or more'WHEN tip_amount > total_amount*0.15 THEN '15% to 20%'WHEN tip_amount > total_amount*0.10 THEN '10% to 15%'ELSE '10% or less'END AS tip_bucketFROM`bigquery-public-data.new_york_taxi_trips.tlc_yellow_trips_2018`WHERE tip_amount >= 0LIMIT 1000000
Next, you can run ML.EXPLAIN_PREDICT to get both the classification results and the additional information for local feature explainability. For global explainability, you can use ML.GLOBAL_EXPLAIN. Again, since ML.EXPLAIN_PREDICT includes all the output from ML.PREDICT anyway, you may want to consider using ML.EXPLAIN_PREDICT every time instead.
SELECT *FROMML.EXPLAIN_PREDICT(MODEL bqml_tutorial.taxi_tip_classification_model,(SELECT"0" AS vendor_id,1 AS passenger_count,CAST(5.85 AS NUMERIC) AS trip_distance,"0" AS rate_code,"0" AS payment_type,CAST(55.56 AS NUMERIC) AS total_amount),STRUCT(6 AS top_k_features))

Similar to the regression example earlier, the formula is used to derive the prediction_value:
Σfeature_attributions + baseline_prediction_value = prediction_value
As you can see in the screenshot above, the baseline_prediction_value is ~0.296. total_amount is the most important feature in making this specific prediction, contributing ~0.067 to the prediction_value, though followed by trip_distance. The feature passenger_count contributes negatively to prediction_value by -0.0015. The features vendor_id, rate_code, and payment_type did not seem to contribute much to the prediction_value.
You may wonder why the prediction_value of ~0.389 doesn’t equal the probability value of ~0.359. The reason is that unlike for regression models, for classification models, prediction_value is not a probability score. Instead, prediction_value is the logit value (i.e., log-odds) for the predicted class, which you could separately convert to probabilities by applying the softmax transformation to the logit values. For example, a three-class classification has a log-odds output of [2.446, -2.021, -2.190]. After applying the softmax transformation, the probability of these class predictions is [0.9905, 0.0056, 0.0038].
Time-series forecasting models with BigQuery Explainable AI

Explainable AI for forecasting provides more interpretability into how the forecasting model came to its predictions. Let’s go through an example of forecasting the number of bike trips in NYC using the new_york.citibike_trips public data in BigQuery.
You can train a time-series model ARIMA_PLUS:
CREATE OR REPLACE MODEL bqml_tutorial.nyc_citibike_arima_modelOPTIONS(model_type = 'ARIMA_PLUS',time_series_timestamp_col = 'date',time_series_data_col = 'num_trips',holiday_region = 'US') ASSELECTEXTRACT(DATE from starttime) AS date,COUNT(*) AS num_tripsFROM`bigquery-public-data.new_york.citibike_trips`GROUP BY dateNext, you can first try forecasting without explainability using ML.FORECAST:SELECT*FROMML.FORECAST(MODEL bqml_tutorial.nyc_citibike_arima_model,STRUCT(365 AS horizon, 0.9 AS confidence_level))
This function outputs the forecasted values and the prediction interval. Plotting it in addition to the input time series gives the following figure.

But how does the forecasting model arrive at its predictions? Explainability is especially important if the model ever generates unexpected results.
With ML.EXPLAIN_FORECAST, BigQuery Explainable AI provides extra transparency into the seasonality, trend, holiday effects, level (step) changes, and spikes and dips outlier removal. In fact, since ML.EXPLAIN_FORECAST includes all the output from ML.FORECAST anyway, you may want to consider using ML.EXPLAIN_FORECAST every time instead.
SELECT*FROMML.EXPLAIN_FORECAST(MODEL bqml_tutorial.nyc_citibike_arima_model,STRUCT(365 AS horizon, 0.9 AS confidence_level))

Compared to the previous figure which only shows the forecasting results, this figure shows much richer information to explain how the forecast is made.
First, it shows how the input time series is adjusted by removing the spikes and dips anomalies, and by compensating the level changes. That is:
time_series_adjusted_data = time_series_data - spikes_and_dips - step_changes
Second, it shows how the adjusted input time series is decomposed into different components such as both weekly and yearly seasonal components, holiday effect component and trend component. That is
time_series_adjusted_data = trend + seasonal_period_yearly + seasonal_period_weekly + holiday_effect + residual
Finally, it shows how these components are forecasted separately to compose the final forecasting results. That is:
time_series_data = trend + seasonal_period_yearly + seasonal_period_weekly + holiday_effect
For more information on these time series components, please see the documentation here.
Conclusion
With the GA of BigQuery Explainable AI, we hope you will now be able to interpret your machine learning models with ease.
Thanks to the BigQuery ML team, especially Lisa Yin, Jiashang Liu, Amir Hormati, Mingge Deng, Jerry Ye and Abhinav Khushraj. Also thanks to the Vertex Explainable AI team, especially David Pitman and Besim Avci.
More Relevant Stories for Your Company

Three Data Insights That Set Marketing Leaders Apart from Marketing Laggards
With insights directing the bulk of today’s marketing decisions, leading marketers are driving growth by embracing three core mindset shifts. Marketing leaders are working toward a holistic view of consumers; they are investing in machine learning to support their activities; and they believe how they apply their data is crucial
Delivering 10X Improvement to Risk and Regulatory Reporting Through Cloud and AI
Enterprise agility and the ability to innovate, adapt and respond quickly to the ever-changing risk and regulatory landscape is no longer a choice, but the cornerstone of successful digital transformation and commercial growth. Traditional access to and ways of managing data invariably create challenges in dealing with multiple data repositories,

Upgrade Your Contact Center with Knowlarity’s AI-powered Speech Analytics for Higher CX
Did you know, everyday about 56 million hours worth of phone conversations, equalling to 420 billion spoken words are handled by contact centers? Knowlarity, a renowned cloud business communication service provider with nearly 6,000 customers and over a million virtual users, leverages AI-powered speech analytics that offer insights to gauge

Everything You Want to Know About Google Cloud’s AI-Enabled Talent Solution: From What It Is to How to Use it
First, What is Google Cloud Talent Solution? Cloud Talent Solution is a service that brings machine learning to the job search experience, returning high quality results to job seekers far beyond the limitations of typical keyword-based methods. Once integrated with your job content, Cloud Talent Solution automatically detects and infers
