





Google Data Cloud: The Catalyst for Modern App Development and Innovation

1368
Of your peers have already read this article.
3:30 Minutes
The most insightful time you'll spend today!
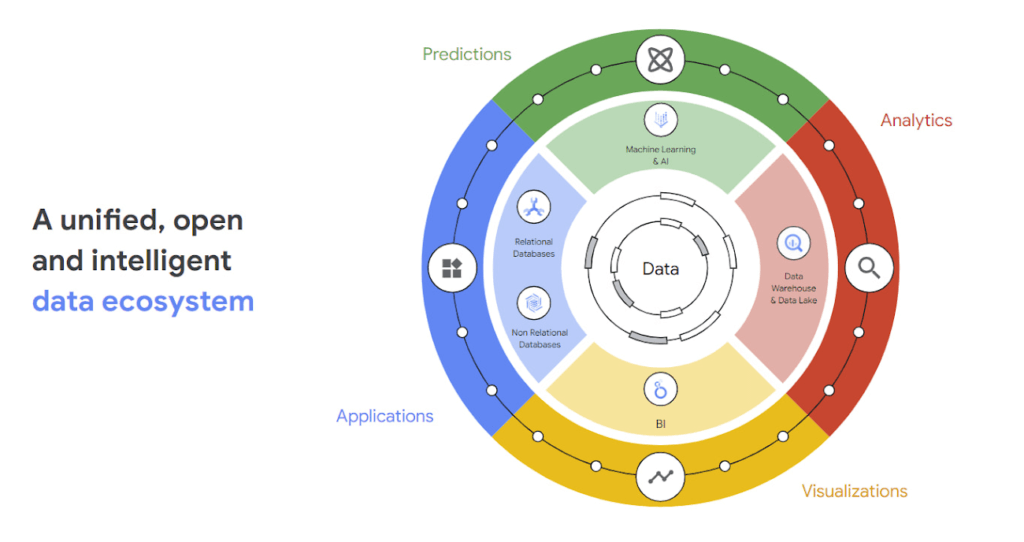
97 zettabytes was the estimated volume of data generated worldwide in 20221. This sort of explosion in data volume is happening in every enterprise. Now imagine being able to access all this data you own from anywhere, at any time, analyze it, and leverage its insights to innovate your products and services? One of the biggest barriers to fulfilling this vision is the complexity inherent in dealing with data trapped across silos in an enterprise. Google Data Cloud offers a unified, open, and intelligent platform for innovation, allowing you to integrate your data on a common architectural platform. Across industries, organizations are able to reimagine their data possibilities in entirely new ways and quickly build applications that delight their customers.
Siloed data: The barrier to speed and innovation
Digital technologies ranging from transaction processing to analytics and AI/ML use data to help enterprises understand their customers better. And the pace of innovation has naturally accelerated as organizations learn, adapt, and race to build the next generation of applications and services to compete for customers and meet their needs. At Next 2022, we made a prediction that the barriers between transactional and analytical workloads will mostly disappear.
Traditionally, data architectures have separated transactional and analytical systems—and that’s for good reason. Transactional databases are optimized for fast reads and writes, and analytical databases are optimized for analyzing and aggregating large data sets. This has siloed enterprise data systems, leaving many IT teams struggling to piece together solutions. The result has been time consuming, expensive, and complicated fixes to support intelligent, data-driven applications.
But, with the introduction of new technologies, a more time-efficient and cost-effective approach is possible. Customers now expect to see personalized recommendations and tailored experiences from their applications. With hybrid systems that support both transactional and analytical processing on the same data, without impacting performance, these systems now work together to generate timely, actionable insights that can be used to create better experiences and accelerate business outcomes.
According to a 2022 research paper from IDC, unifying data across silos via a data cloud is the foundational capability enterprises need to gain new insights on rapidly changing conditions and to enable operational intelligence. The modern data cloud provides unified, connected, scalable, secure, extensible, and open data, analytics, and AI/ML services. In this platform, everything is connected to everything else.
Why reducing data barriers delivers more value
The primary benefit of a unified data cloud is that it provides an intuitive and timely way to represent data and allows easy access to related data points. By unifying their data, enterprises are able to:
- Ingest data faster – for operational intelligence
- Unify data across silos – for new insights
- Share data with partners – for collaborative problem solving
- Change forecasting models – to understand and prepare for shifting markets
- Iterate with decision-making scenarios – to ensure agile responses
- Train models on historical data – to build smarter applications
As generative AI applications akin to Bard, an early experiment by Google, become available in the workplace, it will be more important than ever for organizations to have a unified data landscape to holistically train and validate their proprietary large language models.
With these benefits enterprises can accelerate their digital transformation in order to thrive in our increasingly complex digital environment. A survey of more than 800 IT leaders indicated that using a data cloud enabled them to significantly improve employee productivity, operational efficiency, innovation, and customer experience, among others.
Build modern apps with a unified and integrated data cloud
Google Cloud technologies and capabilities reduce the friction between transactional and analytical workloads and make it easier for developers to build applications, and to glean real-time insights. Here are a few examples.
- AlloyDB for PostgreSQL, a fully managed PostgreSQL-compatible database, and AlloyDB Omni, the recently launched downloadable edition of AlloyDB, can analyze transactional data in real time. AlloyDB is more than four times faster for transactional workloads and up to a 100 times faster for analytical queries compared to standard PostgreSQL, according to our performance tests. This kind of performance makes AlloyDB the ideal database for hybrid transactional and analytical processing (HTAP) workloads.
- Datastream for BigQuery, a serverless change data capture and replication service, provides simple and easy real time data replication from transactional databases like AlloyDB, PostgreSQL, MySQL and Oracle directly into BigQuery, Google Cloud’s enterprise data warehouse.
- And, query federation with Cloud Spanner, Cloud SQL, and Cloud Bigtable, make data available right from the BigQuery console allowing customers to analyze data in real-time in transactional databases.
Speed up deployments and lower costs
By reducing data barriers, we’re taking a fundamentally different approach that allows organizations to be more innovative, efficient, and customer-focused by providing:
- Built-in industry leading AI and ML that helps organizations not only build improved insights, but also automate core business processes and enable deep ML-driven product innovation.
- Best-in-class flexibility. Integration with open source standards and APIs ensures portability and extensibility to prevent lock-in. Plus, choice of deployment options means easy interoperability with existing solutions and investments.
- The most unified data platform with the ability to manage every stage of the data lifecycle, from running operational databases to managing analytics applications across data warehouses and lakes to rich data-driven experiences.
- Fully managed database services that free up DBA/DevOps time to focus on high-value work that is more profitable to the business. Organizations that switch from self-managed databases eliminate manual work, realize significant cost savings, reduce risk from security breaches and downtime and increase productivity and innovation. In an IDC survey, for example, Cloud SQL customers achieve an average three-year ROI of 246% because of the value and efficiencies this fully managed service delivers.
Google Data Cloud improves the efficiency and productivity of your teams, resulting in increased innovation across your organization. This is the unified, open approach to data-driven transformation bringing unmatched speed, scale, security, and with AI built in.
In case you missed it: Check out our Data Cloud and AI Summit that happened on March 29th, to learn more about the latest innovations across databases, data analytics, BI and AI. In addition, learn more about the value of managed database services like Cloud SQL in this IDC study.
10495
Of your peers have already watched this video.
2:15 Minutes
The most insightful time you'll spend today!
The True Story of How HotStar Broke a World-Record–Thanks to Firebase and Google BigQuery
Hotstar, India’s largest video streaming platform with 150 million monthly active users around the world, provides live-streaming of TV shows, movies, sports, and news on the go.
By using a combination of Firebase products together, Hotstar safely rolled out new features to its watch screen during a major live-streaming event without disrupting users, sacrificing stability, or releasing a new build. They also used Firebase with BigQuery to analyze their event data and reduce app startup time.
“We have an ambitious mission, but our engineering team is only a fraction of the size of most of our competitors. But we are still keeping up, and we are doing it with the help of Firebase,” says Ayushi Gupta, Android Engineer, Hotstar.
Gartner Magic Quadrant: Google Cloud a Leader in Operational DB Management Systems

4036
Of your peers have already read this article.
2:15 Minutes
The most insightful time you'll spend today!
We’re pleased to announce that Gartner has named Google Cloud a Leader in its 2019 Magic Quadrant report for Operational Database Management Systems (OPDBMS). This news reflects what we hear from our customers: that Google Cloud databases are flexible, open, and easy to use.
These include our fully compatible managed services for popular database engines like MySQL, PostgreSQL, SQL Server and Redis, and scalable cloud-native relational and non-relational databases like Cloud Spanner, Cloud Bigtable, and Cloud Firestore, plus fully managed partner services like MongoDB Atlas, Elastic, and Redis Enterprise. You can also run proprietary database workloads on Google Compute Engine or via our Bare Metal Solution.
Enterprises databases in production
We’ve heard great stories from our customers about their use of Google Cloud databases to run their businesses with ease and flexibility. Our database products meet varying needs for scalability and power.
Gaming company Bandai Namco Entertainment needed fast scalability, a global network, and real-time analytics to serve users its Dragon Ball Legends game. They were initially considering sharded MySQL to handle the scale, but opted for Cloud Spanner. Because it’s strongly consistent, fully managed, and scales seamlessly, Cloud Spanner supported the game’s rollout and allowed millions of worldwide players to compete without downtime.
And media leader The New York Times found our Cloud Firestore database service as they built a truly real-time collaboration tool that lets multiple writers and editors make changes in docs at the same time, keeping track of what’s newest. Cloud Firestore is designed for just this type of task, since it supports offline and real-time sync.
E-commerce brand analytics and protection company 3PM Solutions empowers global brands to manage, protect, and grow revenue by using Google Cloud Platform services such as Cloud Bigtable. Using Google Cloud, they’ve been able to analyze 160 million customer reviews of more than 2 million sellers in less than four hours.
Leanplum built its cloud-native marketing platform on Google Cloud to help marketers personalize and orchestrate cross-channel customer engagement campaigns at scale. “
We were looking for cost-effective cloud services that can reduce engineers’ overhead associated with managing infrastructure,” says Athena Koutsonikolos, Leanplum’s VP of marketing. “Using fully managed services like Cloud SQL, developers can now focus on building what matters to our customers.”
Gartner 2019 Magic Quadrant for Operational Database Management Systems – November 25, 2019, Merv Adrian, Donald Feinberg, Henry Cook.
Gartner does not endorse any vendor, product or service depicted in its research publications, and does not advise technology users to select only those vendors with the highest ratings or other designation. Gartner research publications consist of the opinions of Gartner’s research organization and should not be construed as statements of fact. Gartner disclaims all warranties, express or implied, with respect to this research, including any warranties of merchantability or fitness for a particular purpose.
How Google Cloud Solutions Help Retail Firms to ABP(Always Be Pivoting)

6391
Of your peers have already read this article.
2:00 Minutes
The most insightful time you'll spend today!
For years, retailers have been told that they must embrace a litany of new technologies, trends, and imperatives like online shopping, mobile apps, omnichannel, and digital transformation. In search of growth and stability, retailers adopted many of these, only to realize that for every box they ticked, there was another one waiting.
And then the pandemic hit, along with rising social movements and increasingly harsh weather. Some retailers were more prepared to take on these disruptions than others, which crystallized a new universal truth across the industry: the ability to adapt on the fly became the most important trait to survive and thrive.
Today’s retail landscape has surfaced both existing and new challenges for specialty and department store retailers. Approximately 88% of purchases previously occurred within a store environment. Now, it’s closer to 59%, with the remainder done online or through other omni methods.
With such constant change and upheaval, it can feel like the mantra now is ABP: always be pivoting.
The big question isn’t just how to maintain constant momentum and agility—it’s how to do it without sapping your workforce, your inventory, or your profits in the process. The pivot is now a given. What matters is how you do it.
Adapting requires a flexible base of technology that allows retailers to shift and scale seamlessly with the needs of the moment.
They need to be able to leverage real-time insights and enhance customer experiences rapidly, online and in the real world (not to mention the growing hybridization that’s AR and VR). They need to modernize their stores to power engaging consumer and associate experiences. They need to enhance operations for rapid scaling between full operations and digital-only offerings.
To help retailers achieve these goals and more, Google Cloud is honing a trio of essential innovations: demand forecasting that harnesses the power of data analytics and artificial intelligence; enhanced product discovery to improve conversion across channels; and the tools to help create the modern store experience.
In other words, here’s some of the biggest ways we’re ready to help you pivot.
Pivot point 1: Harnessing data and AI for demand forecasting with Vertex AI
One of the greatest challenges for retailers when building organizational flexibility is managing inventory and the supply chain.
We are in the midst of one of the worst global supply chain crises, stemming from soaring demand and logistics issues brought on by the pandemic. This crisis has only heightened the challenge retailers face when assessing demand and product availability. Even in normal times, mismanagement of inventory can add up to a trillion-dollar problem, according to IHL Group (costing $634 billion in lost sales worldwide each year, while overstocks result in $472 billion in lost revenues due to markdowns).
On the flipside, optimizing your supply chain can lead to greater profits. For instance, McKinsey predicts that a 10% to 20% improvement in retail supply chain forecasting accuracy is likely to produce a 5% reduction in inventory costs and a 2% to 3% increase in revenues.
Some of the challenges related to demand forecasting include:
- Low accuracy leads to excess inventory, missed sales, and pressure on fragile supply chains.
- Real drivers of product demand are not included, because large datasets are hard to model using traditional methods.
- Poor accuracy for new product launches and products that have sparse or intermittent demand.
- Complex models are hard to understand, leading to poor product allocation and low return on investment on promotions.
- Different departments use different methods, leading to miscommunication and costly reconciliation errors.
AI-based demand forecasting techniques can help. Vertex AI Forecast supports retailers in maintaining greater inventory flexibility by infusing machine learning into their existing systems. Machine learning and AI-based forecasting models like Vertex AI are able to digest large sets of disparate data, drive analytics and automatically adjust when provided with new information.
With these machine learning models, retailers can not only incorporate historical sales data, but also use close to real-time data such as marketing campaigns, web actions like a customer clicking the “add to cart” button on a website, local weather forecasts, and much more.
Pivot point 2: Enhanced product discovery through AI-powered search and recommendations
If customers can’t easily find what they are looking for, whether online or at the store, they will turn to someone else. That’s a simple statement, but one with profound impacts.
In research conducted by The Harris Poll and Google Cloud, we found that over a six month period, 95% of consumers received search results that were not relevant to what they were searching for on a retail website. And roughly 85% of consumers view a brand differently after an unsuccessful search, while 74% say they avoid websites where they’ve experienced search difficulties in the past.
Each year, retailers lose more than $300 billion dollars from search abandonment, or when a consumer searches for a product on a retailer’s website but does not find what they are looking for. Our product discovery solutions help you surface the right products, to the right customers, at the right time. These solutions include:
- Vision Product Search, which is like bringing the augmented reality of Google Lens to a retailer’s own branded mobile app experience. Both shoppers and retail store associates can search for products using an image they’ve photographed or found online and receive a ranked list of similar items.
- Recommendations AI, which enables retailers to deliver highly personalized recommendations at scale across channels.
- Retail Search, which provides Google-quality search results on a retailer’s own website and mobile applications.
All three are powered by Google Cloud, leveraging Google’s advanced understanding of user context and intent, utilizing technology to deliver a seamless experience to every shopper. With these combined capabilities, retailers are able to reduce search abandonment and improve conversions across their digital properties.
Pivot point 3: Building the modern store
Stores are no longer places for just browsing and buying. They must be flexible operation centers, ready to pivot to address changing circumstances. The modern store must be multiple things at once: a mini-fulfillment and return center, a recommendation engine, a shopping destination, a fun place to work, and more.
Just as retail companies had to embrace omnichannel, stores are now becoming omnichannel centers on their own, mixing the digital and physical into a single location. Retailers can use physical stores as a vehicle to deliver superior customer experiences. This will demand heightened levels of collaboration and cooperation between stores, digital, and tech infrastructure teams, building on the agile ways they have worked together.
In many ways, it’s about allowing our physical spaces to function more like digital ones. Google Cloud can help by bringing the scalability, security, and reliability of the cloud to the store, allowing physical locations to upgrade infrastructure and modernize their internal and customer-facing applications.
Think of it as when a new OS gets released for your phone. It’s the same small, hard box, but the experience can feel radically different. Now, extend that same idea to a digitally enabled store. With the right displays, interfaces, and tools at a given retail location, the team only needs to send an over-the-air update to create radically fresh experiences, ranging from sales displays to fulfillment or employee engagement.
Such an approach can enable streamlined experiences for both customers and store associates. For instance, when it comes to the modern store’s evolving role as a fulfillment or return center, cloud solutions can help drive efficiency in stores through automation of ordering, replenishment, and fulfillment of omnichannel order selection.
Similar tools for personalized product discovery online can be applied to customers in the store, helping them to browse and explore, or even create a tailored shopping experience.
The impact of store associates can be maximized by equipping them with technology to provide expertise that drives value-added customer service, as well as increasing productivity in stores by streamlining operations, thus lowering overhead cost. At the register, customers should be able to enjoy frictionless checkout while ensuring reliable, accurate, secure transactions.
Google Cloud can help retailers transform
The ability to adapt and pivot to meet today’s changing consumer needs requires that retailers rely on modern tools to obtain operational flexibility. We believe that every company can be a tech company. That every decision is data driven. That every store is physical and digital all at once. That every worker is a tech worker.
Google Cloud works with retailers to help them solve their most challenging problems. We have the unique ability to handle massive amounts of unstructured data, in addition to advanced capabilities in AI and ML. Our products and solutions help retailers focus on what’s most important—from improving operations to capturing digital and omnichannel revenue.
Scaling Ad Personalization with Bigtable

2989
Of your peers have already read this article.
2:30 Minutes
The most insightful time you'll spend today!
Cloud Bigtable is a popular and widely used key-value database available on Google Cloud. The service provides scale elasticity, cost efficiency, excellent performance characteristics, and 99.999% availability SLA. This has led to massive adoption with thousands of customers trusting Bigtable to run a variety of their mission-critical workloads.
Bigtable has been in continuous production usage at Google for more than 15 years now. It processes more than 5 billion requests per second at peak and has more than 10 exabytes of data under management. It’s one of the largest semi-structured data storage services at Google.
One of the key use cases for Bigtable at Google is ad personalization. This post describes the central role that Bigtable plays within ad personalization.
Ad personalization
Ad personalization aims to improve user experience by presenting topical and relevant ad content. For example, I often watch bread-making videos on YouTube. If ads personalization is enabled in my ad settings, my viewing history could indicate to YouTube that I’m interested in baking as a topic and would potentially be interested in ad content related to baking products.
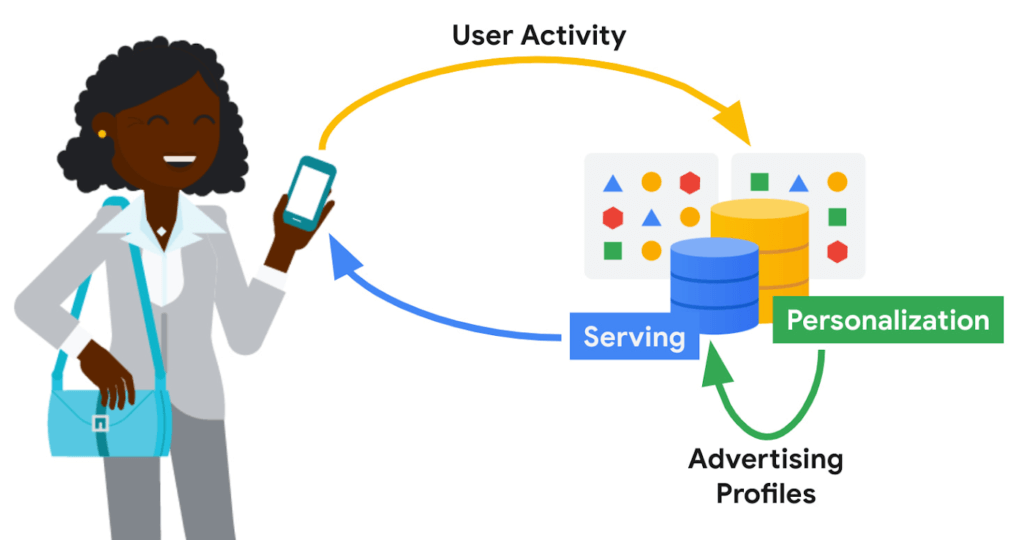
Ad personalization requires large-scale data processing in near real-time for timely personalization with strict controls for user data handling and retention. System availability needs to be high, and serving latencies need to be low due to the narrow window within which decisions need to be made on what ad content to retrieve and serve. Sub-optimal serving decisions (e.g. falling back to generic ad content) could potentially impact user experience. Ad economics requires infrastructure costs to be kept as low as possible.
Google’s ad personalization platform provides frameworks to develop and deploy machine learning models for relevance and ranking of ad content. The platform supports both real-time and batch personalization. The platform is built using Bigtable, allowing Google products to access data sources for ads personalization in a secure manner that is both privacy and policy compliant, all while honoring users’ decisions about what data they want to provide to Google
The output from personalization pipelines, such as advertising profiles are stored back in Bigtable for further consumption. The ad serving stack retrieves these advertising profiles to drive the next set of ad serving decisions.
Some of the storage requirements of the personalization platform include:
- Very high throughput access for batch and near real-time personalization
- Low latency (<20 ms at p99) lookup for reads on the critical path for ad serving
- Fast (i.e. in the order of seconds) incremental update of advertising models in order to reduce personalization delay
Bigtable
Bigtable’s versatility in supporting both low-cost, high-throughput access to data for offline personalization as well as consistent low-latency access for online data serving makes it an excellent fit for the ads workloads.
Personalization at Google-scale requires a very large storage footprint. Bigtable’s scalability, performance consistency and low cost required to meet a given performance curve are key differentiators for these workloads.
Data model
The personalization platform stores objects in Bigtable as serialized protobufs keyed by Object ids. Typical data sizes are less than 1 MB and serving latency is less than 20 ms at p99.
Data is organized as corpora, which correspond to distinct categories of data. A corpus maps to a replicated Bigtable.
Within a corpus, data is organized as DataTypes, logical groupings of data. Features, embeddings, and different flavors of advertising profiles are stored as DataTypes, which map to Bigtable column families. DataTypes are defined in schemas which describe the proto structure of the data and additional metadata indicating ownership and provenance. SubTypes map to Bigtable columns and are free-form.
Each row of data is uniquely identified by a RowID, which is based on the Object ID. The personalization API identifies individual values by RowID (row key), DataType (column family), SubType (column part), and Timestamp.
Consistency
The default consistency mode for operations is eventual. In this mode, data from the Bigtable replica nearest to the user is retrieved, providing the lowest median and tail latency.
Reads and writes to a single Bigtable replica are consistent. If there are multiple replicas of Bigtable in a region, traffic spillover across regions is more likely. To improve the likelihood of read-after-write consistency, the personalization platform uses a notion of row affinity. If there are multiple replicas in a region, one replica is preferentially selected for any given row, based on a hash of the Row ID.
For lookups with stricter consistency requirements, the platform first attempts to read from the nearest replica and requests that Bigtable return the current low watermark (LWM) for each replica. If the nearest replica happens to be the replica where the writes originated, or if the LWMs indicate that replication has caught up to the necessary timestamp, then the service returns a consistent response. If replication has not caught up, then the service issues a second lookup—this one targeted at the Bigtable replica where writes originated. That replica could be distant and the request could be slow. While waiting for a response, the platform may issue failover lookups to other replicas in case replication has caught up at those replicas.
Bigtable replication
The Ads personalization workloads use a Bigtable replication topology with more than 20 replicas, spread across four continents.
Replication helps address the high availability needs for ad serving. Bigtable’s zonal monthly uptime percentage is in excess of 99.9%, and replication coupled with a multi-cluster routing policy allows for availability in excess of 99.999%.
A globe-spanning topology allows for data placement that is close to users, minimizing serving latencies. However, it also comes with challenges such as variability in network link costs and throughputs. Bigtable uses Minimum Spanning Tree-based routing algorithms and bandwidth-conserving proxy replicas to help reduce network costs.
For ads personalization, reducing Bigtable replication delay is key to lowering the personalization delay (the time between a user’ action and when that action has been incorporated into advertising models to show more relevant ads to the user). Faster replication is preferred but we also need to balance serving traffic against replication traffic and make sure low-latency user-data serving is not disrupted due to incoming or outgoing replication traffic flows. Under the hood, Bigtable implements complex flow control and priority boost mechanisms to manage global traffic flows and to balance serving and replication traffic priorities.
Workload Isolation
Ad personalization batch workloads are isolated from serving workloads by pinning a given set of workloads onto certain replicas; some Bigtable replicas exclusively drive personalization pipelines while others drive user-data serving. This model allows for a continuous and near real-time feedback loop between serving systems and offline personalization pipelines, while protecting the two workloads from contending with each other.
For Cloud Bigtable users, AppProfiles and cluster-routing policies provide a way to confine and pin workloads to specific replicas to achieve coarse-grained isolation.
Data residency
By default, data is replicated to every replica—often spread out globally—which is wasteful for data that is only accessed regionally. Regionalization saves on storage and replication costs by confining data to the region where it is most likely to be accessed. Compliance with regulations mandating that data pertaining to certain subjects are physically stored within a given geographical area is also vital.
The location of data can be either implicitly determined by the access location of requests or through location metadata and other product signals. Once the location for a user is determined, it is stored in a location metadata table which points to the Bigtable replicas that read requests should be routed to. Migration of data based on row-placement policies happens in the background, without downtime or serving performance regressions.
Conclusion
In this blog post, we looked at how Bigtable is used within Google to support an important use case—modeling user intent for ad personalization.
Over the past decade, Bigtable has scaled as Google’s personalization needs have scaled by orders of magnitude. For large-scale personalization workloads, Bigtable offers low cost storage with excellent performance characteristics. It seamlessly handles global traffic flows with simple user configurations. Its ease at handling both low-latency serving and high-throughput batch computations make it an excellent option for lambda-style data processing pipelines.
We continue to drive high levels of investment to further lower costs, improve performance, and bring new features to make Bigtable an even better choice for personalization workloads.
Learn more
To get started with Bigtable, try it out with a Qwiklab and learn more about the product here.
Acknowledgements
We’d like to thank Ashish Awasthi, Ashish Chopra, Jay Wylie, Phaneendhar Vemuru, Bora Beran, Elijah Lawal, Sean Rhee and other Googlers for their valuable feedback and suggestions.
New Capabilities in BigQuery to Ease Anomalies Detection in the Absence of Labeled Data

6315
Of your peers have already read this article.
4:00 Minutes
The most insightful time you'll spend today!
When it comes to anomaly detection, one of the key challenges that many organizations face is that it can be difficult to know how to define what an anomaly is. How do you define and anticipate unusual network intrusions, manufacturing defects, or insurance fraud? If you have labeled data with known anomalies, then you can choose from a variety of supervised machine learning model types that are already supported in BigQuery ML. But what can you do if you don’t know what kind of anomaly to expect, and you don’t have labeled data? Unlike typical predictive techniques that leverage supervised learning, organizations may need to be able to detect anomalies in the absence of labeled data.
Today we are announcing the public preview of new anomaly detection capabilities in BigQuery ML that leverage unsupervised machine learning to help you detect anomalies without needing labeled data. Depending on whether or not the training data is time series, users can now detect anomalies in training data or on new input data using a new ML.DETECT_ANOMALIES function (documentation), with the following models:
- Autoencoder model, now in Public Preview (documentation)
- K-means model, already GA (documentation)
- ARIMA_PLUS time series model, already GA (documentation)
How does anomaly detection with ML.DETECT_ANOMALIES work?
To detect anomalies in non-time-series data, you can use:
- K-means clustering models: When you use
ML.DETECT_ANOMALIESwith a k-means model, anomalies are identified based on the value of each input data point’s normalized distance to its nearest cluster. If that distance exceeds a threshold determined by the contamination value provided by the user, the data point is identified as an anomaly. - Autoencoder models: When you use
ML.DETECT_ANOMALIESwith an autoencoder model, anomalies are identified based on the reconstruction error for each data point. If the error exceeds a threshold determined by the contamination value, it is identified as an anomaly.
To detect anomalies in time-series data, you can use:
- ARIMA_PLUS time series models: When you use
ML.DETECT_ANOMALIESwith an ARIMA_PLUS model, anomalies are identified based on the confidence interval for that timestamp. If the probability that the data point at that timestamp occurs outside of the prediction interval exceeds a probability threshold provided by the user, the datapoint is identified as an anomaly.
Below we show code examples of anomaly detection in BigQuery ML for each of the above scenarios.
Anomaly detection with a k-means clustering model
You can now detect anomalies using k-means clustering models, by running ML.DETECT_ANOMALIES to detect anomalies in the training data or in new input data. Begin by creating a k-means clustering model:
Language: SQL
CREATE MODEL `mydataset.my_kmeans_model`OPTIONS(MODEL_TYPE = 'kmeans',NUM_CLUSTERS = 8,KMEANS_INIT_METHOD = 'kmeans++') ASSELECT* EXCEPT(Time, Class)FROM`bigquery-public-data.ml_datasets.ulb_fraud_detection`;
With the k-means clustering model trained, you can now run ML.DETECT_ANOMALIES to detect anomalies in the training data or in new input data.
To detect anomalies in the training data, use ML.DETECT_ANOMALIES with the same data used during training:
Language: SQL
SELECT*FROMML.DETECT_ANOMALIES(MODEL `mydataset.my_kmeans_model`,STRUCT(0.02 AS contamination),TABLE `bigquery-public-data.ml_datasets.ulb_fraud_detection`);

To detect anomalies in new data, use ML.DETECT_ANOMALIES and provide new data as input:
Language: SQL
SELECT*FROMML.DETECT_ANOMALIES(MODEL `mydataset.my_kmeans_model`,STRUCT(0.02 AS contamination),(SELECT * FROM `mydataset.newdata`));

How does anomaly detection work for k-means clustering models?
Anomalies are identified based on the value of each input data point’s normalized distance to its nearest cluster, which, if exceeds a threshold determined by the contamination value, is identified as an anomaly. How does this work exactly? With a k-means model and data as inputs, ML.DETECT_ANOMALIES first computes the absolute distance for each input data point to all cluster centroids in the model, then normalizes each distance by the respective cluster radius (which is defined as the standard deviation of the absolute distances of all points in this cluster to the centroid). For each data point, ML.DETECT_ANOMALIES returns the nearest centroid_id based on normalized_distance, as seen in the screenshot above. The contamination value, specified by the user, determines the threshold of whether a data point is considered an anomaly. For example, a contamination value of 0.1 means that the top 10% of descending normalized distance from the training data will be used as the cut-off threshold. If the normalized distance for a datapoint exceeds the threshold, then it is identified as an anomaly. Setting an appropriate contamination will be highly dependent on the requirements of the user or business.
For more information on anomaly detection with k-means clustering, please see the documentation here.
Anomaly detection with an autoencoder model
You can now detect anomalies using autoencoder models, by running ML.DETECT_ANOMALIES to detect anomalies in the training data or in new input data.
Begin by creating an autoencoder model:
Language: SQL
CREATE MODEL `mydataset.my_autoencoder_model`OPTIONS(model_type='autoencoder',activation_fn='relu',batch_size=8,dropout=0.2,hidden_units=[32, 16, 4, 16, 32],learn_rate=0.001,l1_reg_activation=0.0001,max_iterations=10,optimizer='adam') ASSELECT* EXCEPT(Time, Class)FROM`bigquery-public-data.ml_datasets.ulb_fraud_detection`;
To detect anomalies in the training data, use ML.DETECT_ANOMALIES with the same data used during training:
Language: SQL
SELECT*FROMML.DETECT_ANOMALIES(MODEL `mydataset.my_autoencoder_model`,STRUCT(0.02 AS contamination),TABLE `bigquery-public-data.ml_datasets.ulb_fraud_detection`);

To detect anomalies in new data, use ML.DETECT_ANOMALIES and provide new data as input:
Language: SQL
SELECT*FROMML.DETECT_ANOMALIES(MODEL `mydataset.my_autoencoder_model`,STRUCT(0.02 AS contamination),(SELECT * FROM `mydataset.newdata`));

How does anomaly detection work for autoencoder models?
Anomalies are identified based on the value of each input data point’s reconstructed error, which, if exceeds a threshold determined by the contamination value, is identified as an anomaly. How does this work exactly? With an autoencoder model and data as inputs, ML.DETECT_ANOMALIES first computes the mean_squared_error for each data point between its original values and its reconstructed values. The contamination value, specified by the user, determines the threshold of whether a data point is considered an anomaly. For example, a contamination value of 0.1 means that the top 10% of descending error from the training data will be used as the cut-off threshold. Setting an appropriate contamination will be highly dependent on the requirements of the user or business.
For more information on anomaly detection with autoencoder models, please see the documentation here.
Anomaly detection with an ARIMA_PLUS time-series model

With ML.DETECT_ANOMALIES, you can now detect anomalies using ARIMA_PLUS time series models in the (historical) training data or in new input data. Here are some examples of when might you want to detect anomalies with time-series data:
Detecting anomalies in historical data:
- Cleaning up data for forecasting and modeling purposes, e.g. preprocessing historical time series before using them to train an ML model.
- When you have a large number of retail demand time series (thousands of products across hundreds of stores or zip codes), you may want to quickly identify which stores and product categories had anomalous sales patterns, and then perform a deeper analysis of why that was the case.
Forward looking anomaly detection:
- Detecting consumer behavior and pricing anomalies as early as possible: e.g. if traffic to a specific product page suddenly and unexpectedly spikes, it might be because of an error in the pricing process that leads to an unusually low price.
- When you have a large number of retail demand time series (thousands of products across hundreds of stores or zip codes), you would like to identify which stores and product categories had anomalous sales patterns based on your forecasts, so you can quickly respond to any unexpected spikes or dips.
How do you detect anomalies using ARIMA_PLUS? Begin by creating an ARIMA_PLUS time series model:
Language: SQL
CREATE OR REPLACE MODEL mydataset.my_arima_plus_modelOPTIONS(MODEL_TYPE='ARIMA_PLUS',TIME_SERIES_TIMESTAMP_COL='date',TIME_SERIES_DATA_COL='total_amount_sold',TIME_SERIES_ID_COL='item_name',HOLIDAY_REGION='US') ASSELECTdate,item_description AS item_name,SUM(bottles_sold) AS total_amount_soldFROM`bigquery-public-data.iowa_liquor_sales.sales`GROUP BYdate,item_nameHAVINGdate BETWEEN DATE('2016-01-04') AND DATE('2017-06-01')AND item_name IN ("Black Velvet", "Captain Morgan Spiced Rum","Hawkeye Vodka", "Five O'Clock Vodka", "Fireball Cinnamon Whiskey");
To detect anomalies in the training data, use ML.DETECT_ANOMALIES with the model obtained above:
Language: SQL
SELECT*FROMML.DETECT_ANOMALIES(MODEL `mydataset.my_arima_plus_model`,STRUCT(0.8 AS anomaly_prob_threshold));

To detect anomalies in new data, use ML.DETECT_ANOMALIES and provide new data as input:
Language: SQL
WITHnew_data AS (SELECTdate,item_description AS item_name,SUM(bottles_sold) AS total_amount_soldFROM`bigquery-public-data.iowa_liquor_sales.sales`GROUP BYdate,item_nameHAVINGdate BETWEEN DATE('2017-06-02')AND DATE('2017-10-01')AND item_name IN ('Black Velvet','Captain Morgan Spiced Rum','Hawkeye Vodka',"Five O'Clock Vodka",'Fireball Cinnamon Whiskey') )SELECT*FROMML.DETECT_ANOMALIES(MODEL `mydataset.my_arima_plus_model`,STRUCT(0.8 AS anomaly_prob_threshold),(SELECT*FROMnew_data));

For more information on anomaly detection with ARIMA_PLUS time series models, please see the documentation here.
Thanks to the BigQuery ML team, especially Abhinav Khushraj, Abhishek Kashyap, Amir Hormati, Jerry Ye, Xi Cheng, Skander Hannachi, Steve Walker, and Stephanie Wang.
More Relevant Stories for Your Company

Making Mothers’ Day Special: How Google Cloud Migration for 1-800-FLOWERS.COM, Inc Impacts CX
Editor’s note: In honor of Mother’s Day, we look at how 1-800-FLOWERS.COM, Inc. migrated to Google Cloud as part of its digital transformation to quickly deploy seamless and convenient customer experiences across multiple brands on Mother’s Day and every day. As a leading provider of gifts designed to help customers

How Connected-Stories Uses BigQuery and AI/ML to Craft Personalized Ad Experiences
Editor’s note: The post is part of a series highlighting our awesome partners, and their solutions, that are Built with BigQuery In the field of producing engaging video content such as ads, many marketers ignore the power of data to improve their creative efforts to meet the consumers' need for

Simplifying Unstructured Data Analytics with BigQuery ML and Vertex AI: A Comprehensive Guide
Unstructured data such as images, speech and textual data can be notoriously difficult to manage, and even harder to analyze. The analysis of unstructured data includes use cases such as extracting text from images using OCR, sentiment analysis on customer reviews and simplifying translation for analytics. All of this data

IT Team Figures Out Easiest Way to Build Data Pipelines and Create ML Models
Building a strong brand in today's hyper-competitive business environment takes vision. It also requires a flexible, easily managed approach to digital asset management (DAM), so marketing professionals and other stakeholders can easily share, store, track, and manipulate assets to build the brand. Many of today's leading companies, including JetBlue, Slack,
