





Vodafone Leverages Google Cloud to Aid COVID-19 Frontline with Anonymized Insights on Population Mobility

11169
Of your peers have already read this article.
1:30 Minutes
The most insightful time you'll spend today!
Editor’s note: When Europe’s largest mobile communications company, Vodafone, was asked by the European Commission to help understand population movement across the European Union and the UK to help fight COVID-19, it was able to provide anonymized mobile network-based insights to answer the call. Here’s how Vodafone, with the support of Google Cloud, rapidly mobilized the COVID-19 frontline, while respecting its customers’ privacy.
With the emergence of COVID-19 in early 2020, the European Commission—the executive branch of the European Union (EU)—knew that technology would be instrumental in its fight to control the pandemic. With various lockdowns imposed across its member states, the Commission was keen to predict and prevent the spread of COVID-19 and to manage the related social, political and financial impacts.
Mobile network data helps track COVID-19 across the EU
Mobile networks produce location data, which can be turned into useful anonymous insights to understand population movement within a geographic area. The European Commission, working with mobile industry association GSMA (Groupe Speciale Mobile Association), asked Europe’s major mobile phone operators for help in producing insights to support the fight against COVID-19. As the largest mobile network operator within the EU, Vodafone saw this as a critical opportunity to participate.
Vodafone had previous experience of using mobile network data to support pandemic research. For example, in 2019, Vodafone provided mobility pattern analysis to help track the spread of Malaria in Mozambique. And, during the early stages of the COVID-19 pandemic (prior to working with the European Commission), Vodafone assisted the Italian and Spanish governments in understanding their citizens’ mobility patterns. Vodafone had also previously offered anonymized and aggregated population mobility insights to support public transport and tourism authorities and retail organizations in a number of countries. Consequently, Vodafone was perfectly placed to play a greater role in supporting the European Commission’s response to the pandemic.
When asked to assist the European Commission, Vodafone first considered how it could safely share its data with the governing body without providing details on the individual movements of its customers. It realized it could achieve this through an elaborate set of anonymization and aggregation techniques. Insights are aggregated from a minimum of 50 users and Vodafone only shared these anonymous insights and never the actual raw data with the Commission. As specified by the EU, these insights are then presented onto a large geographical region, typically a city or a county with thousands of people living in that area.
These insights illustrate how people move, helping to determine how lockdowns and self-isolation measures were impacting behaviors.
Using Google Cloud to collate and store population mobility data
In April 2020, Vodafone began migrating its operations, including its mobile data, to Google Cloud on servers in Europe and the UK with elaborate security safeguards, including encryption, building on a previous partnership.
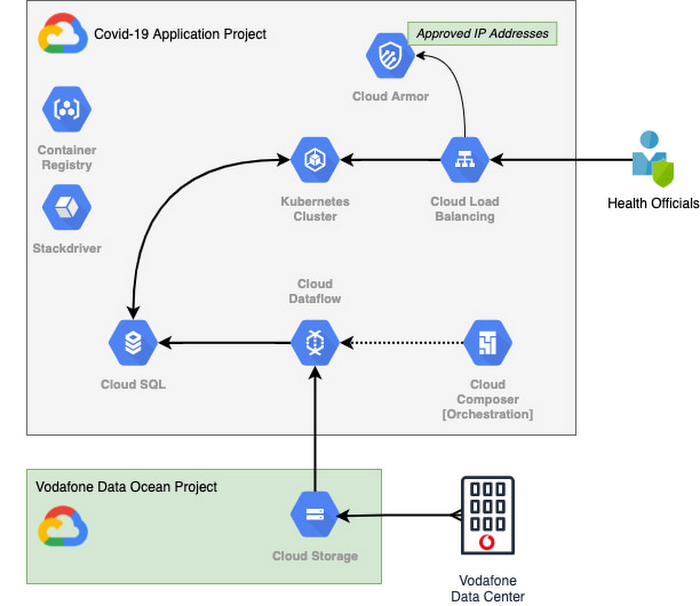
With the data residing in EU and UK data centers and not the United States, Vodafone could then retrieve anonymous insights from Google Cloud Storage instantaneously. Before supplying any information to the European Commission, however, Vodafone used Dataflow to validate the data and run a series of tests to ensure the database had accurate data, before ingesting and archiving the relevant metrics. For instant access, the data was then made available to the European Commission using a Redis database on Google Kubernetes Engine.
To ensure aggregate Vodafone customer data was always safe, secure, and anonymous, all entry points to the front-end were protected behind Google Cloud Armor, where only specific IP addresses were allowed. Using these tools, seamless data pipelines fed in predefined key performance indicators from each specified European market. While data quality measures ensured the definitions for metrics across markets were consistent and could be accurately compared.
The architecture (pictured below) shows how Vodafone integrated and anonymized its data on Google Cloud.
Live interactive dashboard shows population mobility in real-time
With its data integrated on Google Cloud, Vodafone created a live, interactive dashboard to track mobility patterns and share relevant information with the European Commission in real-time.
The European Commission Joint Research Center (JRC) was able to gather valuable information from these insights, which enabled them to see where population mobility was aiding the spread of the disease, when cross-referenced with health data. It could also assess the implications of lockdowns on different populations and forecast cross-country spreading.
Mobile data aids disease modeling for multiple stakeholders
The Vodafone data became instrumental in modeling the likely course of the disease too. For example, the University of Southampton in the UK used it to predict the outcome of different coordinated COVID-19 exit strategies across Europe. This research was published in Science Magazine in September 2020.
The Vodafone data dashboard continues to be used by individual governments, NGOs and organizations to further investigate the impacts of the pandemic and to measure the effectiveness of response strategies alongside the rollout of vaccination programs. The project also helped Vodafone win a DataIQ award for most effective stakeholder engagement.
Using the learnings from this project, Vodafone has been able to adapt its own B2B solution, called Vodafone Analytics, by adaptIng and migrating the code to work in Google Cloud Platform. This solution has been rolled out across Germany, Greece, Portugal and South Africa, and new countries are being onboarded every day. Vodafone Analytics already has more than 100 customers leveraging it for a variety of use cases—Italian fashion retailer OVS, uses it for its smart retail operation, while global real estate company, JLL, uses it to understand the footfall passing through its properties.
Working together, Vodafone and Google Cloud continue to help a range of organizations, governments, and NGOs navigate through the ongoing pandemic, optimize their operations, and help the greater good, without infringing individuals’ fundamental rights to privacy.
To learn more about Google Cloud and Vodafone, watch our full interview here.
Harnessing the Power of Data and AI to Transform Life Science Supply Chains

3965
Of your peers have already read this article.
3:30 Minutes
The most insightful time you'll spend today!
Global life science supply chains are lengthy and complex with many moving parts. One small disruption can create serious delays and affect your ability to deliver therapeutics for patients.
Supply chain disruptors
Over the last few years, healthcare organizations have encountered a range of obstacles, from both internal and external factors, that have resulted in supply networks failing to get drugs and medical devices to where they need to be on time. These obstacles include:
- Labor and supply shortages
- Rising material costs
- Raw material constraints
- Geo-political events
- Unpredictable weather
How do you overcome supply chain disruptors that are out of your control?
The intelligent healthcare supply chain
While many organizations have already implemented data-driven supply chains, organizations are still faced with the challenges of static, siloed, and different functional supply chain applications; limited data exchange with key trading partners across upstream and downstream operations; and the inability to effectively leverage relevant external data.
At Google Cloud, we believe the key to meaningful and effective change is a data-driven supply chain that allows you to achieve visibility, flexibility, and innovation.
Our solutions help you prepare for the unpredictable and enhance the value of your data. By unlocking AI-driven insights, you can strengthen distribution networks and optimize your workflows and supply chains to become more reliable, intelligent, and sustainable. Some of the business challenges we address include:
- Predicting demand with Vertex AI Forecast
- Visual inspection for quality and predictive maintenance with pre-built ML models
- Automating and optimizing pickup and delivery operations with Cloud Fleet Routing API
- Real time and holistic inventory visibility with Supply Chain Twin
Make sure you’re prepared for the unpredictable with real-time visibility over your distribution networks. Learn how you can harness the power of AI and analytics and gain actionable insights that enhance your supply chain.
10145
Of your peers have already watched this video.
1:00 Minutes
The most insightful time you'll spend today!
Predict User Churn on Gaming Apps with Google Analytics Data using BigQuery ML
User retention can be a major challenge for mobile game developers. According to the Mobile Gaming Industry Analysis in 2019, most mobile games only see a 25% retention rate for users after the first day. To retain a larger percentage of users after their first use of an app, developers can take steps to motivate and incentivize certain users to return. But to do so, developers need to identify the propensity of any specific user returning after the first 24 hours.
In this blog post, we will discuss how you can use BigQuery ML to run propensity models on Google Analytics 4 data from your gaming app to determine the likelihood of specific users returning to your app.
You can also use the same end-to-end solution approach in other types of apps using Google Analytics for Firebase as well as apps and websites using Google Analytics 4. To try out the steps in this blogpost or to implement the solution for your own data, you can use this Jupyter Notebook.
Using this blog post and the accompanying Jupyter Notebook, you’ll learn how to:
- Explore the BigQuery export dataset for Google Analytics 4
- Prepare the training data using demographic and behavioural attributes
- Train propensity models using BigQuery ML
- Evaluate BigQuery ML models
- Make predictions using the BigQuery ML models
- Implement model insights in practical implementations
Google Analytics 4 (GA4) properties unify app and website measurement on a single platform and are now default in Google Analytics. Any business that wants to measure their website, app, or both, can use GA4 for a more complete view of how customers engage with their business. With the launch of Google Analytics 4, BigQuery export of Google Analytics data is now available to all users. If you are already using a Google Analytics 4 property, you can follow this guide to set up exporting your GA data to BigQuery.
Once you have set up the BigQuery export, you can explore the data in BigQuery. Google Analytics 4 uses an event-based measurement model. Each row in the data is an event with additional parameters and properties. The Schema for BigQuery Export can help you to understand the structure of the data.
In this blogpost, we use the public sample export data from an actual mobile game app called “Flood It!” (Android, iOS) to build a churn prediction model. But you can use data from your own app or website.
Here’s what the data looks like. Each row in the dataset is a unique event, which can contain nested fields for event parameters.
SELECT *FROM `firebase-public-project.analytics_153293282.events_*`TABLESAMPLE SYSTEM (1 PERCENT)

This dataset contains 5.7M events from over 15k users.
SELECTCOUNT(DISTINCT user_pseudo_id) as count_distinct_users,COUNT(event_timestamp) as count_eventsFROM`firebase-public-project.analytics_153293282.events_*

Our goal is to use BigQuery ML on the sample app dataset to predict propensity to user churn or not churn based on users’ demographics and activities within the first 24 hours of app installation.

In the following sections, we’ll cover how to:
- Pre-process the raw event data from GA4
- Identify users & the label feature
- Process demographic features
- Process behavioral features
- Train classification model using BigQuery ML
- Evaluate the model using BigQueryML
- Make predictions using BigQuery ML
- Utilize predictions for activation
Pre-process the raw event data
You cannot simply use raw event data to train a machine learning model as it would not be in the right shape and format to use as training data. So in this section, we’ll go through how to pre-process the raw data into an appropriate format to use as training data for classification models.
This is what the training data should look like for our use case at the end of this section:

Notice that in this training data, each row represents a unique user with a distinct user ID (user_pseudo_id).
Identify users & the label feature
We first filtered the dataset to remove users who were unlikely to return the app anyway. We defined these ‘bounced’ users as ones who spent less than 10 mins with the app. Then we labeled all remaining users:
- churned: No event data for the user after 24 hours of first engaging with the app.
- returned: The user has at least one event record after 24 hours of first engaging with the app.
For your use case, you can have a different definition of bounce and churning. Also you can even try to predict something else other than churning, e.g.:
- whether a user is likely to spend money on in-game currency
- likelihood of completing n-number of game levels
- likelihood of spending n amount of time in-game etc.
In such cases, label each record accordingly so that whatever you are trying to predict can be identified from the label column.
From our dataset, we found that ~41% users (5,557) bounced. However, from the remaining users (8,031), ~23% (1,883) churned after 24 hours:
SELECTbounced,churned,COUNT(churned) as count_usersFROMbqmlga4.returningusersGROUP BY 1,2ORDER BY bounced

To create these bounced and churned columns, we used the following snippet of SQL code.
...#churned = 1 if last_touch within 24 hr of app installation, else 0IF (user_last_engagement < TIMESTAMP_ADD(user_first_engagement,INTERVAL 24 HOUR),1,0 ) AS churned,#bounced = 1 if last_touch within 10 min, else 0IF (user_last_engagement <= TIMESTAMP_ADD(user_first_engagement,INTERVAL 10 MINUTE),1,0 ) AS bounced,...
You can view the Jupyter Notebook for the full query used for materializing the bounced and churned labels.
Process demographic features
Next, we added features both for demographic data and for behavioral data spanning across multiple columns. Having a combination of both demographic data and behavioral data helps to create a more predictive model.
We used the following fields for each user as demographic features:
geo.countrydevice.operating_systemdevice.language
A user might have multiple unique values in these fields — for example if a user uses the app from two different devices. To simplify, we used the values from the very first user engagement event.
CREATE OR REPLACE VIEW bqmlga4.user_demographics AS (WITH first_values AS (SELECTuser_pseudo_id,geo.country as country,device.operating_system as operating_system,device.language as language,ROW_NUMBER() OVER (PARTITION BY user_pseudo_id ORDER BY event_timestamp DESC) AS row_numFROM `firebase-public-project.analytics_153293282.events_*`WHERE event_name="user_engagement")SELECT * EXCEPT (row_num)FROM first_valuesWHERE row_num = 1 #first engagement);
Process behavioral features
There is additional demographic information present in the GA4 export dataset, e.g. app_info, device, event_params, geo etc. You may also send demographic information to Google Analytics through each hit via user_properties. Furthermore, if you have first-party data on your own system, you can join that with the GA4 export data based on user_ids.
To extract user behavior from the data, we looked into the user’s activities within the first 24 hours of first user engagement. In addition to the events automatically collected by Google Analytics, there are also the recommended events for games that can be explored to analyze user behavior. For our use case, to predict user churn, we counted the number of times the follow events were collected for a user within 24 hours of first user engagement:
user_engagementlevel_start_quickplaylevel_end_quickplaylevel_complete_quickplaylevel_reset_quickplaypost_scorespend_virtual_currencyad_rewardchallenge_a_friendcompleted_5_levelsuse_extra_steps
The following query shows how these features were calculated:
WITHevents_first24hr AS (SELECTe.*FROM`firebase-public-project.analytics_153293282.events_*` eJOINbqmlga4.returningusers rONe.user_pseudo_id = r.user_pseudo_idWHERETIMESTAMP_MICROS(e.event_timestamp) <= r.ts_24hr_after_first_engagement)SELECTuser_pseudo_id,SUM(IF(event_name = 'user_engagement', 1, 0)) AS cnt_user_engagement,# ... repeated for all behavior data ...SUM(IF(event_name = 'use_extra_steps', 1, 0)) AS cnt_use_extra_steps,FROMevents_first24hrGROUP BY1
View the notebook for the query used to aggregate and extract the behavioral data. You can use different sets of events for your use case. To view the complete list of events, use the following query:
SELECTevent_name,COUNT(event_name) as event_countFROM`firebase-public-project.analytics_153293282.events_*`GROUP BY 1ORDER BYevent_count DESC
After this we combined the features to ensure our training dataset reflects the intended structure. We had the following columns in our table:
- User ID:
user_pseudo_id
- Label:
churned
- Demographic features
countrydevice_osdevice_language
- Behavioral features
cnt_user_engagementcnt_level_start_quickplaycnt_level_end_quickplaycnt_level_complete_quickplaycnt_level_reset_quickplaycnt_post_scorecnt_spend_virtual_currencycnt_ad_rewardcnt_challenge_a_friendcnt_completed_5_levelscnt_use_extra_stepsuser_first_engagement
At this point, the dataset was ready to train the classification machine learning model in BigQuery ML. Once trained, the model will output a propensity score between churn (churned=1) or return (churned=0) indicating the probability of a user churning based on the training data.
Train classification model
When using the CREATE MODEL statement, BigQuery ML automatically splits the data between training and test. Thus the model can be evaluated immediately after training (see the documentation for more information).
For the ML model, we can choose among the following classification algorithms where each type has its own pros and cons:

Often logistic regression is used as a starting point because it is the fastest to train. The query below shows how we trained the logistic regression classification models in BigQuery ML.
CREATE OR REPLACE MODEL bqmlga4.churn_logregTRANSFORM(EXTRACT(MONTH from user_first_engagement) as month,EXTRACT(DAYOFYEAR from user_first_engagement) as julianday,EXTRACT(DAYOFWEEK from user_first_engagement) as dayofweek,EXTRACT(HOUR from user_first_engagement) as hour,* EXCEPT(user_first_engagement, user_pseudo_id))OPTIONS(MODEL_TYPE="LOGISTIC_REG",INPUT_LABEL_COLS=["churned"]) ASSELECT*FROMbqmlga4.train
We extracted month, julianday, and dayofweek from datetimes/timestamps as one simple example of additional feature preprocessing before training. Using TRANSFORM() in your CREATE MODEL query allows the model to remember the extracted values. Thus, when making predictions using the model later on, these values won’t have to be extracted again. View the notebook for the example queries to train other types of models (XGBoost, deep neural network, AutoML Tables).
Evaluate model
Once the model finished training, we ran ML.EVALUATE to generate precision, recall, accuracy and f1_score for the model:
SELECT*FROMML.EVALUATE(MODEL bqmlga4.churn_logreg)

The optional THRESHOLD parameter can be used to modify the default classification threshold of 0.5. For more information on these metrics, you can read through the definitions on precision and recall, accuracy, f1-score, log_loss and roc_auc. Comparing the resulting evaluation metrics can help to decide among multiple models.Furthermore, we used a confusion matrix to inspect how well the model predicted the labels, compared to the actual labels. The confusion matrix is created using the default threshold of 0.5, which you may want to adjust to optimize for recall, precision, or a balance (more information here).
SELECTexpected_label,_0 AS predicted_0,_1 AS predicted_1FROMML.CONFUSION_MATRIX(MODEL bqmlga4.churn_logreg)

This table can be interpreted in the following way:

Make predictions using BigQuery ML
Once the ideal model was available, we ran ML.PREDICT to make predictions. For propensity modeling, the most important output is the probability of a behavior occurring. The following query returns the probability that the user will return after 24 hrs. The higher the probability and closer it is to 1, the more likely the user is predicted to return, and the closer it is to 0, the more likely the user is predicted to churn.
SELECTuser_pseudo_id,returned,predicted_returned,predicted_returned_probs[OFFSET(0)].prob as probability_returnedFROMML.PREDICT(MODEL bqmlga4.churn_logreg,(SELECT * FROM bqmlga4.train)) #can be replaced with a proper test dataset
Utilize predictions for activation
Once the model predictions are available for your users, you can activate this insight in different ways. In our analysis, we used user_pseudo_id as the user identifier. However, ideally, your app should send back the user_id from your app to Google Analytics. In addition to using first-party data for model predictions, this will also let you join back the predictions from the model into your own data.
- You can import the model predictions back into Google Analytics as a user attribute. This can be done using the Data Import feature for Google Analytics 4. Based on the prediction values you can Create and edit audiences and also do Audience targeting. For example, an audience can be users with prediction probability between 0.4 and 0.7, to represent users who are predicted to be “on the fence” between churning and returning.
- For Firebase Apps, you can use the Import segments feature. You can tailor user experience by targeting your identified users through Firebase services such as Remote Config, Cloud Messaging, and In-App Messaging. This will involve importing the segment data from BigQuery into Firebase. After that you can send notifications to the users, configure the app for them, or follow the user journeys across devices.
- Run targeted marketing campaigns via CRMs like Salesforce, e.g. send out reminder emails.
You can find all of the code used in this blogpost in the Github repository:
What’s next?
Continuous model evaluation and re-training
As you collect more data from your users, you may want to regularly evaluate your model on fresh data and re-train the model if you notice that the model quality is decaying.
Continuous evaluation—the process of ensuring a production machine learning model is still performing well on new data—is an essential part in any ML workflow. Performing continuous evaluation can help you catch model drift, a phenomenon that occurs when the data used to train your model no longer reflects the current environment.
To learn more about how to do continuous model evaluation and re-train models, you can read the blogpost: Continuous model evaluation with BigQuery ML, Stored Procedures, and Cloud Scheduler
More resources
If you’d like to learn more about any of the topics covered in this post, check out these resources:
- BigQuery export of Google Analytics data
- BigQuery ML quickstart
- Events automatically collected by Google Analytics 4
- Qwiklabs: Create ML models with BigQuery ML
Or learn more about how you can use BigQuery ML to easily build other machine learning solutions:
- How to build demand forecasting models with BigQuery ML
- How to build a recommendation system on e-commerce data using BigQuery ML
Let us know what you thought of this post, and if you have topics you’d like to see covered in the future! You can find us on Twitter at @polonglin and @_mkazi_.Thanks to reviewers: Abhishek Kashyap, Breen Baker, David Sabater Dinter.
Volkswagen + Google Cloud: Using Machine Learning to Drive Smarter with Energy Efficient Cars
2662
Of your peers have already read this article.
2:30 Minutes
The most insightful time you'll spend today!
Volkswagen strives to design beautiful, performant, and energy efficient vehicles. This entails an iterative process where designers go through many design drafts, evaluating each, integrating the feedback, and refining.
For example, a vehicle’s drag coefficient—its resistance to air—is one of the most important factors of energy efficiency. Thus, getting estimates of the drag coefficient for several designs helps the designers experiment and converge toward more energy-efficient solutions. The cheaper and faster this feedback loop is, the more it enables the designers.
Unfortunately, estimating drag coefficient is an expensive and time-consuming operation that involves either a physical wind tunnel or a computationally intensive simulation. This can be a bottleneck in the feedback cycle.
For this reason, Volkswagen and Google Cloud decided to collaborate on a joint research project to investigate using machine learning (ML) to get fast and inexpensive estimates of the drag coefficient. In this post, we’ll explore the challenges and approaches undertaken in this project.
The core principles of the project were simple. First, we needed to collect a dataset of existing car designs and their respective drag coefficients. Then, we needed to create a representation of the various cars that would be suitable for ML. The next step was to train a deep learning model to predict the drag coefficient, and then, finally, we would use that model to efficiently estimate drag for any new design.
Representing three-dimensional car designs
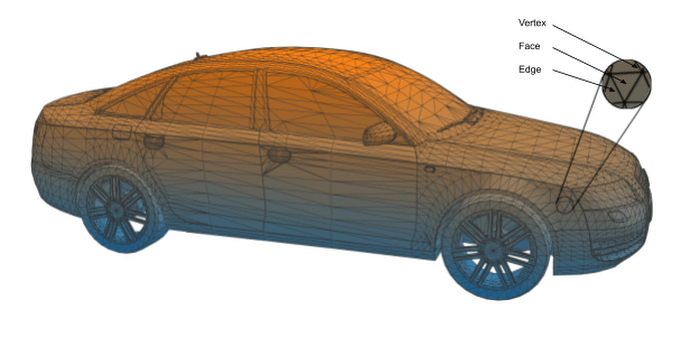
Design software recreates a physical object as a three-dimensional triangle mesh made up of three types of objects—faces, edges, and vertices. Figure 1, below, shows such a mesh for an Audi S6. Faces are flat surfaces, such as the window in a car door. An edge is where two faces meet (e.g., the side of the door), and a vertex is where two or more edges meet, such as the corner of the door.
Car bodies, however, come in all shapes and sizes. A Volkswagen Golf economy model is very different from a Tiguan SUV, and a single vehicle can have both large smooth surfaces as well as areas with delicately designed features. Consequently, there can be a huge variety from one polygonal mesh to the next.
ML models need consistent representation in order to form robust generalized rules. With such a dramatic variance between each polygonal mesh, the models would be compromised and the results could have huge margins of error.
We needed to find a way to create simple meshes that capture the shape of the car but are still suited for ML models.
Representing a car with digital shrink wrapping
Rather than building a representation of each car from the ground up, we applied a “shrink wrapping” method for the 3D meshes. The principle is very similar to vacuum-sealing a cucumber. The cucumber is placed in a plastic bag and the air is then gradually removed until the bag fits tightly around it, capturing its shape.
Our approach works similarly: we start with a base mesh, a simple shape that corresponds to the plastic bag, and we deform it until it captures the shape of the target mesh. For our purposes, the base mesh is a simplified representation of a car and the target mesh is the particular car we are designing for at that moment. Such meshes can be defined, managed, and presented to ML models for training using the Tensorflow Graphics and trimesh libraries.
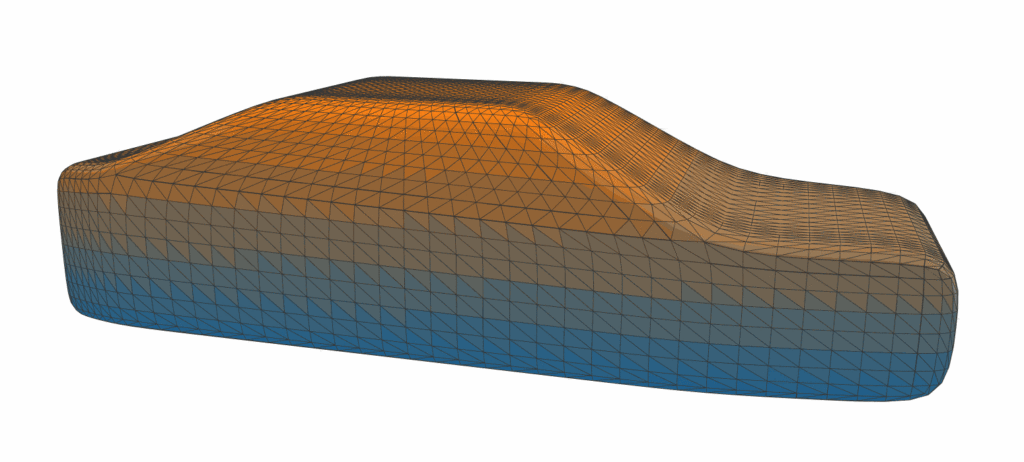
Our “shrink wrapping” method mainly works by iteratively minimizing a measure of distance (e.g., chamfer distance) between the two meshes. Additionally we can regularize our mesh to preserve certain qualities, like smoothness, in the resulting mesh. This iterative optimization is analogous to the vacuum pump, gradually shrinking and fitting the vertices of the mesh as closely as possible to the complex shape of the car. With shrink-wrapping, we are able to produce cleaner meshes that are more suitable to our estimation task. An example of such a procedure is shown in Figure 2.
How to train a model
Shrink-wrapping the 3D car designs was an important first step, but the work was far from over. Our next challenge was to build and test the machine learning algorithms.
We wanted our algorithms to estimate the drag coefficient as accurately and quickly as possible each time it looked at a new design. To do so, we had to train the ML models on existing data.
From publicly available datasets, we calculated the drag coefficients for 800 different car meshes, which we trained the models on. Then, we evaluated the trained models on a further 100 meshes, seeing how accurate their estimates were on new data.
As we worked through this training, we refined our approach. Initially, we tested models based on convolutional neural networks – similar to PointNet – that observed only the vertices, i.e., the fixed points in each mesh. But when we tested mesh-convolutional models – similar to FeastNet – we found a slightly different focus improved the accuracy of the estimates. Rather than focusing on vertices alone, these models looked at a mesh of vertices and how they relate to each other. These models placed each vertex in a richer context, leading to more accurate estimates when air-flow hit particularly subtle design features.
Working in parallel and at scale
To collaborate across time zones and two organizations, we’ve used the Google Cloud Vertex AI platform.
Vertex AI Workbench serves as a central hub to interact with other services and infrastructure on the Vertex AI platform. It enables quick experiments and preparation of training packages for resource-intensive ML model training jobs, all in a Python notebook environment for immediate execution of code. The notebook environments allow code-based interaction with other services on Google Cloud and ML tools such as Vertex AI Training and Vertex AI Pipelines.
The process of training a new model is a seamless one. First, a dataset is prepared and stored in Google Cloud Storage, usually with the help of Tensorflow Datasets. Then, for every ML model we want to test, we package and store the training code as a container image with Google Cloud Build and Container Registry. This ensures that every job is fully documented, including the provided parameters, training code package, logs from the training task, and resulting artifacts such as metrics and model files.
From there, we submit the model to the Vertex AI Training service, which provides easy access to large scale infrastructure and hardware accelerators, such as GPUs and TPUs, by simply defining resource needs when submitting a job. By using Vertex AI Training’s hyperparameter tuning feature, we can run experiments in parallel with multiple neural networks to find the right one for our purposes.
With Vertex AI Tensorboard, we can capture metrics and visualize the results of our experiments. These are readily available to anyone in the team, wherever they are in the world, for a wider discussion.
The first milestone
This joint research effort between Volkswagen and Google has produced promising results with the help of the Vertex AI platform. In this first milestone, the team was able to successfully bring recent AI research results a step closer to practical application for car design. This first iteration of the algorithm can produce a drag coefficient estimate with an average error of just 4%, within a second.
An average error of 4%, while not quite as accurate as a physical wind tunnel test, can be used to narrow a large selection of design candidates to a small shortlist. And given how quickly the estimates appear, we have made a substantial improvement on the existing methods that take days or weeks. With the algorithm that we have developed, designers can run more efficiency tests, submit more candidates, and iterate towards richer, more effective designs in just a small fraction of the time previously required.
Going forward, faster and more accurate estimates could even enable more automated searching for efficient designs, which would help both engineers and designers to hone in on the areas of the vehicle body where they could have the most impact. An important next step will be integrating the results into 3D design software to let designers benefit from the output and provide feedback.
As we continue, our focus is on improving the accuracy of the models. Firstly, we will build a larger, better quality dataset. Secondly, we will improve our shrink-wrapping algorithm to capture more details. Finally, we will enhance our existing models by experimenting with Vertex AI Neural Architecture Search to explore and experiment with different neural architecture options.
Moreover, we believe that our results for drag coefficient estimation is only a starting point for further exploration. There could potentially be numerous use cases in the space of physical simulations and assessments where cost and time savings could be achieved through ML-based estimators.
Acknowledgements
This work wouldn’t have been possible without the contributions from Volkswagen Data:Lab, Google Research, and Google Cloud. Thanks to Ahmed Ayyad, Dr. Andrii Kleshchonok, Dr. Daniel Weimer, Gülce Cesur, Henrik Bohlke, Andreas Müller from Volkswagen, Ameesh Makadia, Ph.D., and Carlos Esteves, Ph.D., from Google Research, and Daniel Holgate, Holger Speh, and Dr. Michael Menzel from Google Cloud.
Google Dataflow Named Leader in The 2021 Forrester Wave™: Streaming Analytics

6635
Of your peers have already read this article.
2:00 Minutes
The most insightful time you'll spend today!
We are excited to announce that Google has been named a Leader in The Forrester Wave™: Streaming Analytics, Q2 2021 report. Thank you to our strong community of customers and partners for working with us to deliver a customer focused product. We believe Forrester’s recognition is an acknowledgement of our leadership across an integrated set of capabilities that rely on data to drive transformation. We were also honored to be named a leader in The Forrester Wave™: Cloud Data Warehouse, Q1 2021.
Forrester gave Dataflow a score of 5 out of 5 across 12 different criteria and according to the report: “Google Cloud Dataflow has strengths in data sequencing, advanced analytics, performance, and high-availability. Google Dataflow’s sweet spot is for enterprises that have a preponderance of real-time data generated on Google Cloud Platform or wish to simplify all data processing by using a single platform that unifies both streaming and batch jobs.”
Harnessing the power of real-time data
The speed with which businesses are able to respond to change is the difference between those that successfully navigate the future and those that get left behind. In order to accelerate their digital transformation, reimagine their business and leverage the power of real-time data, today’s data leaders require a streaming analytics platform that provides both depth and breadth.
Cloud Pub/Sub and Cloud Dataflow, based on more than a decade of experience in internet scale systems for Google’s own needs, provide customers with a reliable, scalable, performant platform. In addition, we’ve designed these products for ease of use to make streaming analytics accessible to more users, which is why customers such as Sky and others from across all industries use Dataflow to run streaming analytics workloads.
5 out of 5 across key streaming analytics criteria
While Forrester gave Dataflow a score of 5 out of 5 in 12 criteria, the product achieved the highest possible scores in areas that are top of mind for our customers.
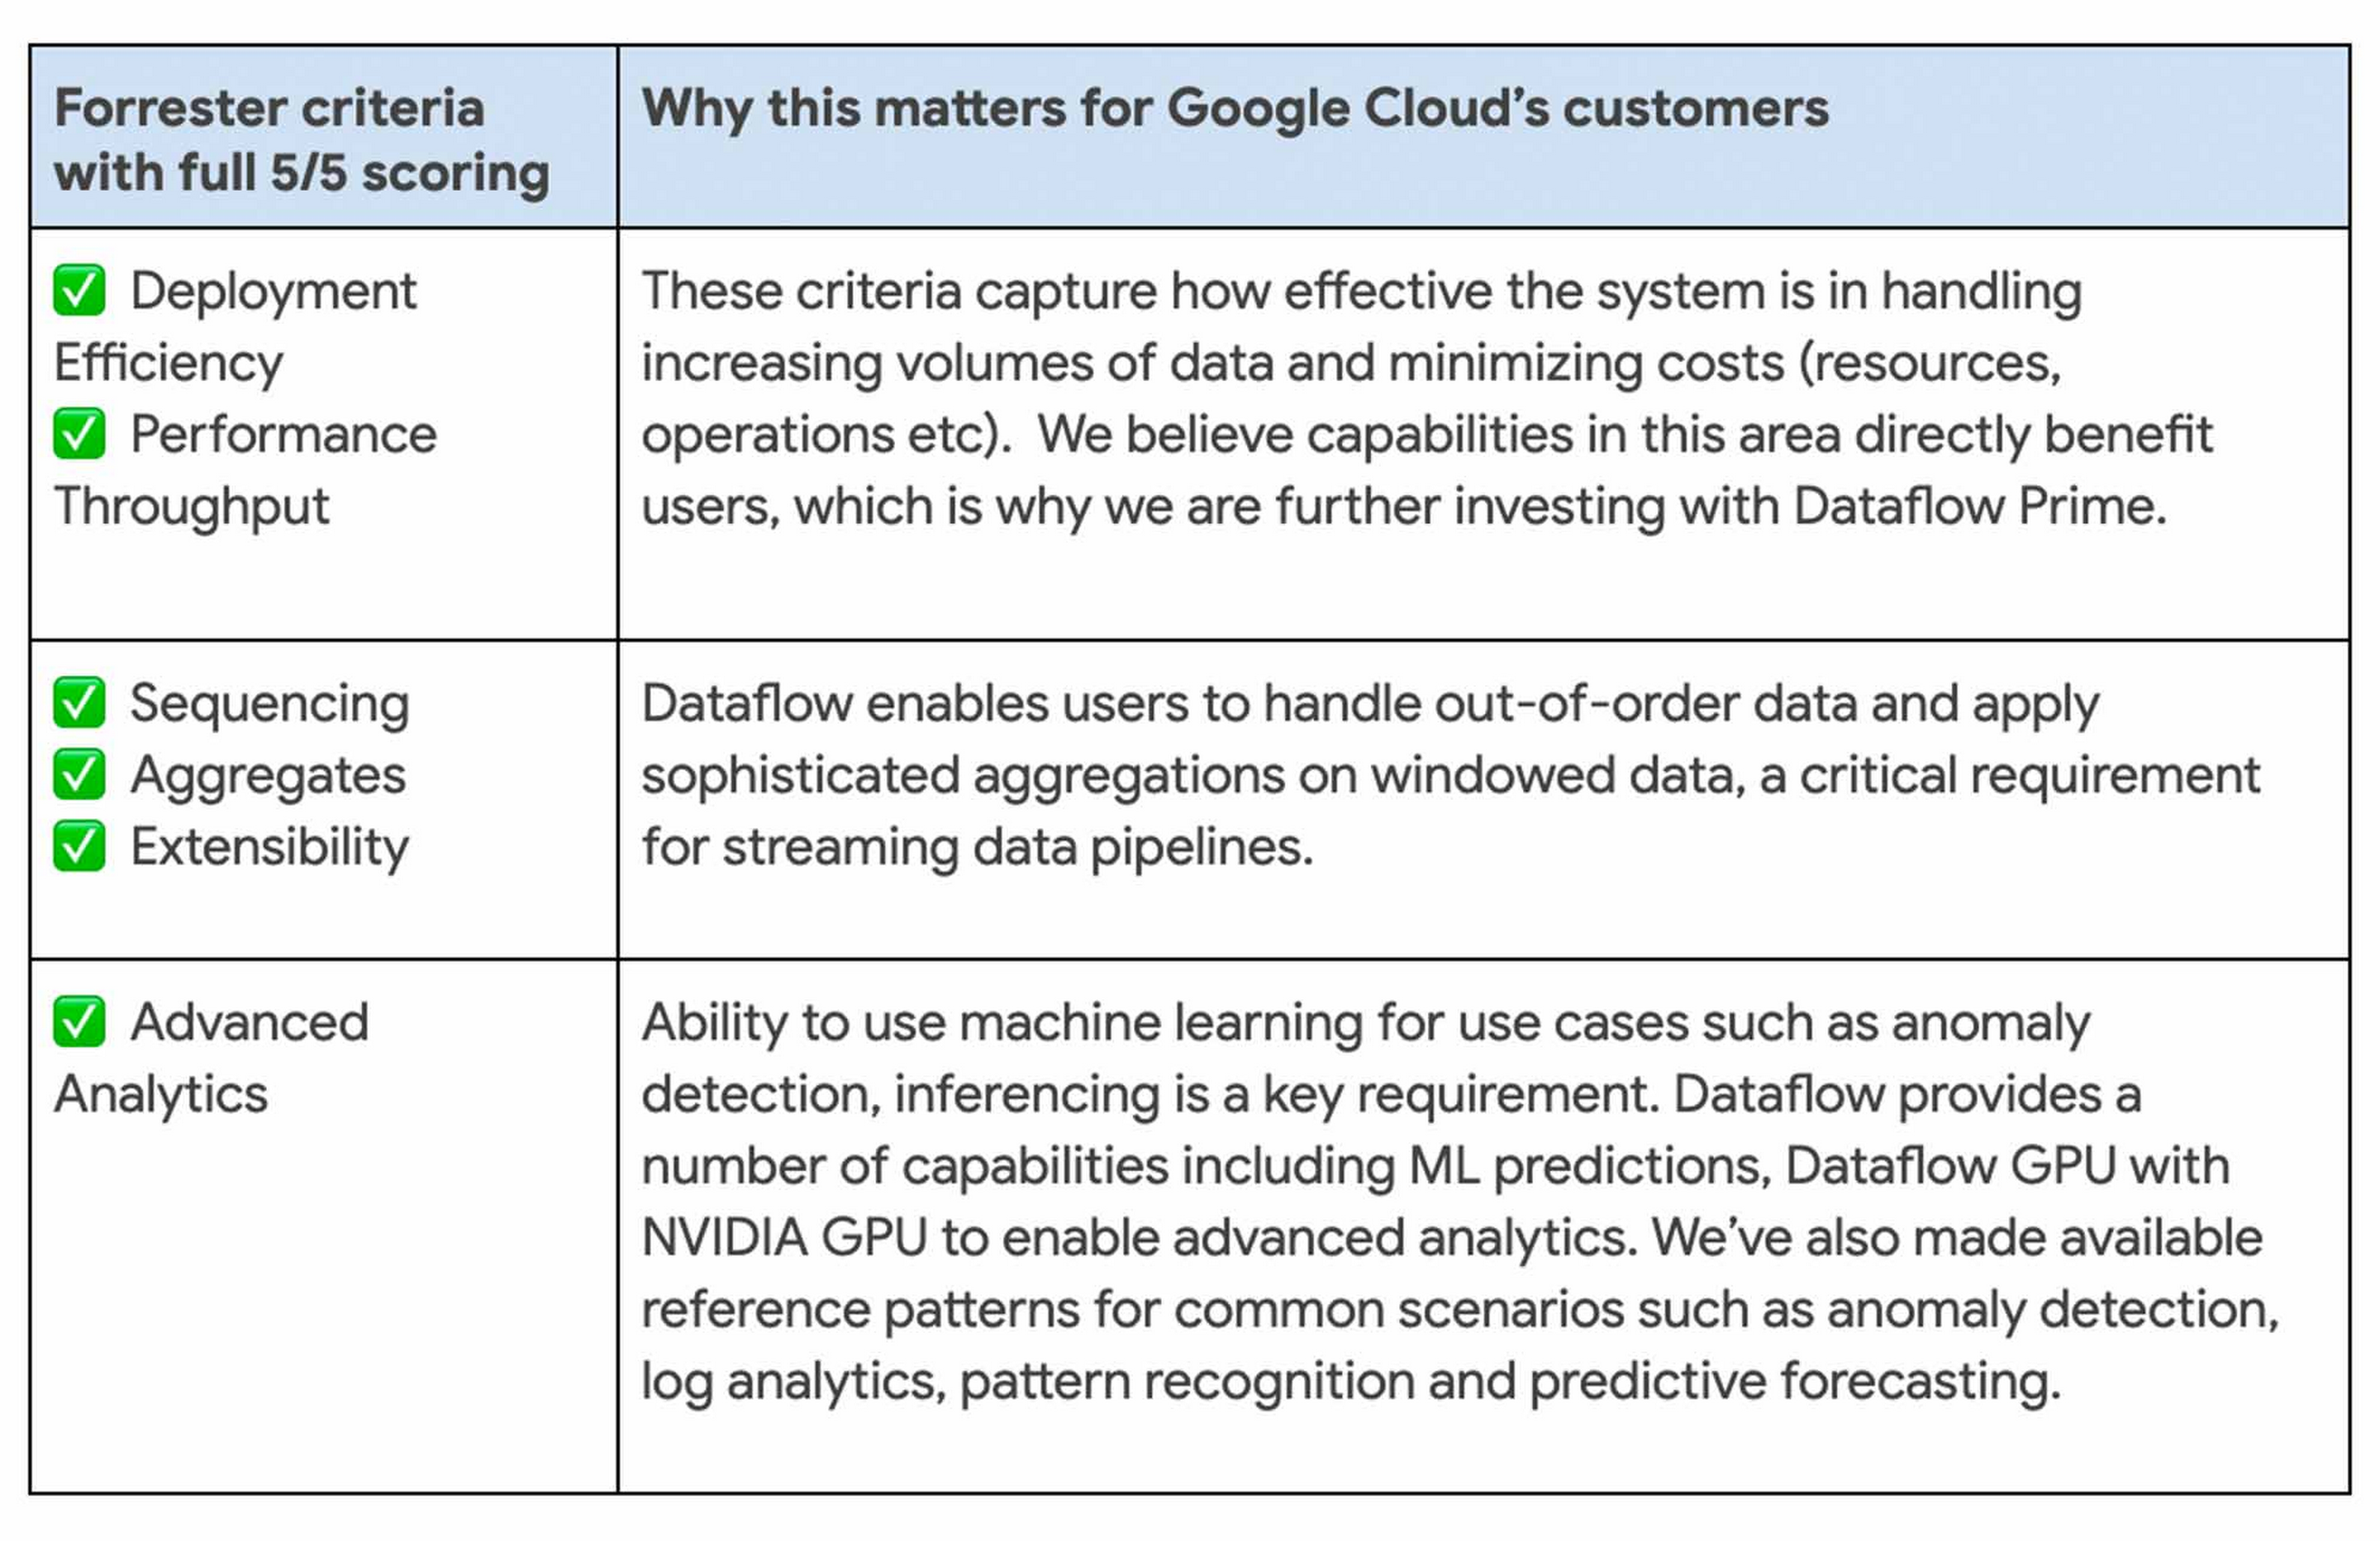
We continue to be focused on solving problems that matter to you. For example, just in the last month we announced Dataflow Prime and Auto Sharding for BigQuery – two new auto tuning capabilities that bring efficiency and simplicity to your streaming pipelines.
Dataflow achieves highest score possible in strategy
With Google, organizations gain an industry leading product and a partner that has the vision and strategy to help you tackle new business challenges and provide delightful experiences to your customers.

In summary, we are honored to be a Leader in The Forrester Wave™, Streaming Analytics, and look forward to continuing to innovate and partner with you on your digital transformation journey.
Download the full report: The Forrester Wave™: Streaming Analytics, Q2 2021 and check out these smart analytics reference patterns. To learn more about Dataflow, visit our website and get to know the product by taking an interactive tutorial. You can also watch recordings from the Data Cloud Summit event (May 2021), where we provided an in-depth view of new product innovations in Dataflow and other data analytics products.
How One Company Uses AI and Data Analysis to Boost Revenue

9445
Of your peers have already read this article.
4:30 Minutes
The most insightful time you'll spend today!
AI, deep learning, and image recognition is transforming the shopping experience. These technologies enable consumers to use product images or screenshots rather than text to search for similar products. This improves the customer experience and enables retailers with online and offline outlets to provide a genuine omnichannel experience.
The lack of complexity and the ease of use of BigQuery has enabled ViSenze to reduce its data infrastructure and management costs by 30%–50%, and scale up without incurring downtime.
—Renjie Yao, Data Platform Lead, ViSenze
Visual commerce provider ViSenze is helping some of the world’s leading retailers improve conversion rates through image-based search.
The business’s products also enable media companies to use the platform to turn images and videos into engagement opportunities—driving new and incremental revenues.
Created through NExT—a research center established by the National University of Singapore and Tsinghua University of China—ViSenze now operates in the United States, United Kingdom, India, China, and Singapore. The business is backed by Japan-based internet and ecommerce company Rakuten and cross-border investment specialist WI Harper Group.
Growth in SMB and Mobiles
Renjie Yao, Data Platform Lead at ViSenze, sees opportunities for growth in the small-to-medium business sector, where companies do not have the resources to build similar technologies, and with mobile device OEMs to integrate ViSenze natively on smartphones.
Phone owners can activate a “shopping lens” on camera and gallery apps to capture an image of a product. They then receive matching results from more than 800 partner merchants and retailers and can then click through to product pages on partner apps or mobile websites. Alternatively, they may use a photo to compare products sold on different sites or shop matching styles.
“Our research found Google Cloud provided a complete, integrated ecosystem rather than a disparate collection of tools and components, and so was ideal for our needs.”
—Renjie Yao, Data Platform Lead, ViSenze
The ViSenze API analyzes the contents of a selected or clicked image and sends the information back to the organization’s visual commerce platform. The platform feeds back similar results based on that information.
The ViSenze offering also extends to image analysis for the tagging of product attributes—such as a white turtleneck cardigan with full sleeves—to provide an improved search experience.
Data Vital to ViSenze
Capturing and analyzing large volumes of data is integral to ViSenze. “We have to understand how consumers interact with our customers’ ecommerce websites and apps,” says Yao. “For example, we need to know who has looked at a particular pair of jeans on a website and whether that visit led to a conversion. We can then tell that customer whether they need to make more stock available.”
ViSenze also relies on data to provide high-quality training for its image recognition models and its domain-specific models for online retail.
Protect Customer Data
Data is vital to ViSenze—but customer privacy is most important. “All the data we collect is transparent to our customers, meaning they can decide what they do not want us to collect. In addition, all personal data processing complies with privacy protection regulations in each region, such as the General Data Protection Regulation in Europe.”
A Quick Move to the Cloud
ViSenze started operations using servers, storage, networking, and associated systems in an on-premises data center operated by NExT.
However, to support rapid growth, the business decided to move its workloads to the cloud. ViSenze opted for a multi-cloud architecture, using in part a Google Cloud data infrastructure.
“Our research found Google Cloud provided a complete, integrated ecosystem rather than a disparate collection of tools and components, and so was ideal for our needs,” says Yao. “We could connect different components with the click of a mouse.” Further, the business found it could easily configure rules and pipelines to route data logs to relevant Google Cloud services.
The review found Google Cloud’s extensive managed services would also remove administration and maintenance tasks from ViSenze’s in-house technology team—freeing team members to focus on more valuable tasks.
In addition, Google Cloud provided the security features—including custom hardware running hardened operating systems and file systems and encryption of data at rest and in transit—needed to protect sensitive information. Finally, the location of Google Cloud regions in several countries would enable the business to meet regulatory and data sovereignty requirements.
A Three-Month Implementation
ViSenze opted to move to Google Cloud in mid-2017 and completed a three-month implementation using internal resources. “The process was very smooth and intuitive, and we had no problems building our entire data platform within Google Cloud,” says Yao.
The business now uses an architecture comprising Google Kubernetes Engine to manage and orchestrate Docker containers running in Google Cloud Platform; BigQuery to provide an analytics data warehouse, with Google Data Studio providing customizable visualization and reports; Stackdriver to monitor and manage virtual machine instances and services inside Google Cloud; Cloud SQL to manage its relational databases for real-time analytics; Compute Engine to provide compute resources; Cloud Storage to store files and objects; Cloud Pub/Sub to provide real-time messaging between applications; and Cloud Functions to build event-driven applications.
After collecting the request logs of users in virtual machine instances and Docker containers, ViSenze distributes them in three directions. “We export raw logs into Cloud Pub/Sub for indexing inside an Elasticsearch search engine, and to a BigQuery data warehouse for further analytics,” explains Yao. “We also use Cloud Functions-created applications to obtain the logs from Cloud Pub/Sub to perform some real-time calculations.”
“We are currently using Airflow workflow management on Compute Engine as our hosted ETL platform, but are likely to move to Cloud Composer in future.”
500 Million Records Per Day
With Google Cloud providing its data infrastructure, ViSenze is well positioned to meet internal and customer demands for more granular insights. The business is now processing 500 million records per day through BigQuery and saves up to one year’s aggregated data—excluding any personal data—in the data warehouse for analysis.
The nature of ViSenze’s business means most reports are generated for data processed on an hourly, daily, or monthly basis. “BigQuery is extremely stable and performance optimized, regardless of the volume of data it processes,” says Yao. “Across BigQuery and other Google Cloud Platform services, we’ve recorded 99.99% availability over the past year.”
The lack of complexity and the ease of use of BigQuery has enabled ViSenze to reduce its data infrastructure and management costs by 30%–50%, and scale up without incurring downtime.
“With BigQuery, we have saved the equivalent of two full-time engineers and now need only half of one person’s time to maintain our whole data platform,” says Yao.
“In addition, BigQuery integrates closely with Data Studio, enabling non-technical people in our product and business teams to create dynamic, detailed analysis dashboards. We now use Data Studio to create nearly 50 separate reports.”
The business has now grown to offer access to more than 1 billion users and a listing of more than 400 million purchasable products.
Next Steps
ViSenze is now researching the potential of the Cloud AutoML suite of machine learning products to improve the training of its models and run a fully managed NoSQL database through Cloud Datastore.
“A NoSQL database service is the only missing piece of our architecture for now, and using Cloud Datastore would enable us to focus almost exclusively on our business,” says Yao. “With Google Cloud Platform, we are ideally positioned to continue providing support to our business team and help them continue expanding into new markets.
“In addition, we can help retailers and consumers to unlock the potential of the web and apps to transform the purchasing experience.”
More Relevant Stories for Your Company

A CIO’s Guide to Data Analytics and Machine Learning
Breakthroughs in artificial intelligence (AI) have captured the imaginations of business and technical leaders alike. The AI techniques underlying these breakthroughs are finding diverse application across every industry. Early adopters are seeing results, particularly encouraging is that AI is starting to transform processes in established industries, from retail to financial

Geospatial Data for Business Apps Drive Sustainable and Accurate Decision-making
Organizations that collect geospatial data can use that information to understand their operations, help make better business decisions, and power innovation. Traditionally, organizations have required deep GIS expertise and tooling in order to deliver geospatial insights. In this post, we outline some ways that geospatial data can be used in

Cloud and AI Paves the Future of Finance: Excerpts from FIA Boca 2022
Financial markets were among the first to adopt new technologies, and that has certainly been true of the derivatives markets, which were early adopters of electronic trading. Going forward, new capabilities will transform the way industry participants communicate, analyze, and trade. I sat down with Google Cloud’s Phil Moyer and

Accelerate Innovation with Google Cloud’s Managed Database Services
Google Cloud’s managed database services can help you innovate faster and reduce operational overhead. The migration tools and resources included in this whitepaper will help you plan your migration. This whitepaper provides guidance on: Managing services for maximum compatibility with your workloads Leveraging services that are compatible with the most
