





UKG Ready: Meeting the Needs of Complex Machine Learning Models and Distributed Data Sets

3977
Of your peers have already read this article.
2:30 Minutes
The most insightful time you'll spend today!
Business Problem
UKG Ready primarily operates in the Small and Medium Business (SMB) space, so inherently many customers are forced to operate and make key business decisions with less Workforce Management (WFM) / Human Capital Management (HCM) data. In addition to volume, SMB lacks the variety of data needed to create a dynamic and agile organization. This puts SMB at a major disadvantage compared to larger segments.
Project Goals
People Insights module is committed to surfacing insights to customers in the context of their day-to-day duties and aid in decision making. With the SMB customer data limitations mentioned above, the goal of this project was to create a global dataset that augments individual customer data to bring light to less obvious, yet important information.
Challenges
UKG Ready is a highly configurable application that gives customers the opportunity to build solutions on a platform that meets their specific business needs. High configurability gives high flexibility to customers in their usage of the software. However, it becomes nearly impossible to create a global dataset for machine learning and data insights. UKG Ready manages just under 4 million of the US workforce and some 30,000+ customers. Despite the large employee dataset size, machine learning models that are specific to customers are starved for data because the individual customers have a relatively small employee population. Does that mean we cannot support our SMB customers’ decision making with ML?
Result
Partnering with Google, we were able to develop an approach that allowed us to standardize various domain entities (pay categories, time off codes, job titles, etc.) so that we could build a global dataset to augment SMB customer data. Using machine learning we were able to build a common vocabulary across our customer base. This common vocabulary encapsulates the nuances of how our customers manage their business and yet is generalized and standardized such that the data can be aggregated over the variety of customer configurations. This allows us to serve up practical insights to customers through various use cases. Our partnership allowed us to leverage Google Cloud Services to meet the needs of our complex machine learning models, distributed data sets and CI/CD processes.
How
UKG Ready decided to partner with Google for an end-to-end solution for the analytics offering. This allowed us to focus on our core business logic without having to worry about the platform, environment configurations, performance and scalability of the entire solution. We make use of various Google Cloud services such as Cloud Triggers, Cloud Storage, Cloud Functions, Cloud Composer, Cloud Dataflow, Big Query, Vertex AI, Cloud Pub/Sub… to host our analytics solution. Jenkins manages the entire CI/CD pipelines and cloud environments are configured and deployed using Terraform.
The standardization of business entities problem was solved in three distinct steps:
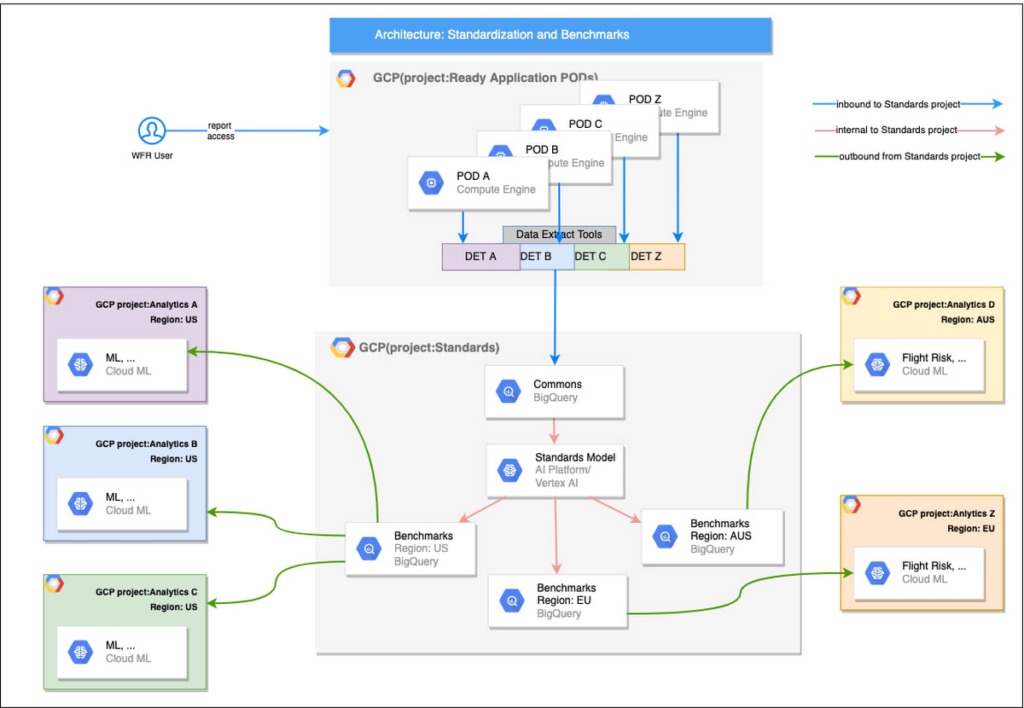
Step 1: Collecting aggregated data
We needed an approach to collect aggregated data from our highly distributed, sharded, multi-tenant data sources. We developed a custom solution that allows us to extract data aggregated at source for PII and GDPR considerations and transfer to Google Cloud Storage in the fastest manner possible. Data is then transformed and stored in Big Query. Services used: GCS, Cloud Functions, DataFlow, Cloud Composer and Big Query. All processes are orchestrated using Cloud Composer and detailed logging is available in Cloud Logging (Stackdriver).
Step 2: Applying NLP (Natural Language Processing)
Once we had the variety of customer configurations or the business entities available, we then applied NLP algorithms to categorize and standardize these in buckets. This approach assumes that customers use natural language for configurations like job titles, pay codes etc.
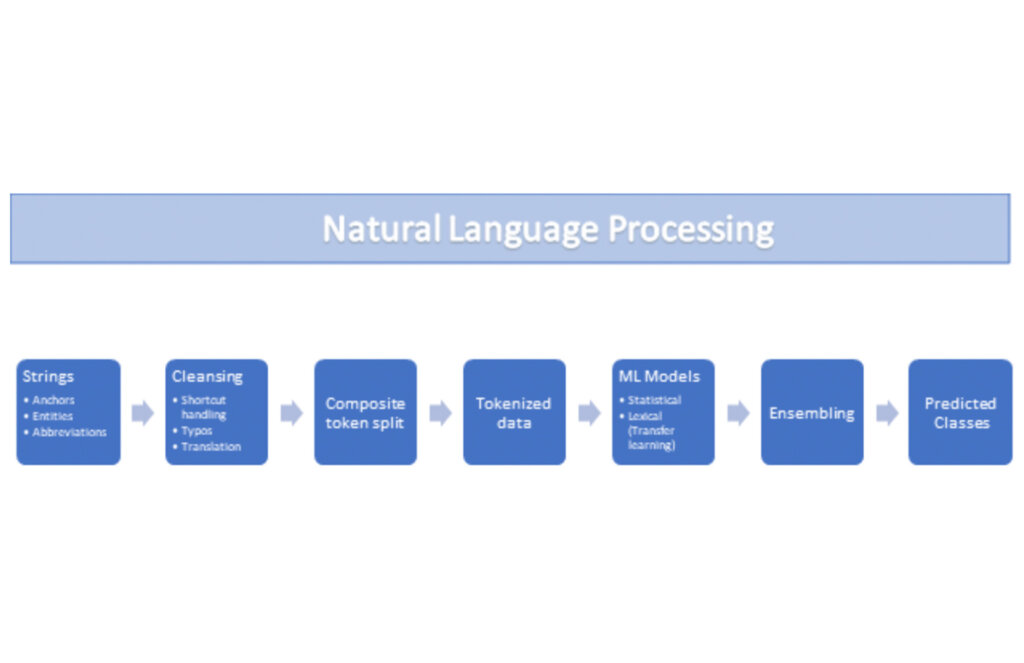
String Preparation
The input data for string preparation process is an entity string or several strings, that describe one entity object (like name-description pair or code-name pair). The output represents set of tokens that may be used to run a classification/clustering model. The process of string preparation tokenizes strings, replaces shortcuts, handles abbreviations, translates tokens, handles grammatical errors and mistypes
ML Models
Statistical
The idea of the model is to use defined target classes (clusters) and assign several tokens (anchors) to each of them an entity that has any of those tokens would be “attracted” to appropriate class. All other tokens are weighted according to frequencies of usage of theses tokens in the entities with anchor tokens:
Using anchor tokens, we are building kind-of Word2Vec - dimensionality of vector is equal to number of target classes. The higher the specific dimension (cluster) value, the higher the probability of entity to be included in appropriate cluster. Final prediction for entity tokens list for specific class is sum of weights of all the tokens included. Predicted cluster is a cluster that has maximal prediction score.
Lexical Model
We managed to generate reasonable amount of labeled data during statistical model implementation and testing. That opens a possibility to build “classical” NLP model that uses labeled data to train classification neural network using pretrained layers to produce token embeddings or even string embeddings. We started experimentation with pre-trained models like GloVe and got good results with single words and bi-grams but started getting issues in handling of n-grams. Our Google account team came to our rescue and recommended some white papers that helped formulate our strategy. We now use Tensorflow nnlm-en-dim128 model to produce string embeddings – it was trained on 200B records English Google News corpus and produces for each input string 128-dimensional vector. After that we use several Dense and Dropout layers to build a classification model.
Ensembling
To perform ensembling all the model results for each class are cast to probabilities using softmax transformation with scale normalization. Final predicted probability is maximal average score of both models among all the classes scores – appropriate class is predicted class.
The machine learning models are deployed on Vertex AI and are used in batch predictions. Model performance is captured at every prediction boundary and monitored for quality in production.
Step 3: Making available common vocabulary
Having the standardized vocabulary, we then needed a mechanism to have the results be available in UKG Ready reports and customer specific models like Flight Risk and Fatigue. For this we again used Google Services for orchestration, data transformation and data storage.
Once the modeling is complete, we made the customer specific models leveraging the above architecture be available in Reports. We utilized our proven existing technology choices in GCP for orchestration, data transformation and data storage
Results
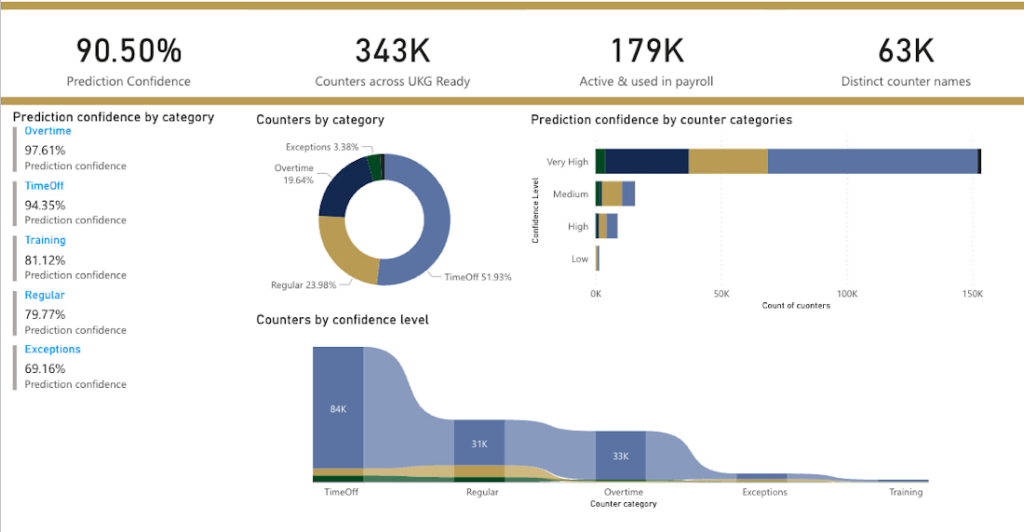
We are able to build a common vocabulary of our customers’ business entities with good confidence. And be an expert advisor to our SMB customers in their decision-making using machine learning. With the advice of our Google account team and using Google services we can add value to our product in a relatively short amount of time. And we are not done! We continue to use this platform for new use cases, complex business problems and innovative machine learning solutions.
Sample result:
Special thanks to Kanchana Patlolla , AI Specialist, Google for the collaboration in bringing this to light
Google Cloud Next 21 for Data Analytics Unplugged

4949
Of your peers have already read this article.
4:30 Minutes
The most insightful time you'll spend today!
October 23rd (this past Saturday!) was my 4th Googlevarsery and we are wrapping an incredible Google Next 2021!
When I started in 2017, we had a dream of making BigQuery Intelligent Data Warehouse that would power every organization’s data driven digital transformation.
This year at Next, It was amazing to see Google Cloud’s CEO, Thomas Kurian, kick off his keynote with CTO of WalMart, Suresh Kumar , talking about how his organization is giving its data the “BigQuery treatment”.
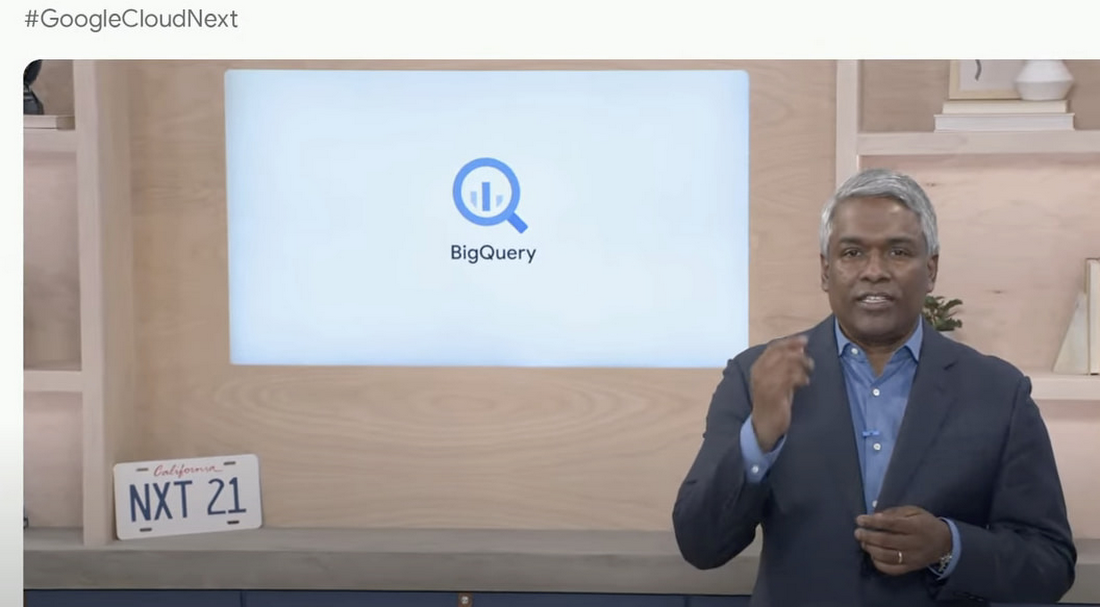
AS I recap Next 2021 and reflect on our amazing journey over the past 4 years, I’m so proud of the opportunity I’ve had to work with some of the world’s most innovative companies from Twitter to Walmart to Home Depot, Snap, Paypal and many others.
So much of what we announced at Next is the result of years of hard work, persistence and commitment to delivering the best analytics experience for customers.
I believe that one of the reasons why customers choose Google for data is because we have shown a strong alignment between our strategy and theirs and because we’ve been relentlessly delivering innovation at the speed they require.
Unified Smart Analytics Platform
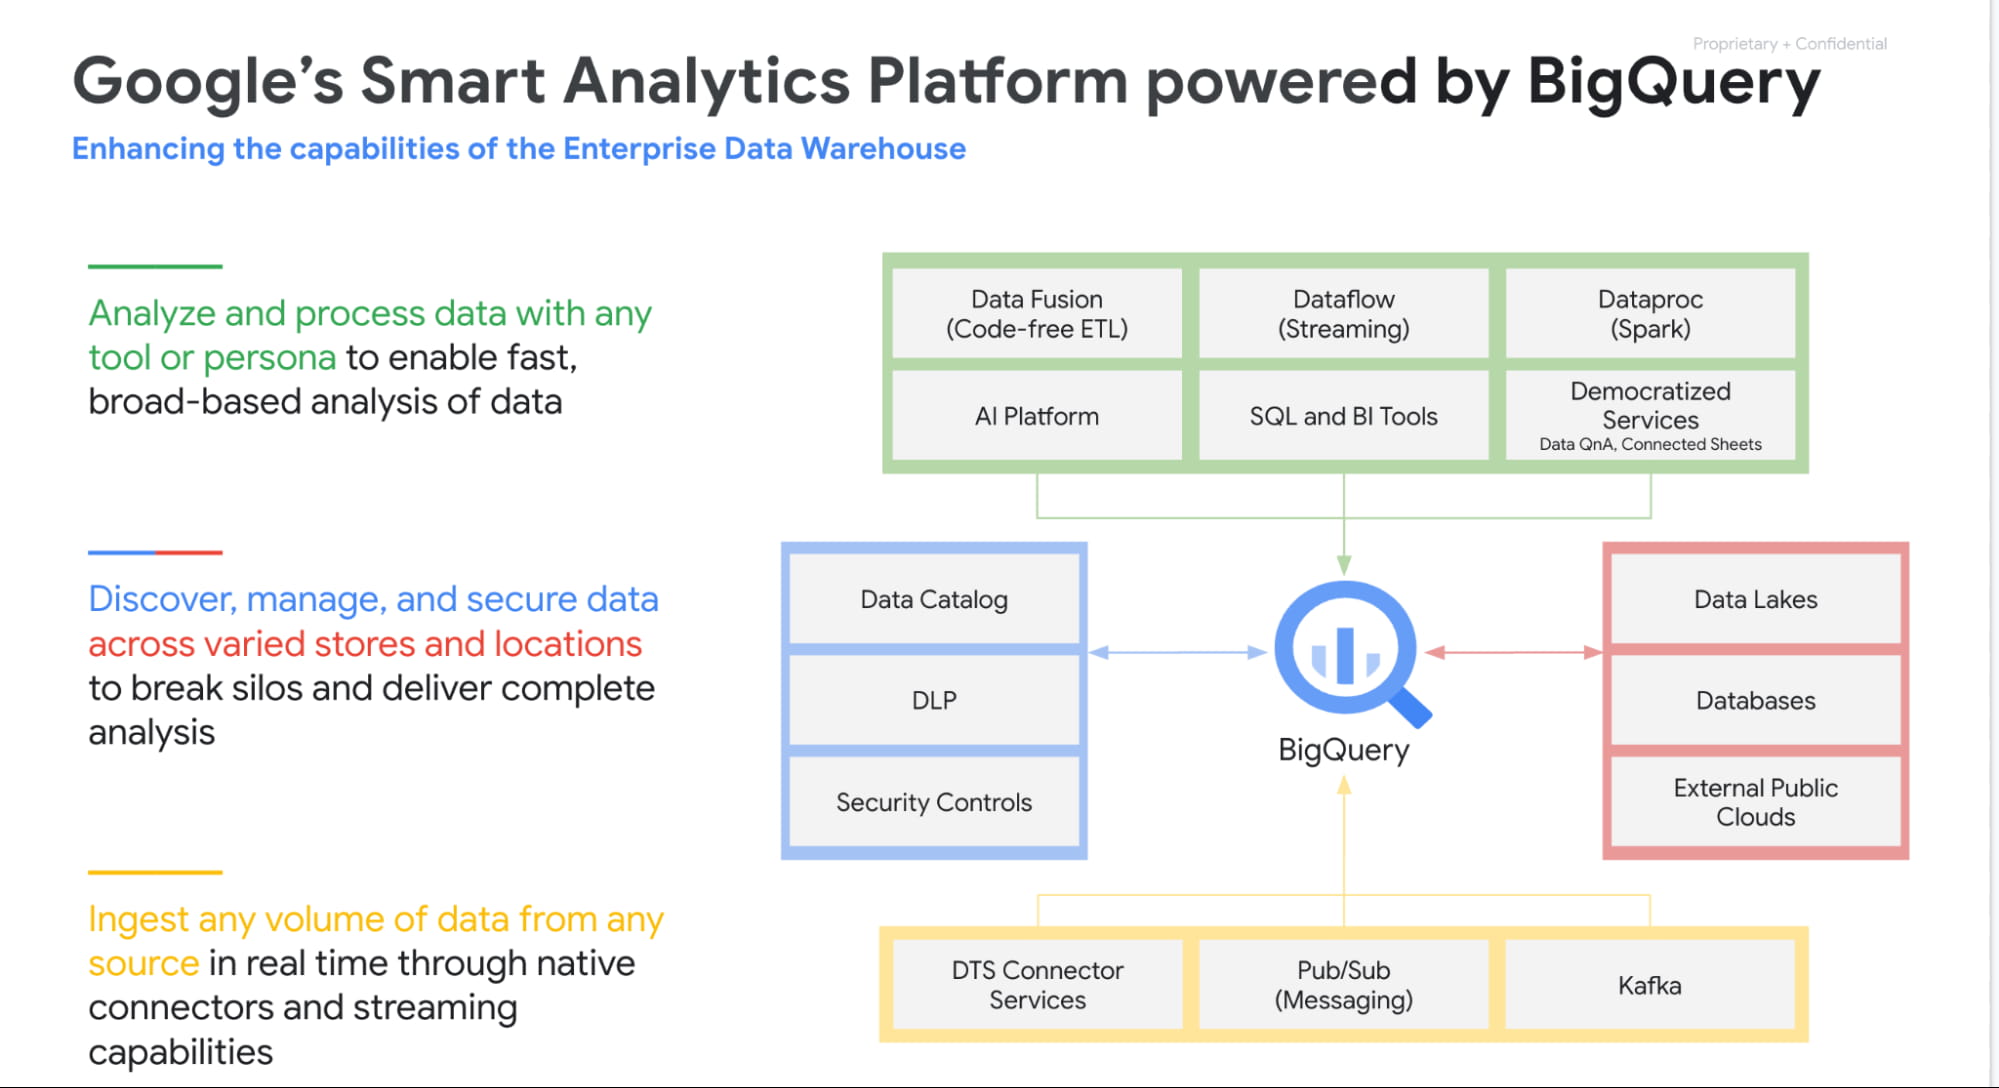
Over the past 4 years our focus has been to build industries leading unified smart analytics platforms. BigQuery is at the heart of this vision and seamlessly integrates with all our other services. Customers can use BigQuery to query data in BigQuery Storage, Google Cloud Storage, AWS S3, Azure Blobstore, various databases like BigTable, Spanner, Cloud SQL etc. They can also use any engine like Spark, Dataflow, Vertex AI with BigQuery. BigQuery automatically syncs all its metadata with Data Catalog and users can then run a Data Loss Prevention service to identify sensitive data and tag it. These tags can then be used to create access policies.
In addition to Google services, all our partner products also integrate with BigQuery seamlessly. Some of the key partners highlighted at Next 21 included Data Ingestion (Fivetran, Informatica & Confluent), Data preparation (Trifacta, DBT), Data Governance (Colibra), Data Science (Databricks, Dataiku) and BI (Tableau, PowerBI, Qlik etc).
Planet Scale analytics with BigQuery
BigQuery is an amazing platform and over the past 11 years we have continued to innovate in various aspects. Scalability has always been a huge differentiator for BigQuery. BigQuery has many customers with more than 100 petabytes of data and our largest customer is now approaching an exabyte of data. Our large customers have run queries over trillions of rows.
But scale for us is not just about storing or processing a lot of data. Scale is also how we can reach every organization in the world. This is the reason we launched BigQuery Sandbox which enables organizations to get started with BigQuery without a credit card. This has enabled us to reach tens of thousands of customers. Additionally to make it easy to get started with BigQuery we have built integrations with various Google tools like Firebase, Google Ads, Google Analytics 360, etc.
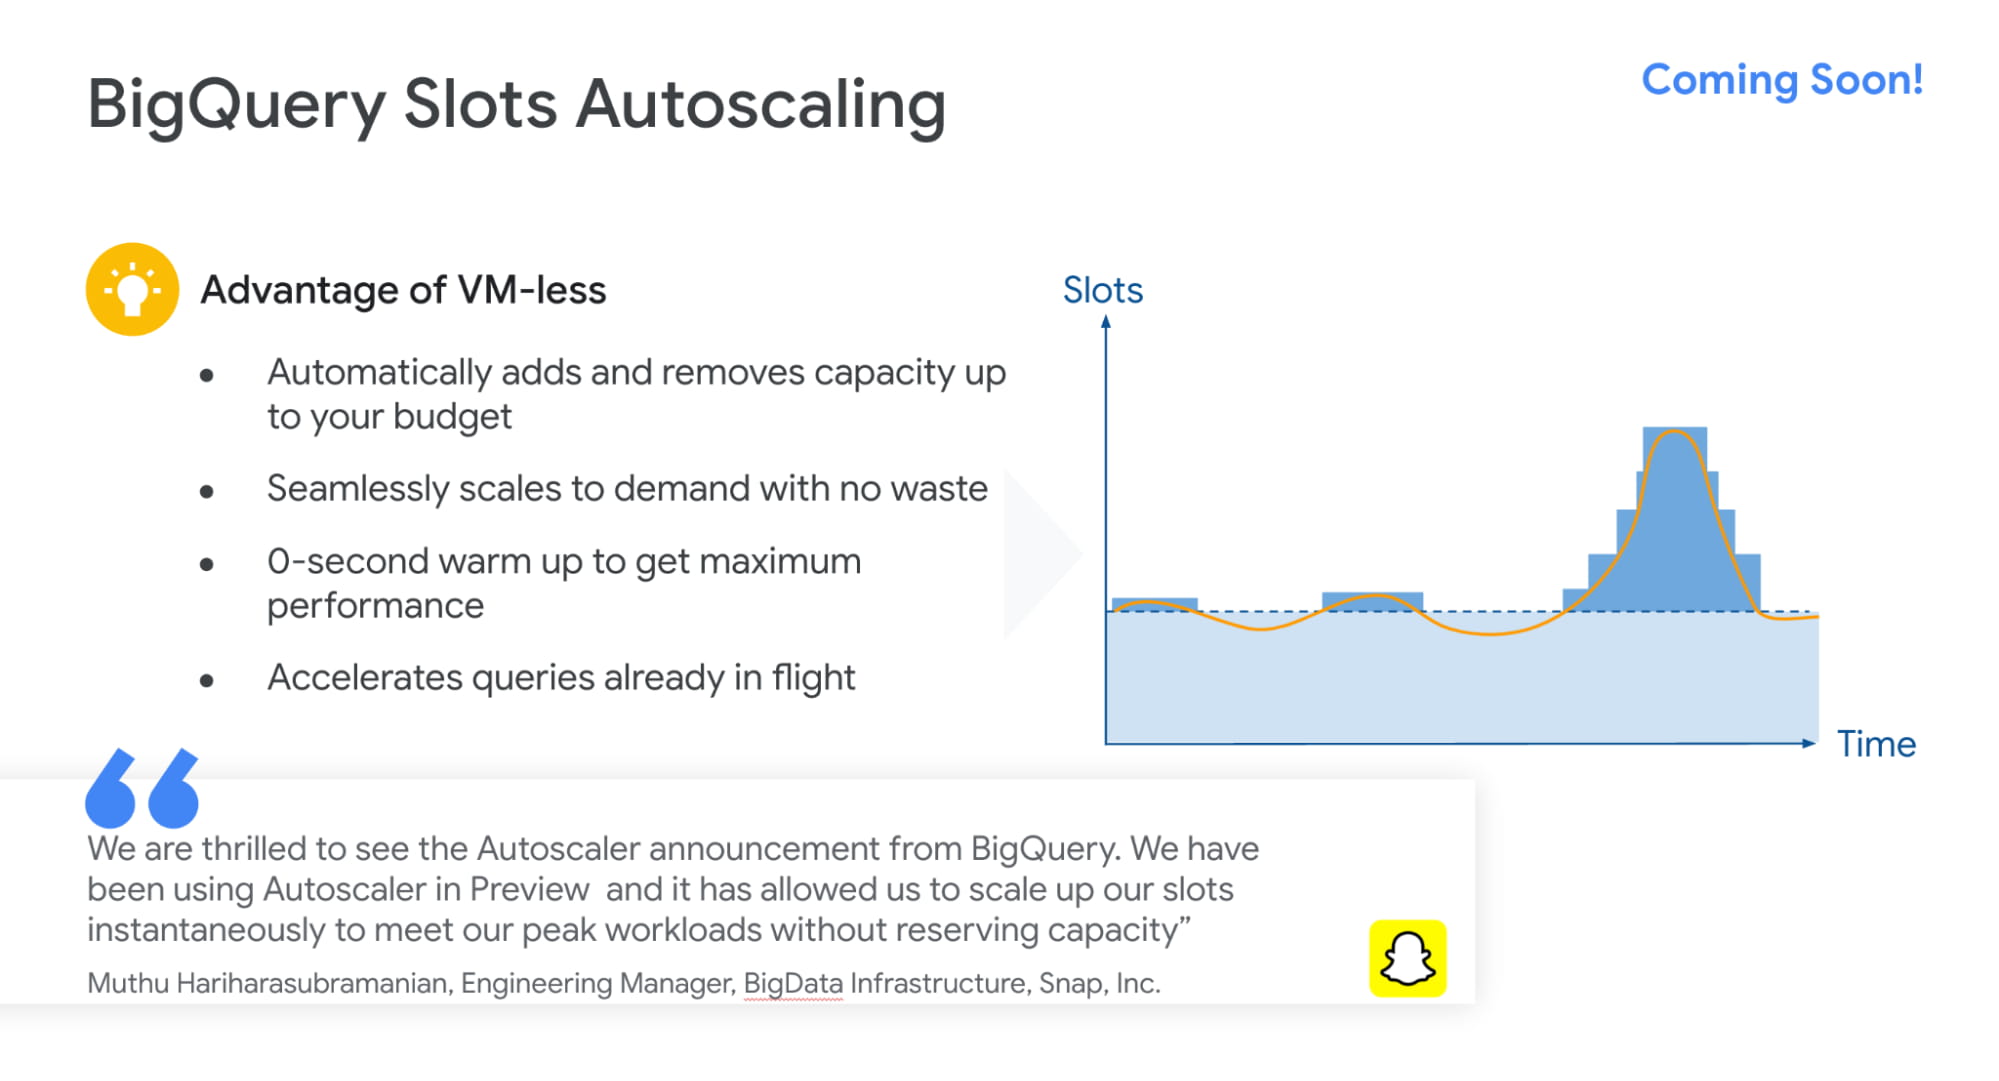
Finally, to simplify adoption we now provide options for customers to choose whether they would like to pay per query, buy flat rate subscriptions or buy per second capacity. With our autoscaling capabilities we can provide customers best value by mixing flat rate subscription discounts with auto scaling with flex slots.
Intelligent Data Warehouse to empower every data analyst to become a data scientist
BigQuery ML is one of the biggest innovations that we have brought to market over the past few years. Our vision is to make every data analyst a data scientist by democratizing Machine learning. 80% of time is spent in moving, prepping and transforming data for the ML platform. This also causes a huge data governance problem as now every data scientist has a copy of your most valuable data. Our approach was very simple. We asked:”what if we could bring ML to data rather than taking data to an ML engine?”
That is how BigQuery ML was born. Simply write 2 lines of SQL code and create ML models.
Over the past 4 years we have launched many models like regression, matrix factorization, anomaly detection, time series, XGboost, DNN etc. These models are used by customers to solve complex business problems simply from segmentation, recommendations, time series forecasting, package delivery estimation etc. The service is very popular: 80%+ of our top customers are using BigQueryML today. When you consider that the average adoption rate of ML/AI is in the low 30%, 80% is a pretty good result!

We announced tighter integration of BQML with Vertex AI. Model explainability will provide the ability to explain the results of predictive ML classification and regression models by understanding how each feature contributes to the predicted result. Also users will be able to manage, compare and deploy BigQuery ML models in Vertex; leverage Vertex Pipelines to train and predict BigQuery ML models.
Real-time streaming analytics with BigQuery
Customer expectations are changing and everyone wants everything in an instant: according to Gartner, by the end of 2024, 75% of enterprises will shift from piloting to operationalizing AI, driving a 5X increase in streaming data and analytics infrastructures.
The BigQuery’s storage engine is optimized for real-time streaming. BigQuery supports streaming ingestion of 10s of millions of events in real-time and there is no impact on query performance. Additionally customers can use materialized views and BI Engine (which is now GA) on top of streaming data. We guarantee always fast, always fresh data. Our system automatically updates MVs and BI Engine.
Many customers also use our PubSub service to collect real-time events and process these through Dataflow prior to ingesting into BigQuery. This is a streaming ETL pattern which is very popular. Last year,we announced PubSub Lite to provide customers with a 90% lower price point and aTCO that is lower than any DIY Kafka deployment.
We also announced Dataflow Prime, it is our next generation platform for Dataflow. Big Data processing platforms have only focused on horizontal scaling to optimize workloads. But we have seen new patterns and use cases like streaming AI where you may have a few steps in pipelines that perform data prep and then customers have to run a GPU based model. Customers want to use different sizes and shapes of machines to run these pipelines in the most optimum manner. This is exactly what Dataflow Prime does. It delivers vertical auto scaling with the right fitting for your pipelines. We believe this should lower costs for pipelines significantly.
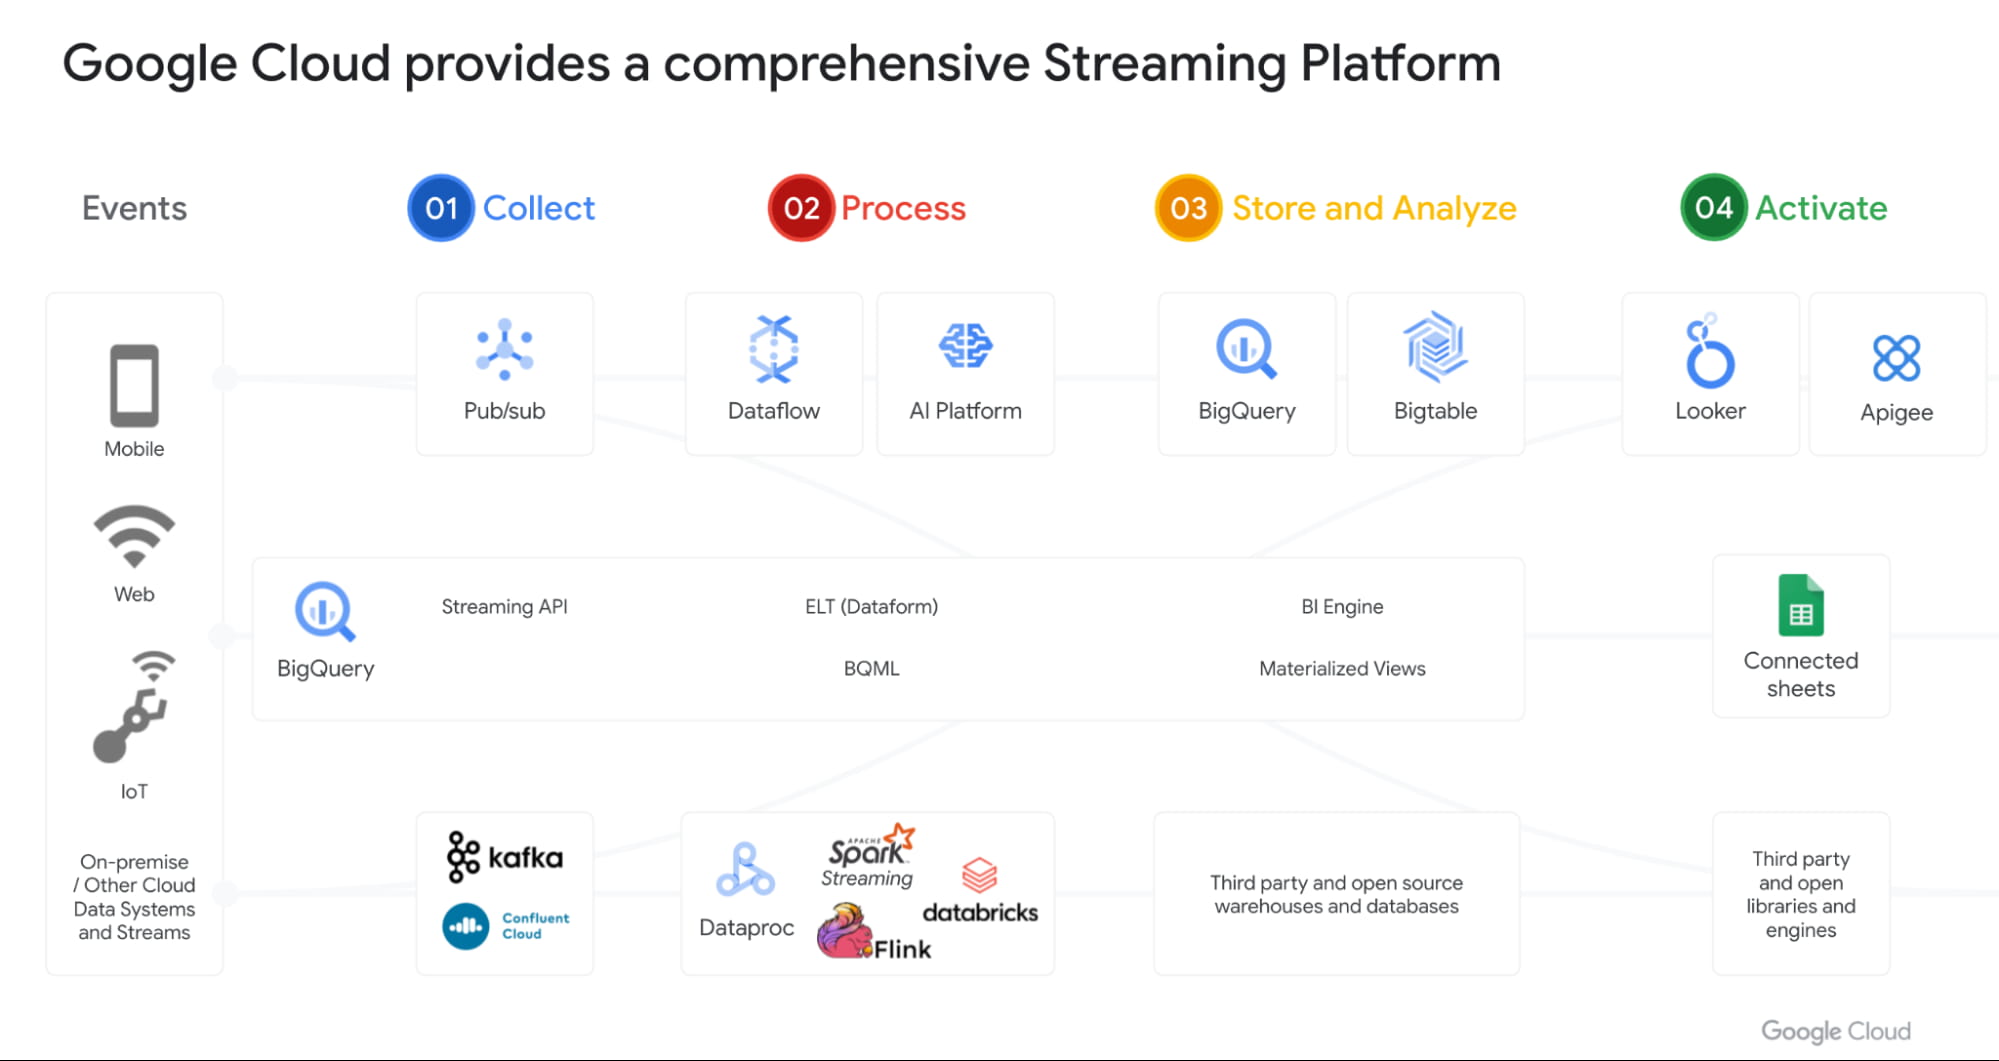
With Datastream as our change data capture service (built on Alooma technology), we have solved the last key problem space for customers. We can automatically detect changes in your operational databases like MySQL, Postgres, Oracle etc and sync them in BigQuery.
Most importantly, all these products work seamlessly with each other through a set of templates. Our goal is to make this even more seamless over next year.
Open Data Analytics with BigQuery
Google has always been a big believer in Open Source initiatives. Our customers love using various open source offerings like Spark, Flink, Presto, Airflow etc. With Dataproc & Composer our customers have been able to run various of these open source frameworks on GCP and leverage our scale, speed and security. Dataproc is a great service and delivers massive savings to customers moving from on-prem Hadoop environments. But customers want to focus on jobs and not clusters.
That’s why we launched Dataproc Serverless Spark (GA) offering at Next 2021. This new service adheres to one of our key design principles we started with: make data simple.
Just like with BigQuery, you can simply RUN QUERY. With Spark on Google Cloud, you simply RUN JOB. ZDNet did a great piece on this. I invite you to check it out!
Many of our customers are moving to Kubernetes and wanted to use that as the platform for Spark. Our upcoming Spark on GKE offering will give the ability to deploy spark workloads on existing Kubernetes clusters.
But for me the most exciting capability we have is, the ability to run Spark directly on BigQuery Storage. BigQuery storage is highly optimized analytical storage. By running Spark directly on it, we again bring compute to data and avoid moving data to compute.
BigSearch to power Log Analytics
We are bringing the power of Search to BigQuery. Customers already ingest massive amounts of log data into BigQuery and perform analytics on it. Our customers have been asking us for better support for native JSON and Search. At Next 21 we announced the upcoming availability of both these capabilities.
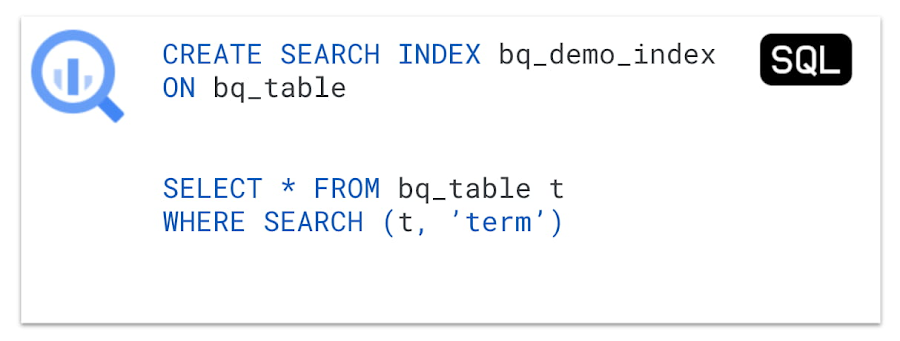
Fast cross column search will provide efficient indexing of structured, semi-structured and unstructured data. User friendly SQL functions let customers rapidly find data points without having to scan all the text in your table or even know which column the data resides in.
This will be tightly integrated with native JSON, allowing customers to get BigQuery performance and storage optimizations on JSON as well as search on unstructured or constantly changing data structures.
Multi & Cross Cloud Analytics
Research on multi cloud adoption is unequivocal — 92% of businesses in 2021 report having a multi cloud strategy. We have always believed in providing customers choice to our customers and meeting them where they are. It was clear that all our customers wanted us to take our gems like BigQuery to other clouds as their data was distributed on different clouds.
Additionally it was clear that customers wanted cross cloud analytics not multi-cloud solutions that can just run in different clouds. In short, see all their data with a single pane of glass, perform analysis on top of any data without worrying about where it is located, avoid egress costs and finally perform cross cloud analysis across datasets on different clouds.
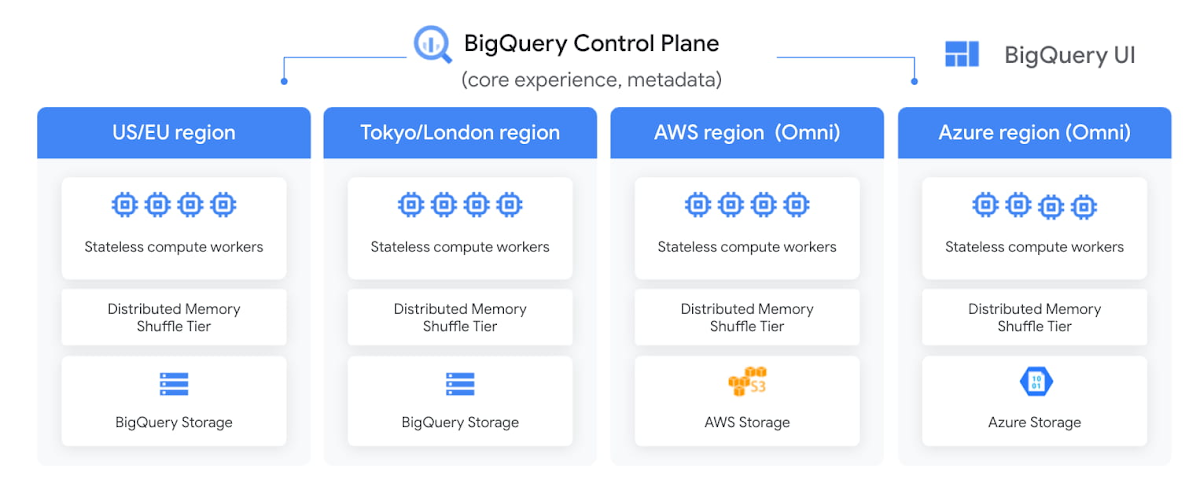
With BigQuery Omni, we deliver on this vision, with a new way of analyzing data stored in multiple public clouds. Unlike competitors, BigQuery Omni does not create silos across different clouds. BigQUery provides a single control plane that shows an analyst all data they have access to across all clouds. Analyst just writes the query and we send it to the right cloud across AWS, Azure or GCP to execute it locally. Hence no egress costs are incurred.
We announced BQ Omni GA for both AWS and Azure at Google Next 21 and I’m really proud of the team for delivering on this vision. Check out Vidya’s session and learn from Johnson and Johnson how they innovate in a multi-cloud world.
Geospatial Analytics with BigQuery and Earth Engine
We have partnered with our Google Geospatial team to deliver GIS functionality inside BigQuery over the years. At Next we announced that customers will be able to integrate Earth Engine with BigQuery, Google Cloud’s ML technologies, and Google Maps Platform.
Think about all the scenarios and use-cases your team’s going to be able to enable sustainable sourcing, saving energy or understanding business risks.
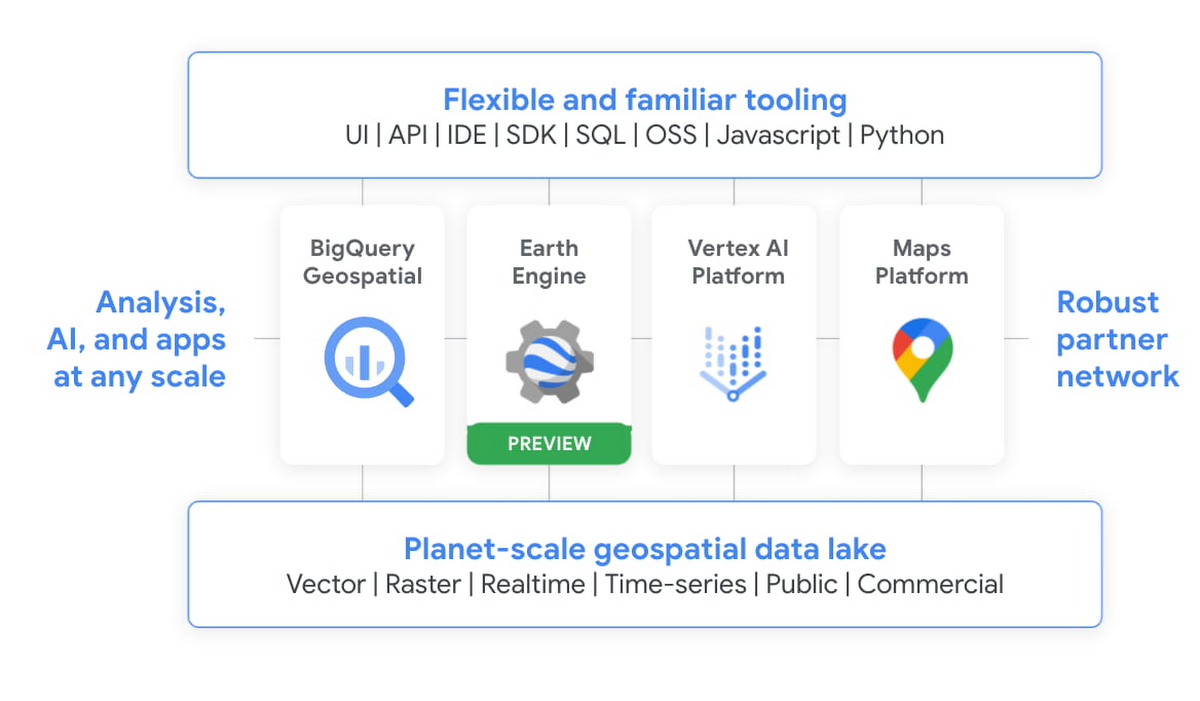
We’re integrating the best of Google and Google Cloud together to – again – make it easier to work with data to create a sustainable future for our planet.
BigQuery as a Data Exchange & Sharing Platform
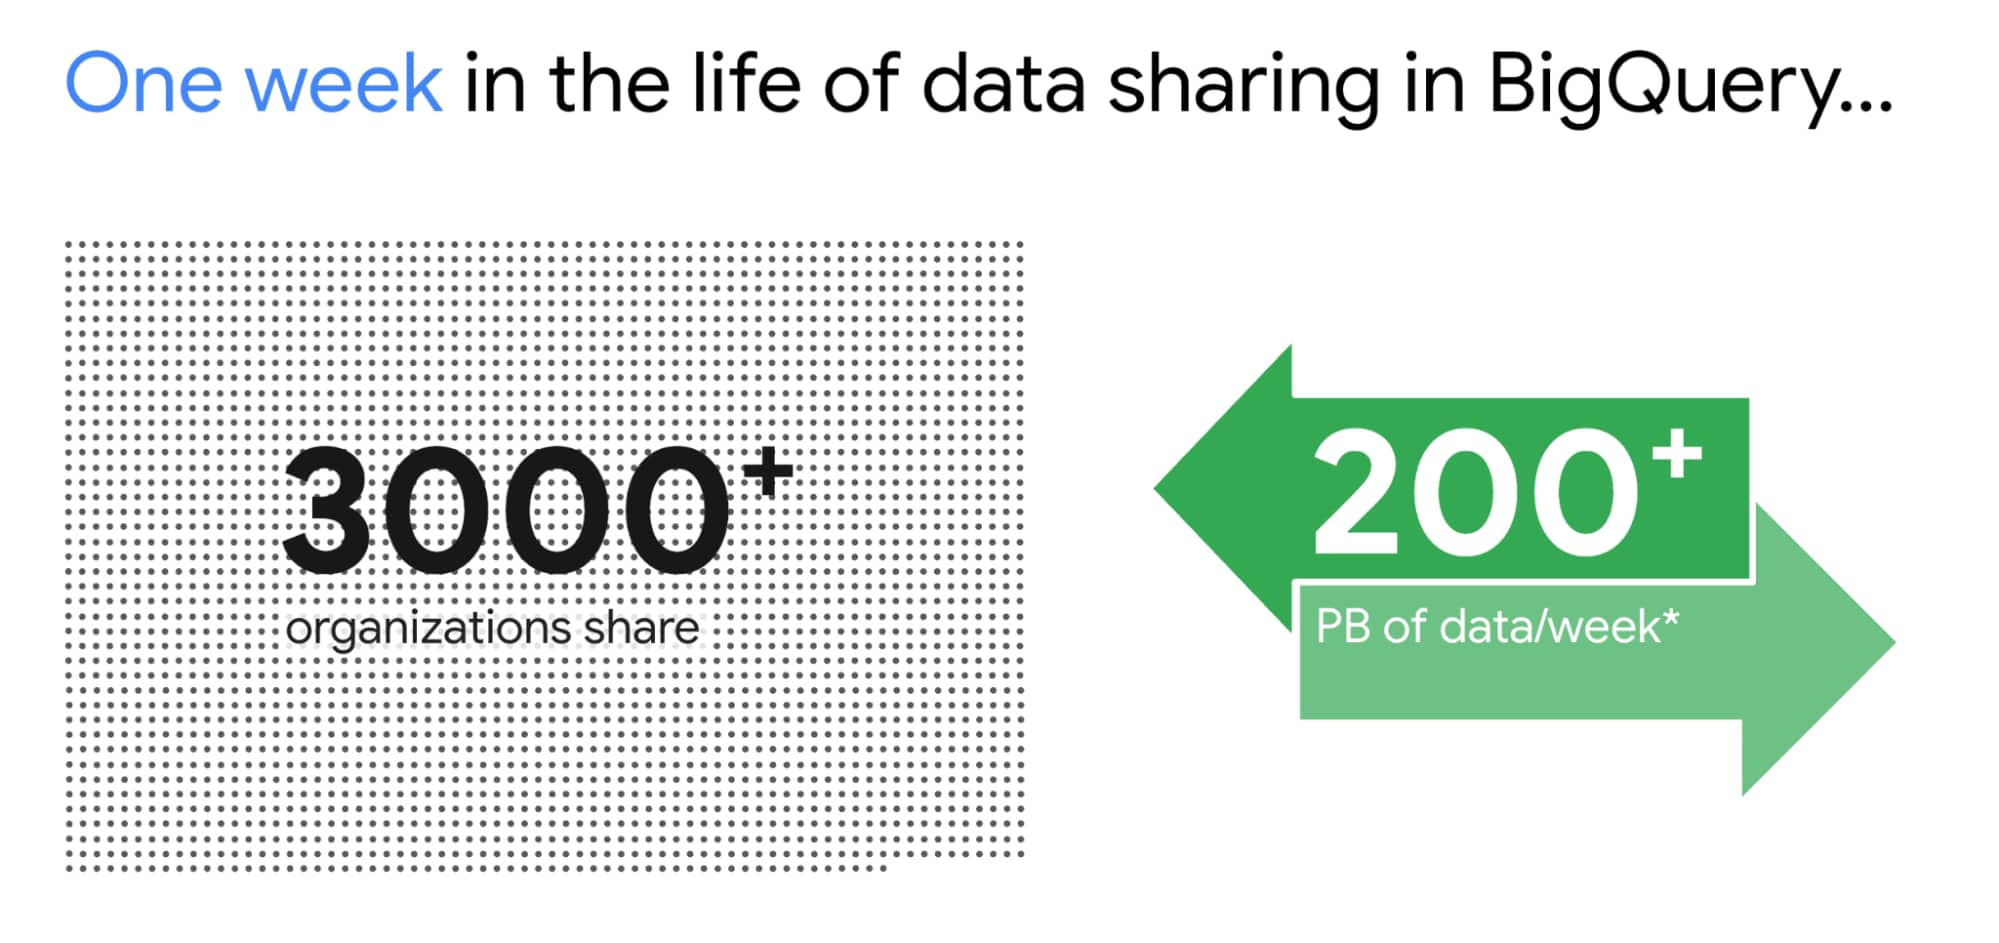
BigQuery was built to be a sharing platform. Today we have 3000+ organizations sharing more than 250 petabytes of data across organizations. Google also brings more than 150 public datasets to be used across various use cases. In addition to this, we are also bringing some of the most unique datasets like Google Trends to BigQuery. This will enable organizations to understand in real-time trends and apply to their business problems.
I am super excited about the Analytics Hub Preview announcement. Analytics Hub will provide the ability for organizations to build private and public analytics exchanges. This will include data, insights, ML Models and visualizations. This is built on top of the industry leading security capabilities of BigQuery.

Breaking Data Silos
Data is distributed across various systems in the organization and making it easy to break the data silo and make all this data accessible to all is critical. I’m also particularly excited about the Migration Factory we’re building with Informatica and the work we are doing for data movement, intelligent data wrangling with players like Trifacta and FiveTran, with whom we share over 1,000 customers (and growing!). Additionally we continue to deliver native Google service to help our customers.
We acquired Cask in 2018 and launched our self service Data Integration service in Data Fusion. Now Fusion allows customers to create complex pipelines with just simple drag and drop. This year we focused on unlocking SAP data for our customers. We have launched various SAP connectors and accelerators to achieve this.
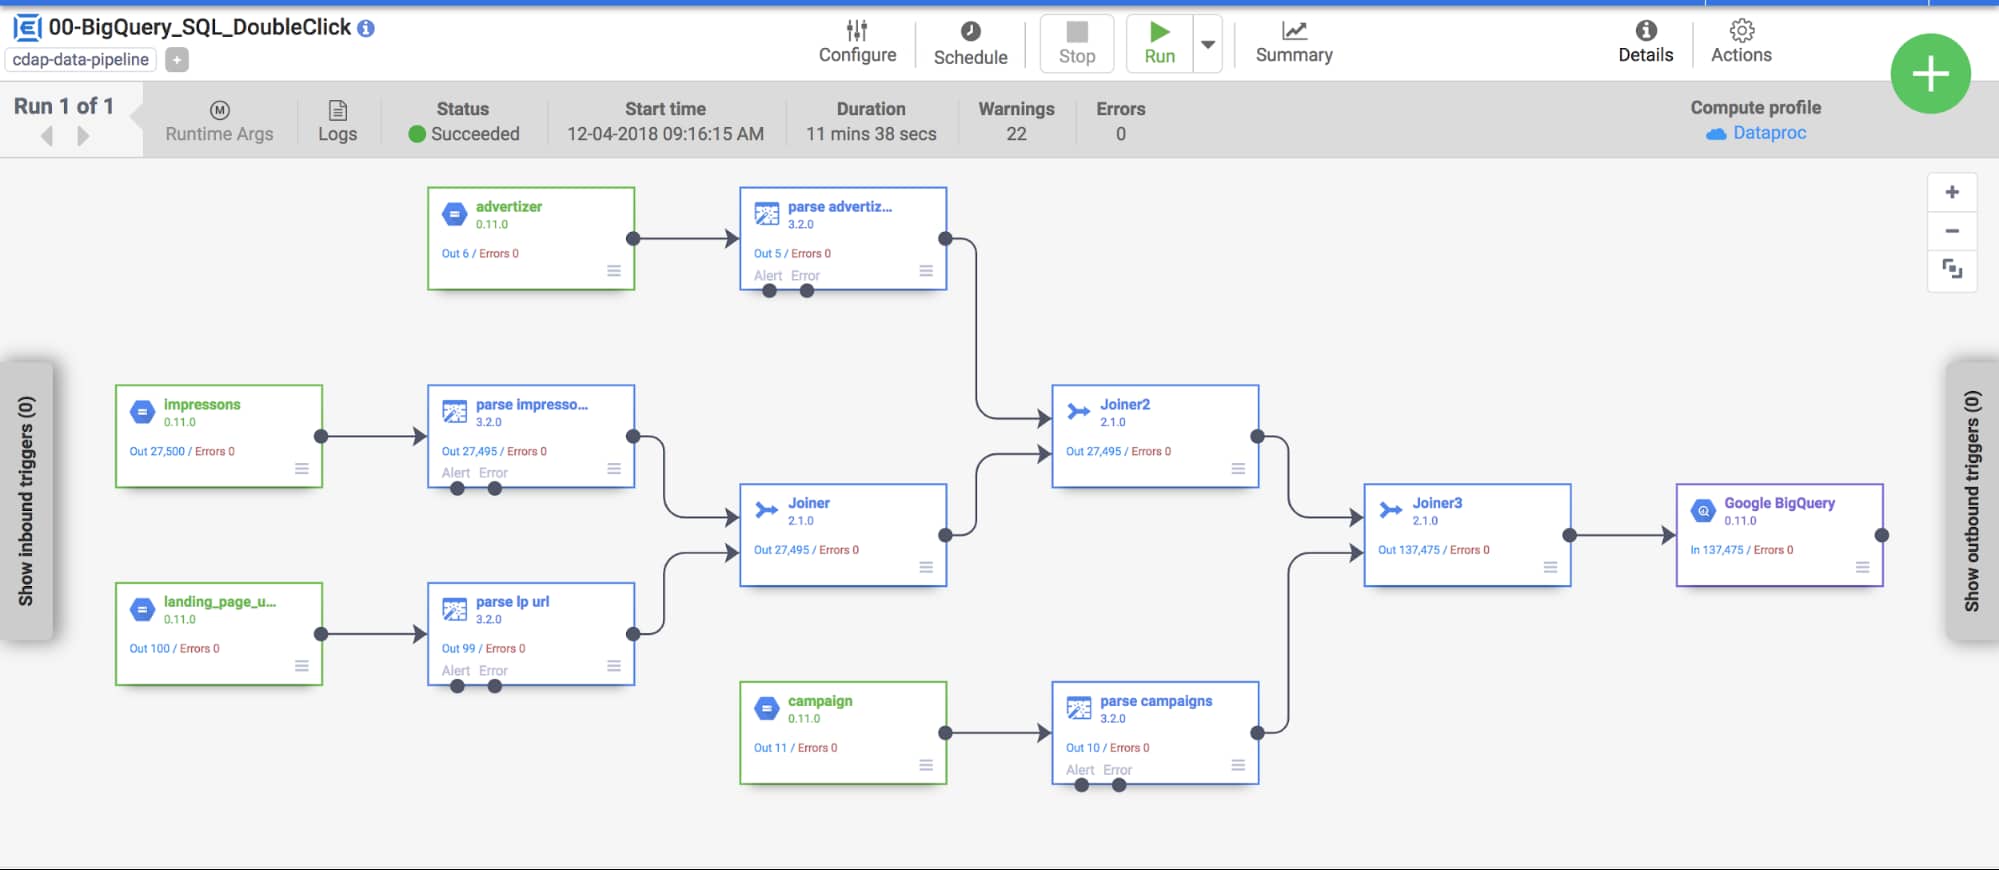
At GCP Next we also announced our BigQuery Migration service in preview. Many of our customers are migrating their legacy data warehouses and data lakes to BigQuery. BigQuery Migration Service provides end-to-end tools to simplify migrations for these customers.
And today, to make migrations to BigQuery easier for even more customers, I am super excited to announce the acquisition of CompilerWorks. CompilerWorks’ Transpiler is designed from the ground up to facilitate SQL migration in the real world and will help our customers accelerate their migrations. It supports migrations from over 10 legacy enterprises data warehouses and we will be making it available as part of our BigQuery Migration service in the coming months.
Data Democratization with BigQuery
Over the past 4 years we have focused a lot on making it very easy to derive actionable insights from data in BigQuery. Our priority has been to provide a strong ecosystem of partners that can provide you with great tools to achieve this but also deliver native Google capabilities.
With our BI engine GA announcement which we introduced in 2019, previewed earlier this year and showcased with tools like Microsoft PowerBI and Tableau, is now available for all to play with.

BigQuery + Data Studio are like peanut butter and Jelly. They just work well together. We launched BI Engine first with Data Studio and scaled it to all the users. More than 40% of our BigQuery customers use Data Studio. Once we knew BI Engine works extremely well we now have made it an integral part of BigQuery API and launched it for all our internal and partner BI tools.
We announced GA for BI Engine at Next 2021 but we were already GA with Data Studio for the past 2 years. We recently moved the Data Studio team back into Google Cloud making the partnership even stronger. If you have not used Data Studio, I encourage you to take a look and get started for free today here!!
Connected Sheets for BigQuery is one of my favorite combinations. You can give every business user in your organization the ability to analyze billions of records using standard Google Sheets experience. I personally use it everyday to analyze all our product data.
We acquired Looker in Feb 2020 with a vision of providing a semantic modeling layer to our customers with a governed BI solution. Looker is tightly integrated with BigQuery including BigQuery ML. Our latest partnership with Tableau where Tableau customers will soon be able to leverage Looker’s semantic model, enabling new levels of data governance while democratizing access to data.
Finally, I have a dream that one day we will bring Google Assistant to your enterprise data. This is the vision of Data QnA. We are in early innings on this and we will continue to work hard to make this vision a reality.
Intelligent Data Fabric to unify the platform
Another important trend that shaped our market is the Data Mesh. Earlier this year, Starburst invited me to talk about this very topic. We have been working for years on this concept, and although we would love for all data to be neatly organized in one place, we know that our customers’ reality is that it is not (If you want to know more about this, read about my debate on this topic with Fivetran’s George Fraser, a16z’s Martin Casado and Databricks’ Ali Ghodsi).
Everything I’ve learned from customers over my years in this field is that they don’t just need a data catalog or a set of data quality and governance tools, they need an intelligent data fabric. That is why we created Dataplex, whose general availability we announced at Next.
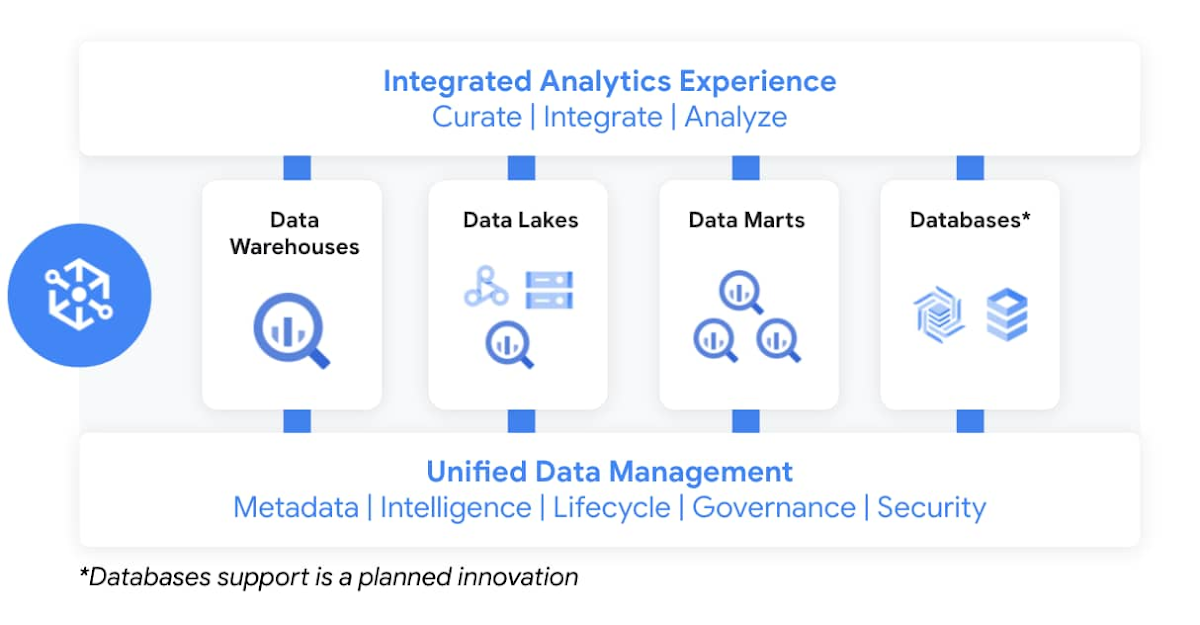
Dataplex enables customers to centrally manage, monitor, and govern data across data lakes, data warehouses, and data marts, while also ensuring data is securely accessible to a variety of analytics and data science tools. It lets customers organize and manage data in a way that makes sense for their business, without data movement or duplication. It provides logical constructs – lakes, data zones, and assets – which enable customers to abstract away the underlying storage systems to build a foundation for setting policies around data access, security, lifecycle management, and so on. Check out Prajakta Damle’s session and learn from Deutsche Bank how they are thinking about a unified data mesh across distributed data.
Closing Thoughts
Analysts have recognized our momentum and, as I look back at this year, I couldn’t thank our customers and partners enough for the support they provided my team and I across our large Data Analytics portfolio: in March, Google BigQuery was named a Leader in The Forrester Wave™: Cloud Data Warehouse, Q1 2021. And in June, Dataflow was named a Leader in The Forrester Wave™: Streaming Analytics, Q2 2021 report.
If you want to get a taste for why customers choose us over other hyperscalers or cloud data warehousing, I suggest you watch the Data Journey series we’ve just launched, which documents the stories of organizations modernizing to the cloud with us.
The Google Cloud Data Analytics portfolio has become a leading force in the industry and I couldn’t be more excited to have been part of it. I do miss you, my customers and partners, and I’m frankly bummed that we didn’t get to meet in person like we’ve done so many times before (see a photo of my last in-person talk before the pandemic), but this Google Next was extra special, so let’s dive into the product innovation and their themes.
I hope that I will get to see you in person next time we run Google Next!
How Vertex Vizier’s Automated Hyperparameter Tuning Improves ML Models
5045
Of your peers have already read this article.
1:30 Minutes
The most insightful time you'll spend today!
We recently launched Vertex AI to help you move machine learning (ML) from experimentation into production faster and manage your models with confidence—speeding up your ability to improve outcomes at your organization.
But we know many of you are just getting started with ML and there’s a lot to learn! In tandem with building the Vertex AI platform, our teams are dropping as much best practices content as we can to help you come up to speed. Plus, we have a dedicated event on June 10th, Applied ML Summit, with sessions on how to apply ML technology in your projects, as well as grow your skills in this field.
In the meantime, we couldn’t resist a quick lesson on hyperparameter tuning, because (a) it’s incredibly cool (b) you will impress your coworkers (c) Google Cloud has some unique battle tested tech in this area and (d) you will save time by getting better ML models into production faster. Vertex Vizier, on average, finds optimal parameters for complex functions in over 80% fewer trials than traditional methods.
So it’s incredibly cool, but what is it?
While machine learning models automatically learn from data, they still require user-defined knobs which guide the learning process. These knobs, commonly known as hyperparameters, control, for example, the tradeoff between training accuracy and generalizability. Examples of hyperparameters are the optimizer being used, its learning rate, regularization parameters, the number of hidden layers in a DNN, and their sizes.
Setting hyperparameters to their optimal values for a given dataset can make a huge difference in model quality. Typically, optimal hyperparameter values are found via grid searching a small number of combinations, or tedious manual experimentation. Hyperparameter tuning automates this work for you by searching for the best configuration of hyperparameters for optimal model performance.
Vertex Vizier enables automated hyperparameter tuning in several ways:
- “Traditional” hyperparameter tuning: by this we mean finding the optimal value of hyperparameters by measuring a single objective metric which is the output of an ML model. For example, Vizier selects the number of hidden layers and their sizes, an optimizer and its learning rate, with the goal of maximizing model accuracy.
- When hyperparameters are evaluated, models are trained and evaluated on splits of the data set. If evaluation metrics are streamed to Vizier (e.g. as a function of epoch) as the model is trained, Vizier’s early stopping algorithms can predict the final objective value, and recommend which unpromising trials should be early stopped. This conserves compute resources and speeds up convergence.
- Oftentimes, models are tuned sequentially on different data sets. Vizier’s built in transfer learning learns priors from previous hyperparameter tuning studies, and leverages them to converge faster on subsequent hyperparameter tuning studies.
- AutoML is a variant of #1, where Vertex Vizier performs both model selection, and also tunes architectures/non-architecture modifying hyperparameters. AutoML usually requires more code on top of Vertex Vizier (to ingest data etc), but Vizier is in most cases the “engine” behind the process. AutoML is implemented by defining a tree like (DAG) search space, rather than a “flat” search space (like in #1). Note that you can use DAG search spaces for any other purpose where searching over a hierarchical space makes sense.
- There are times when you may wish to optimize more than one metric. For example, we would like to optimize model accuracy, while minimizing model latency. Vizier can find the Pareto frontier, which presents tradeoffs for multiple metrics, allowing users to choose the appropriate tradeoff. Simple example: I want to make a more accurate model, but would like to minimize serving latency. I do not know ahead of time what’s the tradeoff between the two metrics. Vizier can be used to explore and plot a tradeoff curve, so users can select on the most appropriate one. For example, “a latency decrease of 200ms will only decrease accuracy by 0.5%”
Google Vizier is all yours with Vertex AI
Google published the Vizier research paper in 2017, sharing our work and use cases for black-box optimization—i.e. The process of finding the best settings for a bunch of parameters or knobs when you can’t peer inside a system to see how well the knobs are working. The paper discusses our requirements, infrastructure design, underlying algorithms, and advanced features such as transfer learning that the service provides. Vizier has been essential to our progress with machine learning at Google, which is why we are so excited to make it available to you on Vertex AI.
Vizier has already tuned millions of ML models at Google, and its algorithms are continuously improved for faster convergence and handling of real-life edge cases. Vertex Vizier’s models are very well calibrated and are self-tuning (they adapt to user data), and offer unique power features, such as hierarchical search spaces and multi-objective optimization. We believe Vertex Vizier’s set of features is a unique capability to Google Cloud, and look forward to optimizing the quality of your models by automatically tuning hyperparameters for you.
To learn more about Vertex Vizier, check out these docs and if you are interested in what’s coming in machine learning over the next five years, tune in to our Applied ML Summit on June 10th, or watch the sessions on demand in your own time.
3020
Of your peers have already watched this video.
16:30 Minutes
The most insightful time you'll spend today!
Predicting Treasury Settlement Failures with ML
BNY Mellon’s Government Securities Services (GSS) business is the sole provider of treasury settlement services in the United States of America. Given its unique market position, GSS is exploring how to help clients improve their forecasting of $70+ billion in daily settlement fails leveraging Google Cloud.
Sarthak Pattanaik, Chief Information Officer, Clearance and Collateral Technology, The Bank of New York Mellon and Victor O’Laughlen, Digital Business Leader, Clearance and Collateral, The Bank of New York Mellon, share how they utilized Google Cloud AI solutions to predict treasury settlement failures.
They take us through the business process, the steps they took to set up their AI solution, and what they have learnt on their journey—not just from a technical standpoint but from a cultural one as well.
BigQuery Explainable AI for Demystifying the Inner Workings of ML Models. Now GA!

6567
Of your peers have already read this article.
2:00 Minutes
The most insightful time you'll spend today!
Explainable AI (XAI) helps you understand and interpret how your machine learning models make decisions. We’re excited to announce that BigQuery Explainable AI is now generally available (GA). BigQuery is the data warehouse that supports explainable AI in a most comprehensive way w.r.t both XAI methodology and model types. It does this at BigQuery scale, enabling millions of explanations within seconds with a single SQL query.
Why is Explainable AI so important? To demystify the inner workings of machine learning models, Explainable AI is quickly becoming an essential and growing need for businesses as they continue to invest in AI and ML. With 76% of enterprises now prioritizing artificial intelligence (AI) and machine learning (ML) over other initiatives in 2021 IT budgets, the majority of CEOs (82%) believe that AI-based decisions must be explainable to be trusted according to a PwC survey.
While the focus of this blogpost is on BigQuery Explainable AI, Google Cloud provides a variety of tools and frameworks to help you interpret models outside of BigQuery, such as with Vertex Explainable AI, which includes AutoML Tables, AutoML Vision, and custom-trained models.
So how does Explainable AI in BigQuery work exactly? And how might you use it in practice?
Two types of Explainable AI: global and local explainability
When it comes to Explainable AI, the first thing to note is that there are two main types of explainability as they relate to the features used to train the ML model: global explainability and local explainability.
Imagine that you have a ML model that predicts housing price (as a dollar amount), based on three features: (1) number of bedrooms, (2) distance to the nearest city center, and (3) construction date.
Global explainability (a.k.a. global feature importance) describes the features’ overall influence on the model and helps you understand if a feature had a greater influence than other features over the model’s predictions. For example, global explainability can reveal that the number of bedrooms and distance to city center typically has a much stronger influence than the construction date on predicting housing prices. Global explainability is especially useful if you have hundreds or thousands of features and you want to determine which features are the most important contributors to your model. You may also consider using global explainability as a way to identify and prune less important features to improve the generalizability of their models.
Local explainability (a.k.a. feature attributions) describes the breakdown of how each feature contributes towards a specific prediction. For example, if the model predicts that house ID#1001 has a predicted price of $230,000, local explainability would describe a baseline amount (e.g. $50,000) and how each of the features contributes on top of the baseline towards the predicted price. For example, the model may say that on top of the baseline of $50,000, having 3 bedrooms contributed an additional $50,000, close proximity to the city center added $100,000, and construction date of 2010 added $30,000, for a total predicted price of $230,000. In essence, understanding the exact contribution of each feature used by the model to make each prediction is the main purpose of local explainability.
What ML models does BigQuery Explainable AI apply to?
BigQuery Explainable AI applies to a variety of models, including supervised learning models for IID data and time series models. The documentation for BigQuery Explainable AI provides an overview of the different ways of applying explainability per model. Note that each explainability method has its own way of calculation (e.g. Shapley values), which are covered more in-depth in the documentation.

Examples with BigQuery Explainable AI
In this next section, we will show three examples of how to use BigQuery Explainable AI in different ML applications:
Regression models with BigQuery Explainable AI
Let’s use a boosted tree regression model to predict how much a taxi cab driver will receive in tips for a taxi ride, based on features such as number of passengers, payment type, total payment and trip distance. Then let’s use BigQuery Explainable AI to help us understand how the model made the predictions in terms of global explainability (which features were most important?) and local explainability (how did the model arrive at each prediction?).
The taxi trips dataset comes from the BigQuery public datasets and is publicly available in the table: bigquery-public-data.new_york_taxi_trips.tlc_yellow_trips_2018.
First, you can train a boosted tree regression model.
CREATE OR REPLACE MODEL bqml_tutorial.taxi_tip_regression_modelOPTIONS (model_type='boosted_tree_regressor',input_label_cols=['tip_amount'],max_iterations = 50,tree_method = 'HIST',subsample = 0.85,enable_global_explain = TRUE) ASSELECTvendor_id,passenger_count,trip_distance,rate_code,payment_type,total_amount,tip_amountFROM`bigquery-public-data.new_york_taxi_trips.tlc_yellow_trips_2018`WHERE tip_amount >= 0LIMIT 1000000
Now let’s do a prediction using ML.PREDICT, which is the standard way in BigQuery ML to make predictions without explainability.
SELECT *FROMML.PREDICT(MODEL bqml_tutorial.taxi_tip_regression_model,(SELECT"0" AS vendor_id,1 AS passenger_count,CAST(5.85 AS NUMERIC) AS trip_distance,"0" AS rate_code,"0" AS payment_type,CAST(55.56 AS NUMERIC) AS total_amount))

But you might wonder—how did the model generate this prediction of ~11.077?
BigQuery Explainable AI can help us answer this question. Instead of using ML.PREDICT, you use ML.EXPLAIN_PREDICT with an additional optional parameter top_k_features. ML.EXPLAIN_PREDICT extends the capabilities of ML.PREDICT by outputting several additional columns that explain how each feature contributes to the predicted value. In fact, since ML.EXPLAIN_PREDICT includes all the output from ML.PREDICT anyway, you may want to consider using ML.EXPLAIN_PREDICT every time instead.
SELECT *FROMML.EXPLAIN_PREDICT(MODEL bqml_tutorial.taxi_tip_regression_model,(SELECT"0" AS vendor_id,1 AS passenger_count,CAST(5.85 AS NUMERIC) AS trip_distance,"0" AS rate_code,"0" AS payment_type,CAST(55.56 AS NUMERIC) AS total_amount),STRUCT(6 AS top_k_features))

The way to interpret these columns is:
Σfeature_attributions + baseline_prediction_value = prediction_value
Let’s break this down. The prediction_value is ~11.077, which is simply the predicted_tip_amount. The baseline_prediction_value is ~6.184, which is the tip amount for an average instance. top_feature_attributions indicates how much each of the features contributes towards the prediction value. For example, total_amount contributes ~2.540 to the predicted_tip_amount.
ML.EXPLAIN_PREDICT provides local feature explainability for regression models. For global feature importance, see the documentation for ML.GLOBAL_EXPLAIN.
Classification models with BigQuery Explainable AI
Let’s use a logistic regression model to show you an example of BigQuery Explainable AI with classification models. We can use the same public dataset as before: bigquery-public-data.new_york_taxi_trips.tlc_yellow_trips_2018.
Train a logistic regression model to predict the bracket of the percentage of the tip amount out of the taxi bill.
CREATE OR REPLACE MODEL bqml_tutorial.taxi_tip_classification_modelOPTIONS(model_type='logistic_reg',input_label_cols=['tip_bucket'],enable_global_explain=true) ASSELECTvendor_id,passenger_count,trip_distance,rate_code,payment_type,total_amount,CASEWHEN tip_amount > total_amount*0.20 THEN '20% or more'WHEN tip_amount > total_amount*0.15 THEN '15% to 20%'WHEN tip_amount > total_amount*0.10 THEN '10% to 15%'ELSE '10% or less'END AS tip_bucketFROM`bigquery-public-data.new_york_taxi_trips.tlc_yellow_trips_2018`WHERE tip_amount >= 0LIMIT 1000000
Next, you can run ML.EXPLAIN_PREDICT to get both the classification results and the additional information for local feature explainability. For global explainability, you can use ML.GLOBAL_EXPLAIN. Again, since ML.EXPLAIN_PREDICT includes all the output from ML.PREDICT anyway, you may want to consider using ML.EXPLAIN_PREDICT every time instead.
SELECT *FROMML.EXPLAIN_PREDICT(MODEL bqml_tutorial.taxi_tip_classification_model,(SELECT"0" AS vendor_id,1 AS passenger_count,CAST(5.85 AS NUMERIC) AS trip_distance,"0" AS rate_code,"0" AS payment_type,CAST(55.56 AS NUMERIC) AS total_amount),STRUCT(6 AS top_k_features))

Similar to the regression example earlier, the formula is used to derive the prediction_value:
Σfeature_attributions + baseline_prediction_value = prediction_value
As you can see in the screenshot above, the baseline_prediction_value is ~0.296. total_amount is the most important feature in making this specific prediction, contributing ~0.067 to the prediction_value, though followed by trip_distance. The feature passenger_count contributes negatively to prediction_value by -0.0015. The features vendor_id, rate_code, and payment_type did not seem to contribute much to the prediction_value.
You may wonder why the prediction_value of ~0.389 doesn’t equal the probability value of ~0.359. The reason is that unlike for regression models, for classification models, prediction_value is not a probability score. Instead, prediction_value is the logit value (i.e., log-odds) for the predicted class, which you could separately convert to probabilities by applying the softmax transformation to the logit values. For example, a three-class classification has a log-odds output of [2.446, -2.021, -2.190]. After applying the softmax transformation, the probability of these class predictions is [0.9905, 0.0056, 0.0038].
Time-series forecasting models with BigQuery Explainable AI

Explainable AI for forecasting provides more interpretability into how the forecasting model came to its predictions. Let’s go through an example of forecasting the number of bike trips in NYC using the new_york.citibike_trips public data in BigQuery.
You can train a time-series model ARIMA_PLUS:
CREATE OR REPLACE MODEL bqml_tutorial.nyc_citibike_arima_modelOPTIONS(model_type = 'ARIMA_PLUS',time_series_timestamp_col = 'date',time_series_data_col = 'num_trips',holiday_region = 'US') ASSELECTEXTRACT(DATE from starttime) AS date,COUNT(*) AS num_tripsFROM`bigquery-public-data.new_york.citibike_trips`GROUP BY dateNext, you can first try forecasting without explainability using ML.FORECAST:SELECT*FROMML.FORECAST(MODEL bqml_tutorial.nyc_citibike_arima_model,STRUCT(365 AS horizon, 0.9 AS confidence_level))
This function outputs the forecasted values and the prediction interval. Plotting it in addition to the input time series gives the following figure.

But how does the forecasting model arrive at its predictions? Explainability is especially important if the model ever generates unexpected results.
With ML.EXPLAIN_FORECAST, BigQuery Explainable AI provides extra transparency into the seasonality, trend, holiday effects, level (step) changes, and spikes and dips outlier removal. In fact, since ML.EXPLAIN_FORECAST includes all the output from ML.FORECAST anyway, you may want to consider using ML.EXPLAIN_FORECAST every time instead.
SELECT*FROMML.EXPLAIN_FORECAST(MODEL bqml_tutorial.nyc_citibike_arima_model,STRUCT(365 AS horizon, 0.9 AS confidence_level))

Compared to the previous figure which only shows the forecasting results, this figure shows much richer information to explain how the forecast is made.
First, it shows how the input time series is adjusted by removing the spikes and dips anomalies, and by compensating the level changes. That is:
time_series_adjusted_data = time_series_data - spikes_and_dips - step_changes
Second, it shows how the adjusted input time series is decomposed into different components such as both weekly and yearly seasonal components, holiday effect component and trend component. That is
time_series_adjusted_data = trend + seasonal_period_yearly + seasonal_period_weekly + holiday_effect + residual
Finally, it shows how these components are forecasted separately to compose the final forecasting results. That is:
time_series_data = trend + seasonal_period_yearly + seasonal_period_weekly + holiday_effect
For more information on these time series components, please see the documentation here.
Conclusion
With the GA of BigQuery Explainable AI, we hope you will now be able to interpret your machine learning models with ease.
Thanks to the BigQuery ML team, especially Lisa Yin, Jiashang Liu, Amir Hormati, Mingge Deng, Jerry Ye and Abhinav Khushraj. Also thanks to the Vertex Explainable AI team, especially David Pitman and Besim Avci.
Seven-Eleven Japan Leverages Google Cloud’s Performance and Speed for Real-time Business Insights

6841
Of your peers have already read this article.
4:00 Minutes
The most insightful time you'll spend today!
With the rise of technologies like smartphones, retailers have felt the pressure to meet evolving consumer needs and expectations. Seven-Eleven Japan(“SEJ”) has long been on the forefront of this thanks to the way they develop and invest in IT. However, in recent years, Japan’s leading convenience store chain has struggled to maintain its complex legacy systems at the rate needed to keep up with today’s rapid digitization, spurred on by the increasing proliferation of smartphones and an IT vendor-dependent structure.
Legacy systems limiting real-time responsiveness and innovation
Since its early days, SEJ has been proactive in adopting information technology, mainly relying on technology solutions from Japan’s leading vendors. But as the systems have grown, key business issues have been resolved using a vendor-dependent structure rather than being driven by SEJ’s own needs.
Datasets and business logic were combined and built into legacy environments, gradually leading to data silos. As a result, data was distributed across multiple systems, causing a variety of problems, including the inability to efficiently retrieve data when needed, delays in accessing data collected in individual stores, and difficulties taking measurements at the right time in business operations that require real-time responsiveness.
Connecting different systems also takes time and money, and the lead time for introducing new services—from planning to development and launch—has been longer than expected.
To solve these problems, SEJ’s IT department built “Seven Central”—a new platform for practical data use launched in 2020 to support the company’s future IT strategies and digital transformation initiatives.
At its core, Seven Central’s ultimate purpose is to allow real-time data views. Versatile, real-time datasets—such as point-of-sale (POS) data from 7-Eleven stores—are consolidated into a centralized location in the cloud. They created a simple data mart that provides data via an API to enable them to respond more quickly to requests from individual departments.
“In such uncertain times, it’s vital to use data to make quick decisions,” says Izuru Nishimura, Executive Officer and Head of ICT Department. “Each department across the entire company will be able to gain an immediate understanding of the situation based on the most up-to-date data and respond accordingly. This is why we built Seven Central.”
Google Cloud selected to help SEJ build and grow their data cloud
Today’s rapidly changing business environment has also highlighted the risk of IT support becoming a bottleneck. The long-term strategy is to gradually expand the datasets managed and collected in Seven Central according to business needs.
In the first phase, SEJ collected POS data from all 21,000+ stores to enable real-time analysis. Moving forward, they would like to collect other relevant data—for example, unstructured data, such as images and videos, or master datasets that are currently stored externally.
Google Cloud was already a top contender when SEJ started developing Seven Central in 2019. They compared various public cloud services besides Google Cloud, focusing on three main capabilities.
“We placed particular emphasis on service scalability to drive future digital transformation; security when handling data, which is the lifeline of our company; and finally, openness,” says Nishimura. He emphasizes that openness was perhaps the most important factor for choosing Google Cloud. Breaking away from the negative aspects of an entirely vendor-dependent system enabled them to build an agile development system with multiple vendors.
Google Cloud technologies including BigQuery and API management platform, Apigee, play a vital role in Seven Central. BigQuery’s high-speed processing at petabyte scale and fully managed infrastructure helped keep costs low during development and verification.
“Data is stored in a way that allows you to share it easily across organizations, which helps solve the issue of data silos from the perspective of scalability. I also like the fact there are some interesting features that could be used in the future—like BigQuery ML, which enables machine learning on BigQuery,” says Nishimura.
Apigee allows SEJ to separate datasets and business logic, which is one of the key points of Seven Central. While the trend these days is to standardize interfaces using an API, the reality tends to involve many different APIs rather than the introduction of one unified API. With Apigee, SEJ provides a single unified API for all of its data cloud, and they can now understand what data is used thanks to Apigee’s API usage visualizations.
“Right now, we collect data from all 21,000+ stores,” says Nishimura. “But in anticipation of a future expansion in business operations, we have designed a system that can scale up and run without issue, even if we were to have 30,000 stores, with 1,000 customers per store per day, purchasing five items per person.”
Real-time insights with BigQuery and Cloud Spanner
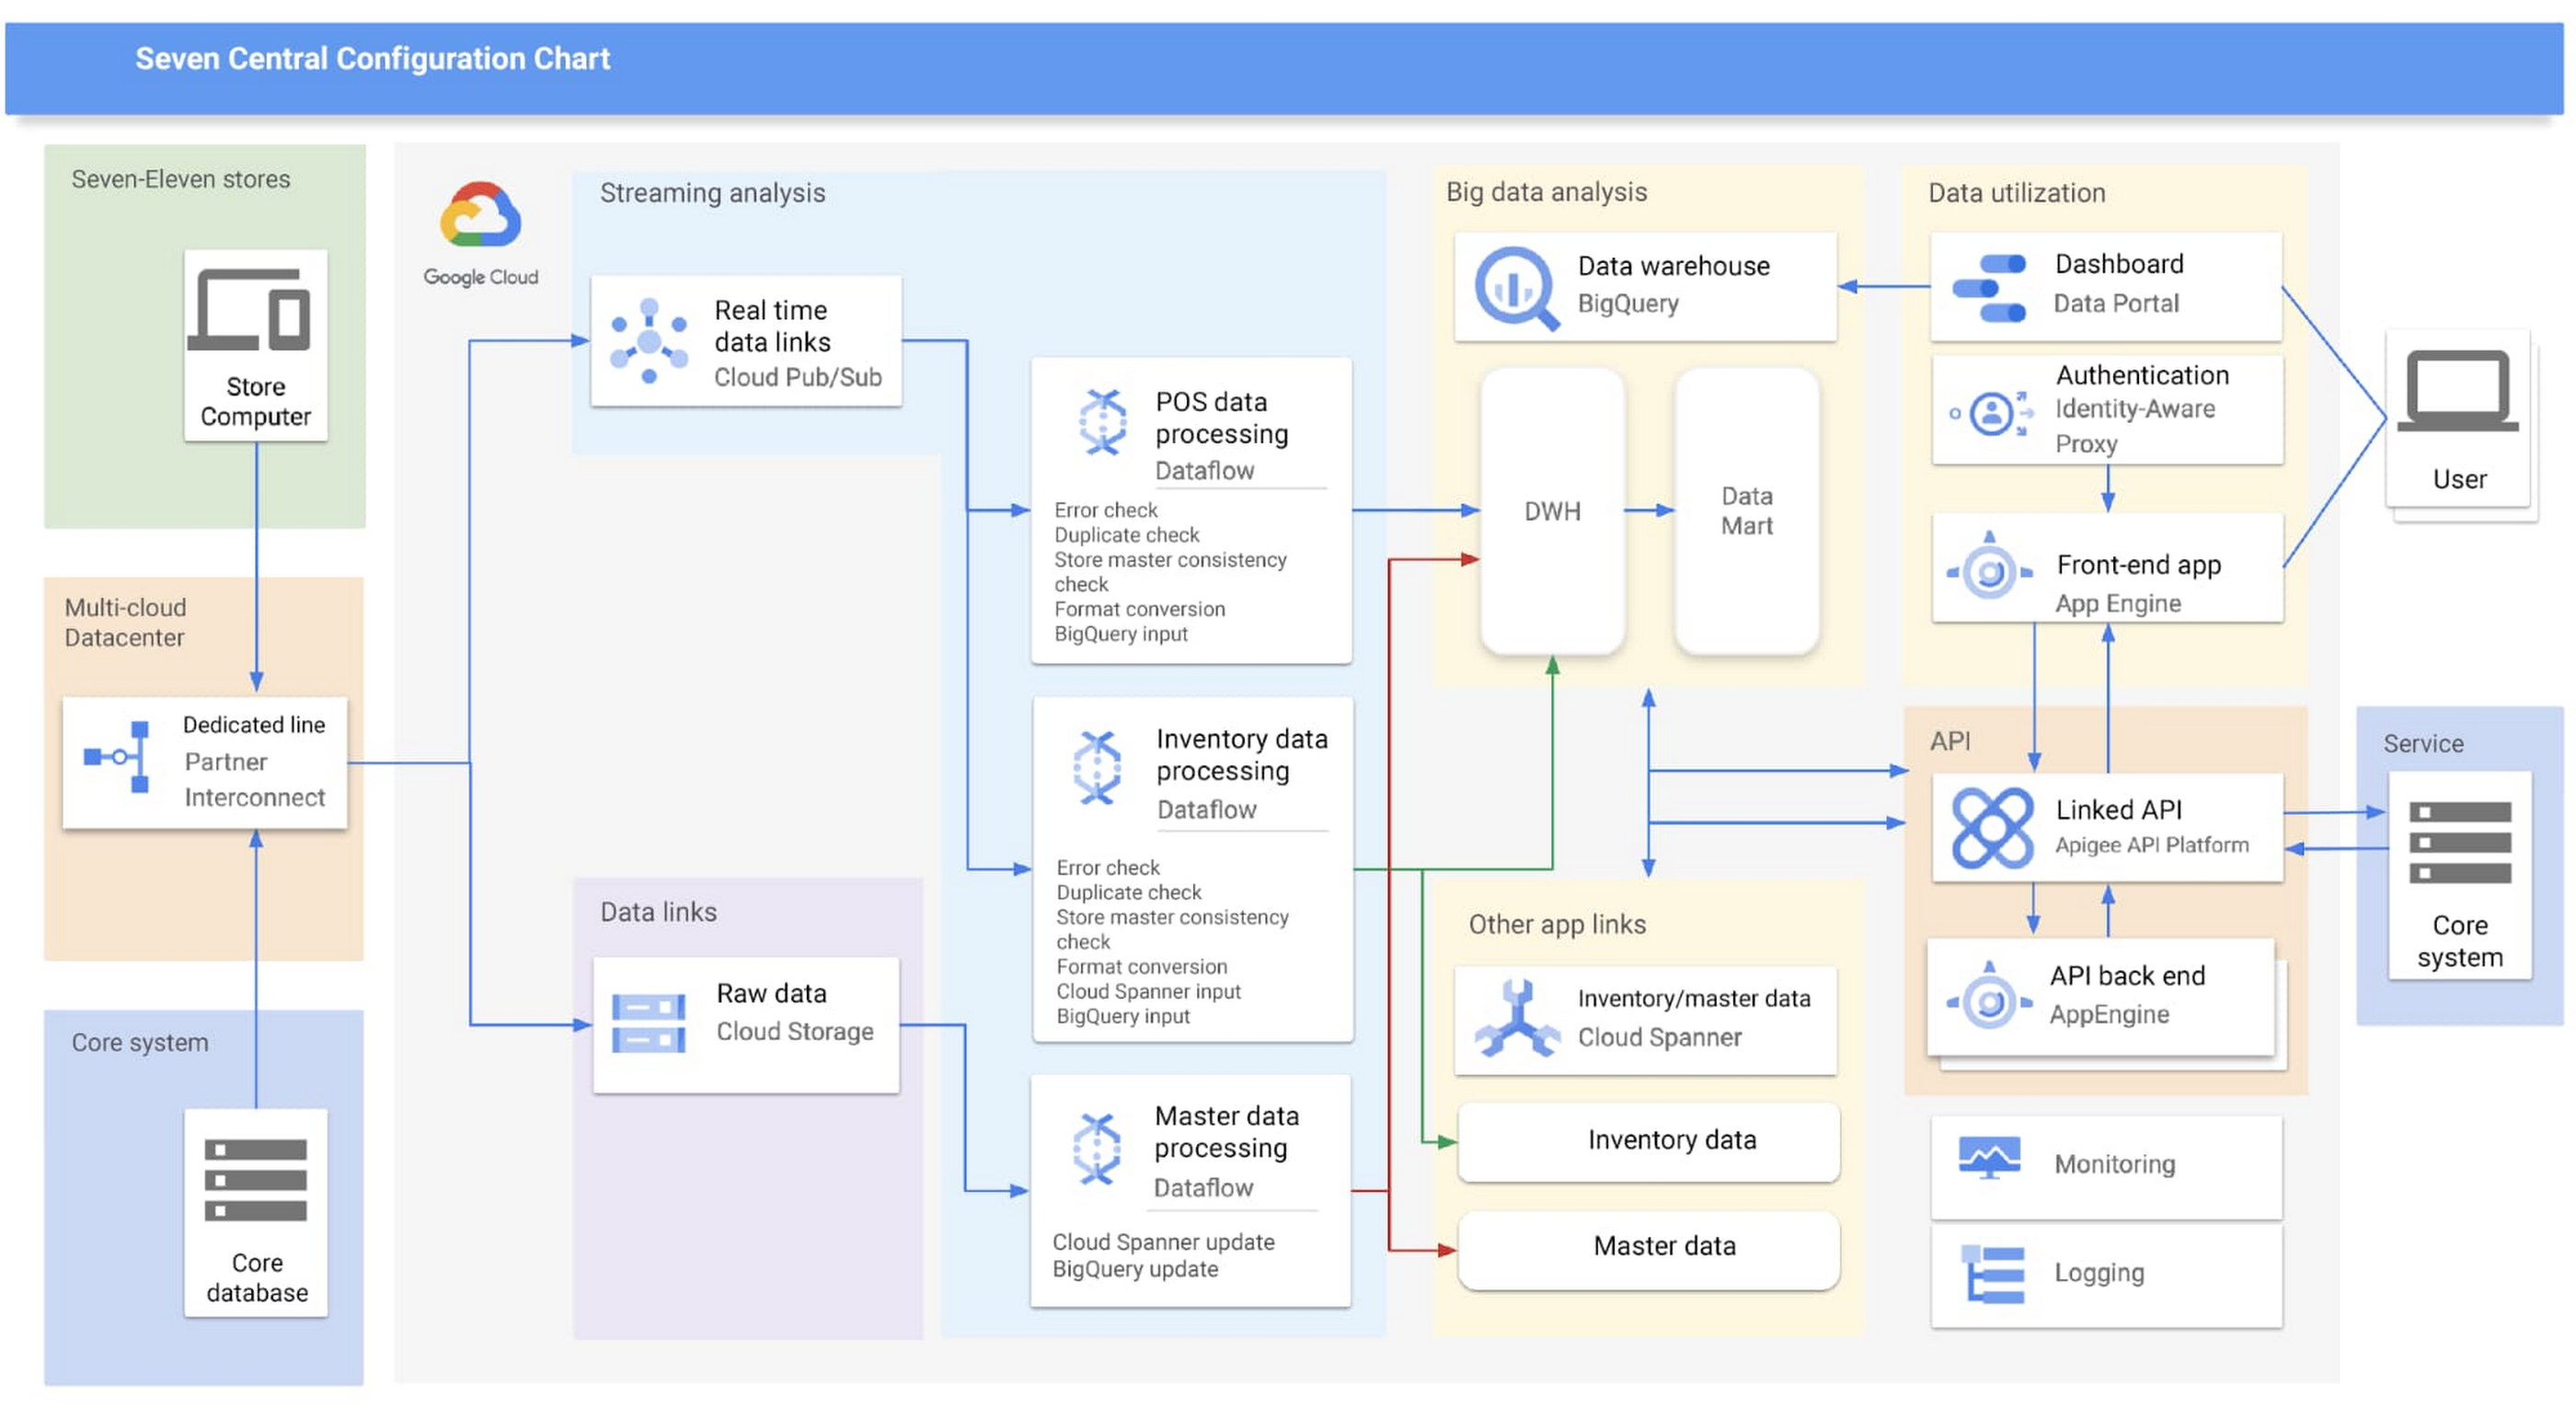
Google Cloud partner Cloud Ace came on board early in the planning phases. Based on their recommendations, SEJ decided to continue making full use of BigQuery to analyze data collected from all 21,000+ stores throughout Japan, while also using Cloud Spanner’s availability, near-unlimited scalability and transactional consistency to help achieve the real-time results needed for the project.
“Given that both the data and the regularity with which it is accessed are expected to steadily increase in the future, we chose Cloud Spanner as backend storage for data delivery via API. We consider it a good choice,” says Shota Kikuchi, General Manager, Consulting Department, Technology Division, Cloud Ace Co., Ltd.
Finally, they chose to use Google Cloud’s Stream Analytics Solutions messaging service for collecting POS data in real time, which can then be put to immediate use with Cloud Spanner and BigQuery.
High-speed responses exceed targets and create new value
Seven Central went live in September 2020 with surprising results.
They initially set a target time of one hour from when a customer makes a purchase to the point when Seven Central can use that data. But when the final system was first tried—it took barely a minute. Moving forward they estimate that the latest inventory data from the service side will become available within a few minutes of being added to the system.
“This is real innovation, and I must admit that I am quite surprised. As well as being able to solve existing issues, we also hope it will lead to new improvements and services that have been unimaginable up until now,” says Nishimura.
The team hopes to roll out the Seven Central platform in all companies affiliated with Seven & i Holdings—not just SEJ. They also plan to explore Google Cloud AI and machine learning technologies to take on challenges in new areas. For example, they are investigating the idea of clustering individual stores using BigQuery ML.
Seven Central has already attracted attention from many departments and received a lot of requests. Nishimura and his team say they hope to continue to grow Seven Central while still observing their fundamental principles—not including business logic, maintaining real-time results, and staying true to the uniqueness of SEJ.
Learn more about Google Cloud smart analytics solutions.
More Relevant Stories for Your Company

Candidate360: Google Cloud and Deloitte Product Improves Universities’ Enrollment and Admission Processes
Given the May 1 deadline for students to enroll, colleges and universities have been carefully watching the numbers of students who put down deposits and commit to a school. Like nearly every other sector in the U.S., colleges and universities have been hit hard by the pandemic and economic downturn,



Google’s AutoML Vision Helps AES Fight Climate Change
Global warming is one of the big challenges of our times; if not the biggest challenge of our times, says Andres Gluski, President and CEO, AES, a Fortune 500 company that generates and distributes renewable energy in 15 countries to help end climate change. AES relies on Google's AutoML Vision

ESG Report: Economic Advantages of Google BigQuery OnDemand Serverless Analytics
Traditional big data solutions require a significant upfront investment, ongoing maintenance of hardware and software, and manual provisioning to match compute and storage resources with demand. Google’s serverless analytics warehouse does away with all that extra work, helping businesses focus on what matters most: getting value from their data. Enterprise

Interpreting ML Models with Explainable AI
We often trust our high-accuracy ML models to make decisions for our users, but it’s hard to know exactly why or how these models came to specific conclusions. Explainable AI provides a suite of tools to help you interpret your ML model’s predictions. Listen to this discussion regarding how to
