





The Query Execution Graph: Your Key to Better BigQuery Analytics

3079
Of your peers have already read this article.
2:30 Minutes
The most insightful time you'll spend today!
BigQuery offers strong query performance, but it is also a complex distributed system with many internal and external factors that can affect query speed. When your queries are running slower than expected or are slower than prior runs, understanding what happened can be a challenge.
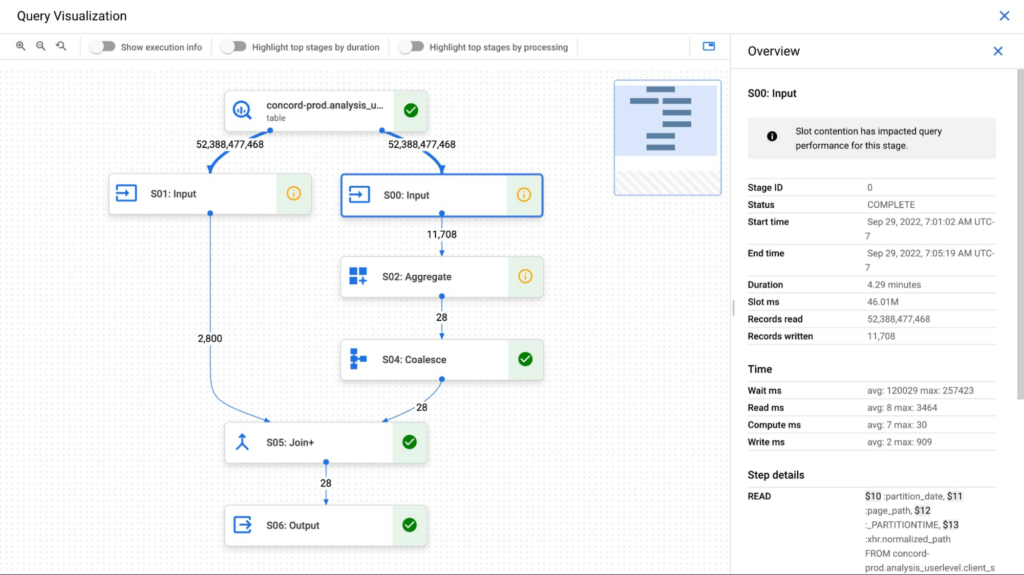
The query execution graph provides an intuitive interface for inspecting query execution details. By using it, you can review the query plan information in graphical format for any query, whether running or completed.
You can also use the query execution graph to get performance insights for queries. Performance insights provide best-effort suggestions to help you improve query performance. Since query performance is multi-faceted, performance insights might only provide a partial picture of the overall query performance.
Execution graph
When BigQuery executes a query job, it converts the declarative SQL statement into a graph of execution, broken up into a series of query stages, which themselves are composed of more granular sets of execution steps. The query execution graph provides a visual representation of the execution stages and shows the corresponding metrics. Not all stages are made equal. Some are more expensive and time consuming than others. The execution graph provides toggles for highlighting critical stages, which makes it easier to spot the potential performance bottlenecks in the query.
Query performance insights
In addition to the detailed execution graph BigQuery also provides specific insights on possible factors that might be slowing query performance.
Slot contention
When you run a query, BigQuery attempts to break up the work needed by your query into tasks. A task is a single slice of data that is input into and output from a stage. A single slot picks up a task and executes that slice of data for the stage. Ideally, BigQuery slots execute tasks in parallel to achieve high performance. Slot contention occurs when your query has many tasks ready for slots to start executing, but BigQuery can’t get enough available slots to execute them.
Insufficient shuffle quota
Before running your query, BigQuery breaks up your query’s logic into stages. BigQuery slots execute the tasks for each stage. When a slot completes the execution of a stage’s tasks, it stores the intermediate results in shuffle. Subsequent stages in your query read data from shuffle to continue your query’s execution. Insufficient shuffle quota occurs when you have more data that needs to get written to shuffle than you have shuffle capacity.
Data input scale change
Getting this performance insight indicates that your query is reading at least 50% more data for a given input table than the last time you ran the query and hence experiencing query slowness. You can use table change history to see if the size of any of the tables used in the query has recently increased.
What’s next?
We continue to work on improving the visualization of the graph. We are working on adding additional metrics to each step and adding more performance insights that will make query diagnosis significantly easier. We are just getting started.
How Vertex AI Helps Coca-Cola Bottlers Japan Analyze Billions of Data Records

6198
Of your peers have already read this article.
4:00 Minutes
The most insightful time you'll spend today!
Japan is home to millions of vending machines installed on streets and in buildings, sports stadiums and other facilities. Vending machine owners and operators, including beverage manufacturers, stock these machines with different product combinations depending on location and demand. For example, they primarily display coffee and energy drinks in machines placed in offices and sports drinks and mineral water in machines at sports facilities. The combinations also vary by season: for example, owners and operators may display cold beverages in summer and hot beverages in winter.
Traditionally, vending machine operators have relied on the intuition and experience of sales managers to determine the optimum product mix for each vending machine. However, in recent years, manufacturers such as Coca-Cola Bottlers Japan (CCBJ) have turned to data to analyze and make strategic decisions about when and where to locate products in machines.
CCBJ is the number one Coca-Cola bottler in Asia and vending machines comprise the bulk of its business. The organization operates about 700,000 machines across Tokyo, Osaka, Kyoto, and 35 prefectures. Minori Matsuda, Google Developer Expert and also Data Science Manager at CCBJ, says “The billions of data records collected from 700,000 physical devices are a great asset and a treasure trove we can take advantage of.”
Minori points out that when considering the mix of products in vending machines in sporting facilities, the managers naturally assume sports drinks would generally sell well. However, analysis of purchase data – including hot drinks and hot drinks plus sports drinks – found many parents purchased sweet drinks such as milk tea when they attended games or sessions involving their children. “Analyzing data gives us new discoveries and, by using catchy storytelling techniques from exploratory data analysis, we are instilling a data culture within our company,” he says. “It’s worth creating by looking at facts rather than making assumptions!”
Minori believes that to analyze the vast amount of data collected from more than 700,000 vending machines, the business needs a powerful analytical platform. However, until recently, CCBJ had to extract data for analysis from its core systems, load this data into a warehouse it created and perform the required analyses. The billions of records of data generated across the fleet – including transaction data – exposed some challenges for traditional analysis platforms. They could not efficiently process data at a considerable scale: it could take a day to return results and required extensive maintenance due to the size.
CCBJ considered building a machine learning (ML) platform as a layer on top of existing systems in August 2020 and opted for Google Cloud the following month. “I feel that Google Cloud has an edge in all products and is very well thought out,“ says Minori, noting the scalability and cost of the platform allow the business to take a ‘trial and error’ approach to achieve the best outcomes from ML. Google Cloud also delivered the required visibility and flexibility to help the business deliver change every day against key performance indicators.
MLOps platform streamlines ML pipeline development
CCBJ built its analysis platform using Vertex AI (formerly AI Platform) centered on a BigQuery analytics data warehouse, and partly using AutoML for tabular data. “We have created a prediction model of where to place vending machines, what products are lined up in the machines and at what price, how much they will sell, and implemented a mechanism that can be analyzed on a map,” says Minori, adding that building the platform with Google Cloud was not difficult. “We were able to realize it in a short period of time with a sense of speed, from platform examination to introduction, prediction model training, on-site proof of concept to rollout.”
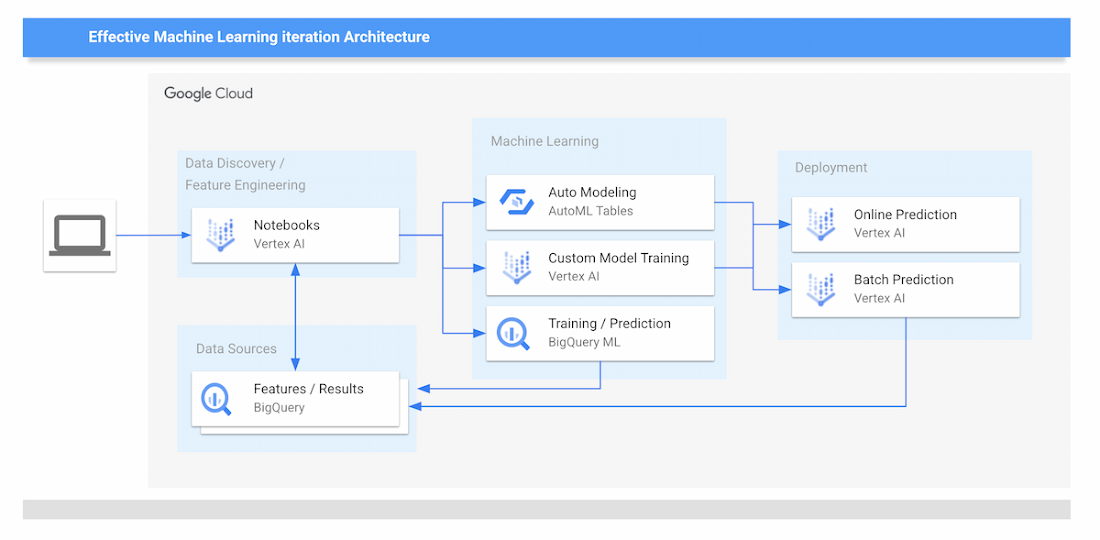
The new data analytics platform of CCBJ consists of the following parts:
Data Sources
- The data collected from the vending machines are all stored on BigQuery.
Data Discovery and Feature Engineering
- Minori and other data scientists at CCBJ are using Vertex Notebooks, where they access the data on BigQuery by executing SQL queries directly from the Notebooks. This environment is used for the data discovery process and feature engineering.
ML Training
- For ML training, CCBJ uses AutoML for Tabular data, Custom model training on Vertex AI, and BigQuery ML. AutoML gives model performance with AUC curves and also feature importance graphs.
ML Prediction and Serving
- For ML prediction, CCBJ uses Online Prediction for AutoML models and Online Prediction for custom models for real-time prediction when the salesperson finds the interesting point
- Batch Prediction is used for generating a large prediction map that covers the whole country
- The prediction results are distributed to sales managers’ tablets
CCBJ started constructing the platform in September 2020, and completed it within a month. The business has conducted proofs of concept at its base in Kyoto since February 2021, and since April, has rolled out the platform to sales managers in 35 prefectures in one metropolitan area. “Data analysis is built into the day-to-day routines of sales managers with 100% utilization,” says Minori. “They can utilize the prediction results on tablets that were able to achieve pretty high accuracy from the start.”
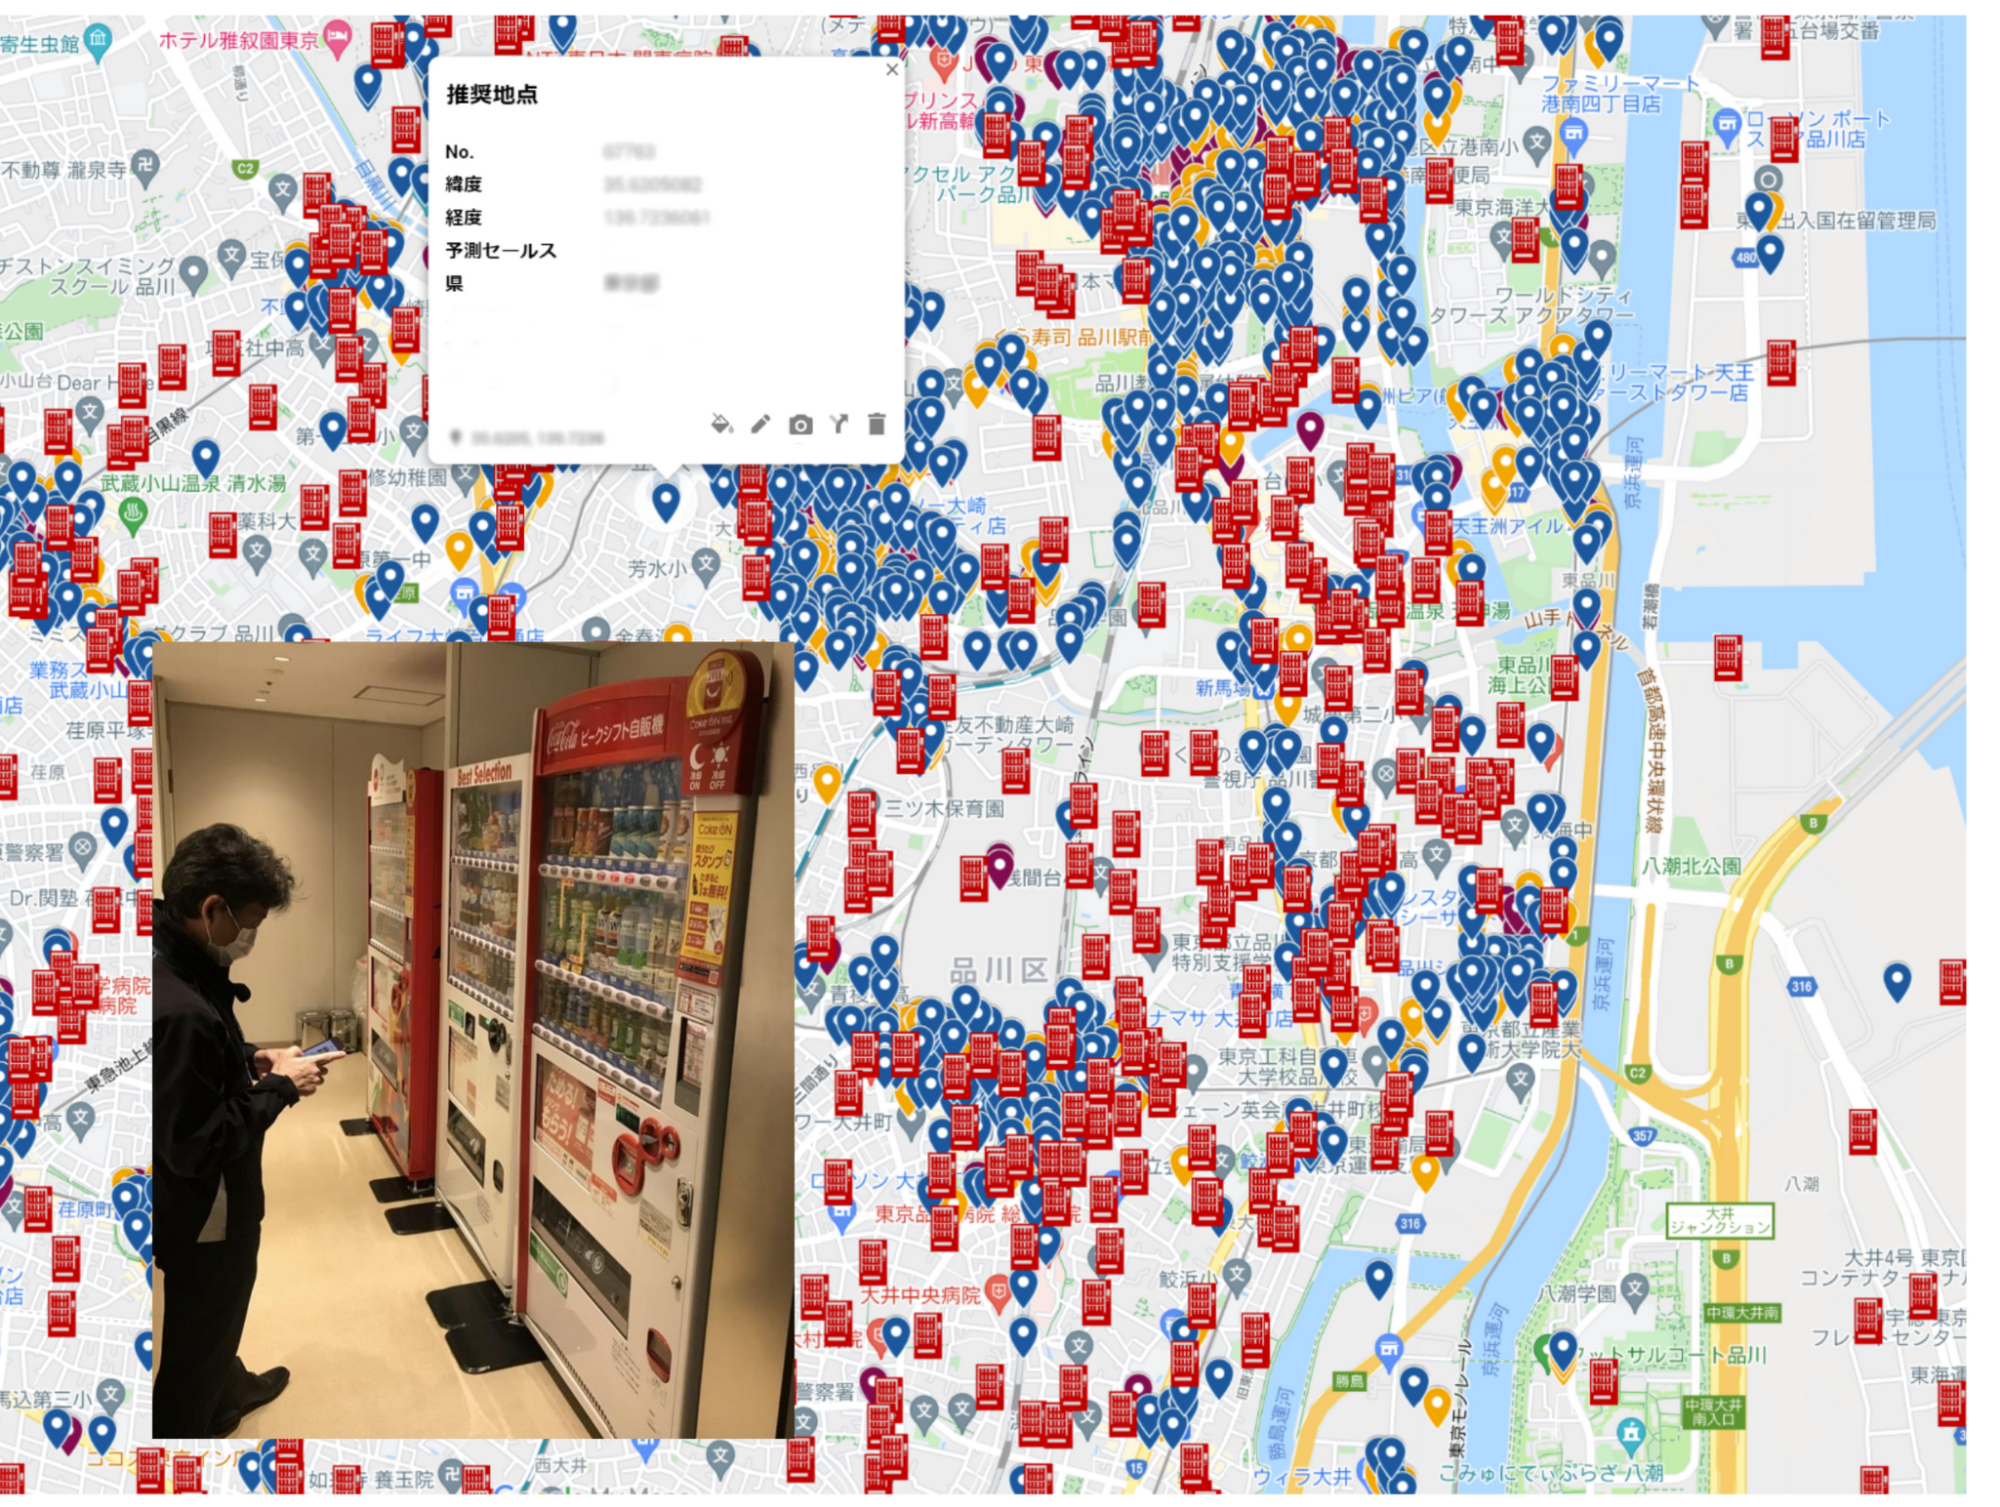
The hardest part was the education of sales managers in the field; having them understand the reasoning behind the ML prediction results for particular outcomes, so they could be convinced to make use of the results. “For example, regarding a new installation location predicted by the model, it seemed that there was no effective information for installation from the map information, but when I actually went there, there was a motorcycle shop and it was a place where young people who like motorcycles gathered,” says Minori. “Or there is a small meeting place where the elderly in the neighborhood are active.
“In many cases, new discoveries that cannot be understood from map information alone can be derived from the data.”
Minori also points to a phenomenon whereby humans pursued and confirmed factors inferred by the model – meaning that once they experienced analysis and it worked effectively, they asked why the same type of analysis or prediction could not be undertaken next time. The resulting cycle of more inquiries generated, more information gathered and more data captured for analysis meant the accuracy of results was improved.
Minori describes Vertex AI as having a number of strengths in helping CCBJ build a ML data analysis platform. “One of the major merits of Vertex AI was that we were able to realize MLOps that streamlines the entire development life cycle from construction of the ML pipeline to its execution,” he says.
With near real-time data analysis through Google Cloud, CCBJ teams can spend time developing strategies rather than waiting for data requested from the IT systems department. Exploratory data analysis is also considerably easier as repeated trial and error has greatly improved the accuracy of analyses. Before we used Machine Learning, most machine placement processes were done by human senses, by looking at a map to find the suggestion points. By using Machine Learning to generate a massive number of placement point suggestions, the efficiency of routing of salespeople has been dramatically improved.
In the future, CCBJ aims to automate the continuous training pipeline with Vertex AI. “CCBJ is a tech company that operates in the food industry,” says Minori. With the organization operating a vending machine network of 700,000 units, it would like to create new businesses based on utilization and analyzing data. Some of these businesses may be based on Sustainable Development Goals (SDGs) initiatives such as the utilization of recycled PET bottles, measures to prevent food loss and ways of using vending machines to contribute to local communities, which we have been working on for some time. It would be interesting if we could collaborate with Google Cloud on these in the future.”

Countries can Tackle Food Wastage Crisis Using Google’s Data Analytics

4977
Of your peers have already read this article.
4:00 Minutes
The most insightful time you'll spend today!
With over ⅓ of the food in the USA ending up as waste according to the USDA, it is a compelling challenge to address this travesty. What will happen to hunger, food prices, trash reduction, water consumption, and overall sustainability when we stop squandering this abundance?

Beginning with the departure from the farm to the back of the store, the freshness clock continues to run. Grocers work very hard to purchase high quality produce items for their customers and the journey to the shelf can take a toll in both quality and remaining shelf life. Suppliers focus on delivering their items through the arduous supply chain journey to the store with speed and gentle handling. The baton is then passed to the store to unload and present the items to customers with care to sell through each lot significantly before the expiration or sell by date. This is to ensure that the time spent in the customer’s home is ample to ensure a great eating experience as well. Food waste is a farm to fork problem with opportunity at every step of the chain, but today we will focus on the segment that the grocery industry oversees.
With the complexities of weather, geopolitical issues, distribution, sales variability, pricing, promotions, and inventory management, it seems daunting to impact waste. Fortunately, data analytics and machine learning in the cloud is a powerful weapon in the fight against food waste. Data Scientists harness knowledge to draw meaning from data turning that data into decision driving information.
One key Google has been working on to accelerate value is to break down data silos and leverage machine learning to realize better outcomes, using our Google Data Cloud platform. This enables better planning through demand forecasting, Inventory management, assortment planning, and dynamic pricing and promotions.
That sounds great but how does it work?
Let’s walk through a day in the life journey to see how the integrated Google Data Cloud platform can change the game for good. Our friendly fictitious grocer FastFreshFood is committed to selling high quality perishable items to their local market. Their goal is to minimize food waste and maximize revenue by selling as much perishable fresh food as possible before the sell by date. Our fictitious grocer in partnership with Google Cloud could build a solution that will take a significant bite out of their food waste volume and better satisfy customers.
- Sales through the register and online are processed in real time with Datastream, Dataflow to keep an accurate perpetual inventory by minute of every single item.
- A Demand forecasting model using machine learning algorithms in BigQuery then identifies needs for back room replenishment, so Direct Store Delivery and daily store Distribution Centers manage ordering more efficiently to ensure just the right amount of each product each day.
- Realtime reporting dashboards in Looker with alerting capabilities enable the system to operate with strong associate support and understanding. The reporting suite shows inventory levels into the future, daily orders, and at risk items.
The pricing algorithm could also alert store leadership concerning any items that will not sell through and suggest real time in store specials resulting in zero waste at shelf and maximized revenue.

This approach is not just for perishable categories and is a pattern that works well for in-store produced items and center store items. The key point is that by bringing ML/AI to difficult business problems grocers are reinventing what is possible for both their profitability and sustainability.
The technical implementation of this design pattern in Google Cloud leverages Datastream, Dataflow, BigQuery and Looker products, it is detailed in a technical tutorial accompanying this blog post.
In partnership with Google Cloud, retailers can solve complex problems with innovative solutions to achieve higher quality, lower cost, and provide great customer experiences. To learn more from this and other use cases, please visit our Design Patterns website.
Curious to learn more?
We’re excited to share what we know about tackling food waste at Google, a topic we’ve been working on in the last decade as we’ve embarked on reducing our own food waste in our operations in over 50 countries in the world. The Google Food for Good team works exclusively on Google Cloud Platform with our partners on this topic. Two additional articles below.
Silos are for food, not for data – tackling food waste with technology
This business Cloud blog directly addresses information silos that currently exist across many nodes in the food system and how to break down cultural and organizational barriers to sharing.
“Unsiloing” data to work toward solving food waste and food insecurity
This follow-on technical Cloud blog articulates the path to setting up data pipelines, translating between data sets (not everyone calls a tomato a tomato!) and making sense of emergent insights.
Updating Twitter’s Ad Engagement Analytics Platform for the Modern Age

3098
Of your peers have already read this article.
3:30 Minutes
The most insightful time you'll spend today!
As part of the daily business operations on its advertising platform, Twitter serves billions of ad engagement events, each of which potentially affects hundreds of downstream aggregate metrics. To enable its advertisers to measure user engagement and track ad campaign efficiency, Twitter offers a variety of analytics tools, APIs, and dashboards that can aggregate millions of metrics per second in near-real time.
In this post, you’ll get details on how the Twitter Revenue Data Platform engineering team, led by Steve Niemitz, migrated their on-prem architecture to Google Cloud to boost the reliability and accuracy of Twitter’s ad analytics platform.
Deciding to migrate
Over the past decade, Twitter has developed powerful data transformation pipelines to handle the load of its ever-growing user base worldwide. The first deployments for those pipelines were initially all running in Twitter’s own data centers. The input data streamed from various sources into Hadoop Distributed File System (HDFS) as LZO-compressed Thrift files in an Elephant Bird container format. The data was then processed and aggregated in batches by Scalding data transformation pipelines. Then, aggregation results were output into Manhattan, Twitter’s homegrown distributed key-value store, for serving. Additionally, a streaming system using Twitter’s homegrown systems Eventbus (a messaging tool built on top of DistributedLog), Heron (a stream processing engine), and Nighthawk (a sharded Redis deployment) powered the real-time analytics that Twitter had to provide, filling the gap between the current time and the last batch run.
While this system consistently sustained massive scale, its original design and implementation was starting to reach some limits. In particular, some parts of the system that had grown organically over the years were difficult to configure and extend with new features. Some intricate, long-running jobs were also unreliable, leading to sporadic failures. The legacy end-user serving system was very expensive to run and couldn’t support large queries.
To accommodate for the projected growth in user engagement over the next few years and streamline the development of new features, the Twitter Revenue Data Platform engineering team decided to rethink the architecture and deploy a more flexible and scalable system in Google Cloud.
Platform modernization: First iteration
In the middle of 2017, Steve and his team tackled the first redesign iteration of its advertising data platform modernization, leading to Twitter’s collaboration with Google Cloud.
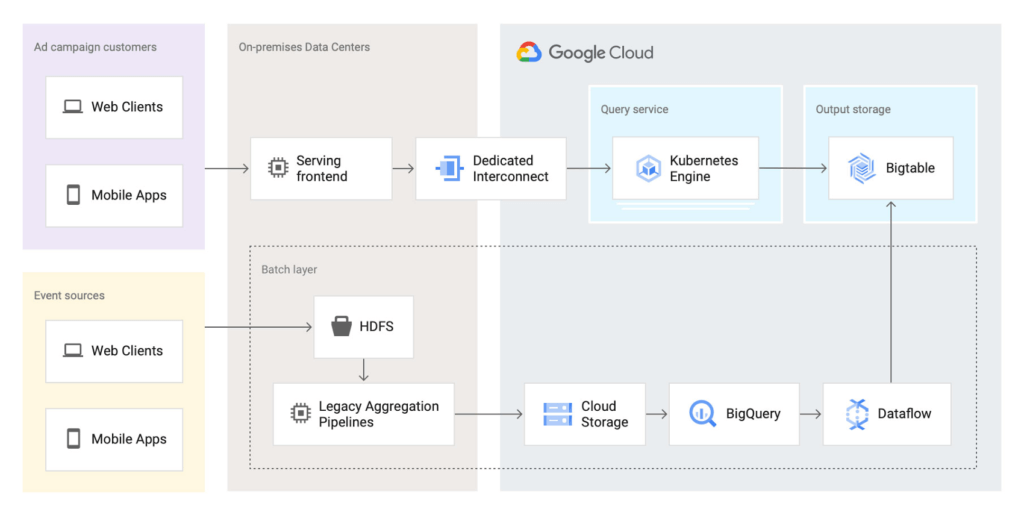
At first, the team left the data aggregation legacy Scalding pipelines unchanged and continued to run them in Twitter’s data centers. But the batch layer’s output was switched from Manhattan to two separate storage locations in Google Cloud:
- BigQuery—Google’s serverless and highly scalable data warehouse, to support ad-hoc and batch queries.
- Cloud Bigtable—Google’s low-latency, fully managed NoSQL database, to serve as a back end for online dashboards and consumer APIs.
The output aggregations from the Scalding pipelines were first transcoded from Hadoop sequence files to Avro on-prem, staged in four-hour batches to Cloud Storage, and then loaded into BigQuery. A simple pipeline deployed on Dataflow, Google Cloud’s fully managed streaming and batch analytics service, then read the data from BigQuery and applied some light transformations. Finally, the Dataflow pipeline wrote the results into Bigtable.
The team built a new query service to fetch aggregated values from Bigtable and process end-user queries. They deployed this query service in a Google Kubernetes Engine (GKE) cluster in the same region as the Bigtable instance to optimize for data access latency.
Here’s a look at the architecture:
This first iteration already brought many important benefits:
- It de-risked the overall migration effort, letting Twitter avoid migrating both the aggregation business logic and storage at the same time.
- The end-user serving system’s performance improved substantially. Thanks to Bigtable’s linear scalability and extremely low latency for data access, the serving system’s P99 latencies decreased from 2+ seconds to 300ms.
- Reliability increased significantly. The team now rarely, if ever, gets paged for the serving system anymore.
Platform modernization: second iteration
With the new serving system in place, in 2019 the Twitter team began to redesign the rest of the data analytics pipeline using Google Cloud technologies. The redesign sought to solve several existing pain points:
- Because the batch and streaming layers ran on different systems, much of the logic was duplicated between systems.
- While the serving system had been moved into the cloud, the existing pain points of the Hadoop aggregation process still existed.
- The real-time layer was expensive to run and required significant operational attention.
With these pain points in mind, the team began evaluating technologies that could help solve them. They considered several open-source stream processing frameworks initially: Apache Flink, Apache Kafka Streams, and Apache Beam. After evaluating all possible options, the team chose Apache Beam for a few key reasons:
- Beam’s built-in support for exactly-once operations at extremely large scale across multiple clusters.
- Deep integration with other Google Cloud products, such as Bigtable, BigQuery, and Pub/Sub, Google Cloud’s fully managed, real-time messaging service.
- Beam’s programming model, which unifies batch and streaming and lets a single job operate on either batch inputs (Cloud Storage), or streaming inputs (Pub/Sub).
- The ability to deploy Beam pipelines on Dataflow’s fully managed service.
The combination of Dataflow’s fully managed approach and Beam’s comprehensive feature set let Twitter simplify the structure of its data transformation pipeline, as well as increase overall data processing capacity and reliability.
Here’s what the architecture looks like after the second iteration:
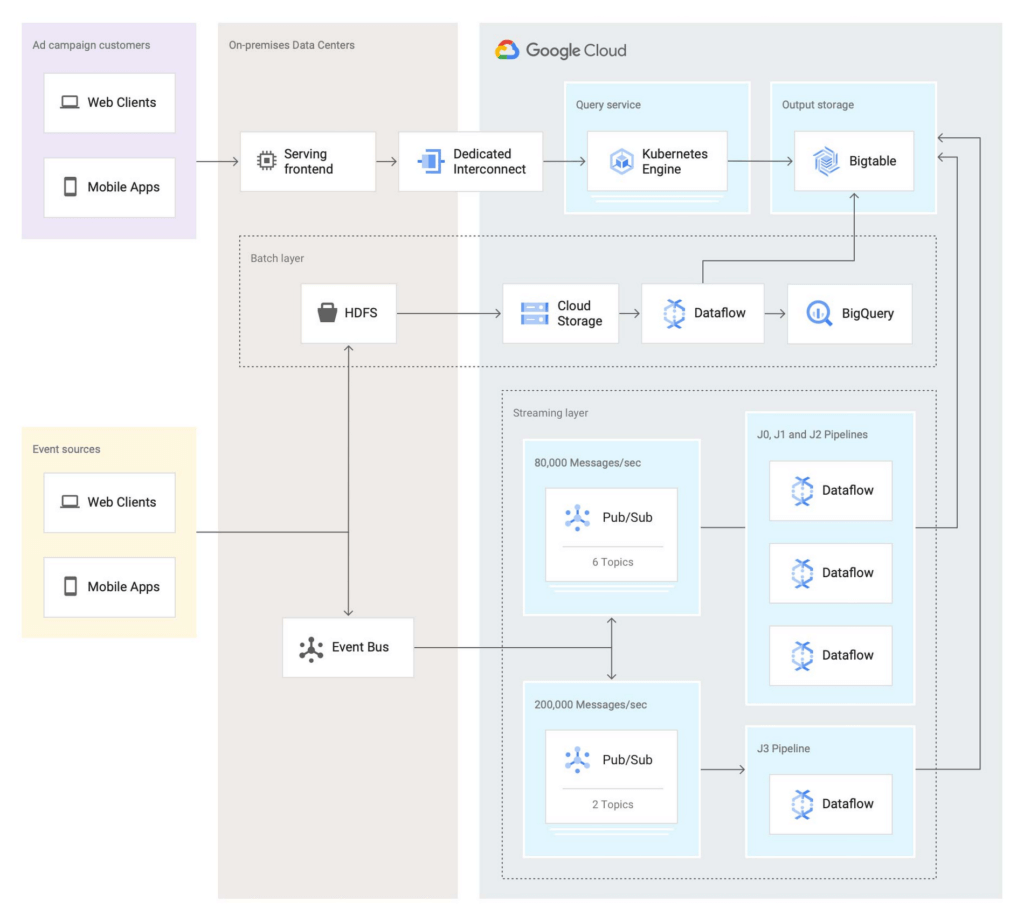
In this second iteration, the Twitter team re-implemented the batch layer as follows: Data is first staged from on-prem HDFS to Cloud Storage. A batch Dataflow job then regularly loads the data from Cloud Storage, processes the aggregations, and dual-writes the results to BigQuery for ad-hoc analysis and Bigtable for the serving system.
The Twitter team also deployed an entirely new streaming layer in Google Cloud. For data ingestion, an on-prem service now pushes two different streams of Avro-formatted messages to Pub/Sub. Each message contains a bundle of multiple raw events and affects between 100 and 1,000 aggregations. This leads to more than 3 million aggregations per second performed by four Dataflow jobs (J0-3 in the diagram above). All Dataflow jobs share the same topology, although each job consumes messages from different streams or topics.
One stream, which contains critical data, enters the system at a rate of 200,000 messages per second and is partitioned in two separate Pub/Sub topics. A Dataflow job (J3 in the diagram) consumes those two streams, performs 400,000 aggregations per second, and outputs the results to a table in Bigtable.
The other stream, which contains less critical but higher volume data, enters the system at a rate of around 80,000 messages per second and is partitioned into six separate topics. Three Dataflow jobs (J0, J1, and J2) share the processing of this larger stream, with each of them handling two of the available six topics in parallel, then also outputting the results to a table in Bigtable. In total, those three jobs process over 2 million aggregations/second.
Partitioning the high-volume stream into multiple topics offers a number of advantages:
- The partitioning is organized by applying a hash function on the aggregation key and then dividing the function’s result by the number of available partitions (in this case, six). This guarantees that any per-key grouping operation in downstream pipelines is scoped to a single partition, which is required for consistent aggregation results.
- When deploying updates to the Dataflow jobs, admins can drain and relaunch each job individually in sequence, allowing the remaining pipelines to continue uninterrupted and minimizing impact on the end users.
- The three jobs can each handle two topics without issue currently, and there is still room to scale horizontally up to six jobs if needed. The number of topics (six) is arbitrary, but is a good balance at the moment based on current needs and potential spikes in traffic.
To assist with job configuration, Twitter initially considered using Dataflow’s template system, a powerful feature that enables the encapsulation of Dataflow pipelines into repeatable templates that can be configured at runtime. However, since Twitter needed to deploy jobs with topologies that might change over time, the team decided instead to implement a custom declarative system where developers can specify different parameters for their jobs in a pystachio DSL: tuning parameters, data sources to operate on, sink tables for aggregation outputs, and the jobs’ source code location. A new major version of Dataflow templates, called Flex Templates, will remove some of the previous limitations with the template architecture and allow any Dataflow job to be templatized.
For job orchestration, the Twitter team built a custom command line tool that processes the configuration files to call the Dataflow API and submit jobs. The tool also allows developers to submit a job update by automatically performing a multi-step process, like this:
- Drain the old job:
- Call the Dataflow API to identify which data sources are used in the job (for example, a Pub/Sub topic reader).
- Initiate a drain request.
- Poll the Dataflow API for the watermark of the identified sources until the maximum watermark is hit, which indicates that the draining operation is complete.
- Launch the new job with the updated code.
This simple, flexible, and powerful system allows developers to focus on their data transformation code without having to be concerned about job orchestration or the underlying infrastructure details.
Looking ahead
Six months after fully transitioning its ad analytics data platform to Google Cloud, Twitter has already seen huge benefits. Twitter’s developers have gained in agility as they can more easily configure existing data pipelines and build new features much faster. The real-time data pipeline has also greatly improved its reliability and accuracy, thanks to Beam’s exactly-once semantics and the increased processing speed and ingestion capacity enabled by Pub/Sub, Dataflow, and Bigtable.
Twitter engineers have enjoyed working with Dataflow and Beam for several years now, since version 2.2, and plan to continue expanding their usage. Most importantly, they’ll soon merge the batch and streaming layers into a single, authoritative streaming layer.
Throughout this project, the Twitter team collaborated very closely with Google engineers to exchange feedback and discuss product enhancements. We look forward to continuing this joint technical effort on several ongoing large-scale cloud migration projects at Twitter. Stay tuned for more updates!
How AI and Analytics in EdTech are Living Upto the Hype

4863
Of your peers have already read this article.
1:30 Minutes
The most insightful time you'll spend today!
Over the last year, COVID-19 presented unforeseen challenges for practically every type of business and organization—including schools, colleges, and universities. For educational institutions, the pandemic was an unapologetic agent of acceleration, shifting one billion learners from in-person to online learning within two months.
The rapid transition to online learning exposed many schools’ lack of readiness for the new online learning environment. It also widened the learning equity gap for students, with fewer than 40% of students from low-income families having access to the tools required for remote learning.
For those who do have online access, today’s students expect everything from engaging and collaborative digital learning experiences to skills-based training for their roles in the future workforce. Expectations are also high for 24×7 multi-channel tech support across all learning devices, applications, and platforms.
In these remarkable times, education technology companies have an important role to play in supporting academic institutions and students. Indeed, this is already happening, as the EdTech (Educational Technology) market is nearly tripling, with total global expenditures expected to reach $404 billion by 2025. However, the success of these EdTech companies depends on their performance in a number of areas, including:
- Content and products: How quickly can they generate new content and react to learner needs with new products to additional markets for broader adoption?
- Personalization: How effectively can they leverage artificial intelligence (AI) to provide a personalized experience to all types of learners?
- Trust and security: How trusted and secure are their services when educational organizations are suffering the highest number of data breaches since 2005?
Here are a few examples of how EdTech companies are successfully using AI and analytics to capture this opportunity and transform their businesses:
- Build better products: iSchoolConnect is an online platform that lets students explore schools, courses, and countries where they might study, and makes higher education admissions accessible to students around the globe. The company leverages AI services to help educational institutions optimize their academic operations by accelerating admission processing by greater than 90%, while saving significant costs.
- Launch in new markets faster: Classroom creativity tools provider Book Creator uses AI APIs to enhance accessibility and improve the learner experience. “The broad suite of intelligent APIs enables us to deliver richer experiences, faster and more easily, without having to be experts in machine learning, drawing recognition, map embeds, or other areas,” says VP of engineering Thom Leggett.
- Scale businesses securely: Using DevOps and CDN [content delivery network] services, Chrome browser recording extension creator Screencastify was able to support eight times growth in users overnight amid the COVID-19 pandemic, while maintaining consistent total cost of ownership. These technologies helped the company rapidly scale operations in response to the overnight increase in demand from consumers and assure student data privacy and security on a budget. “We know this is just the beginning, as more educators rely on technology to deliver richer, more interactive curricula to students,” says CEO James Francis.
- Provide personalized learning and support: Smart analytics and AI can provide personalized support and recommendations for students, forecast demand, and predict shifts in learners’ preferences. Online learning platform Mindvalley uses cloud-based tools to understand and make decisions based on user activity and leverage machine learning to predict behavior.
Google Cloud is partnering with many of these leading EdTech companies, as well as industry-leading consortiums like Ed-Fi and Unizin, to standardize educational common data models and best practices for more agile and cost-effective integration of EdTech into existing environments.
The education landscape is changing rapidly, and EdTech has a major role to play as institutions adapt to the massive shift in learners’ preferences and expectations. We’re committed to empowering EdTech companies with the tools and services they need to help expand learning for everyone, anywhere.
Watch our Spotlight session with EdTechX to learn more.
A Look Back on Google Cloud’s Data Analytics Development Efforts from June

5960
Of your peers have already read this article.
4:00 Minutes
The most insightful time you'll spend today!
June is the month that holds the summer solstice, and some of us in the northern hemisphere get to enjoy the longest days of sunshine out of the entire year. We used all the hours we could in June to deliver a flurry of new features across BigQuery, Dataflow, Data Fusion, and more. Let’s take a look!
Simple, Sophisticated, and Secure
Usability is a key tenant of our data analytics development efforts. Our new user-friendly BigQuery improvements this month include:
- Flexible data type casting
- Formatting to change column descriptions
- GRANT/REVOKE access control commands using SQL
We hope this will delight data analysts, data scientists, DBAs, and SQL-enthusiasts who can find out more details in our blog here.
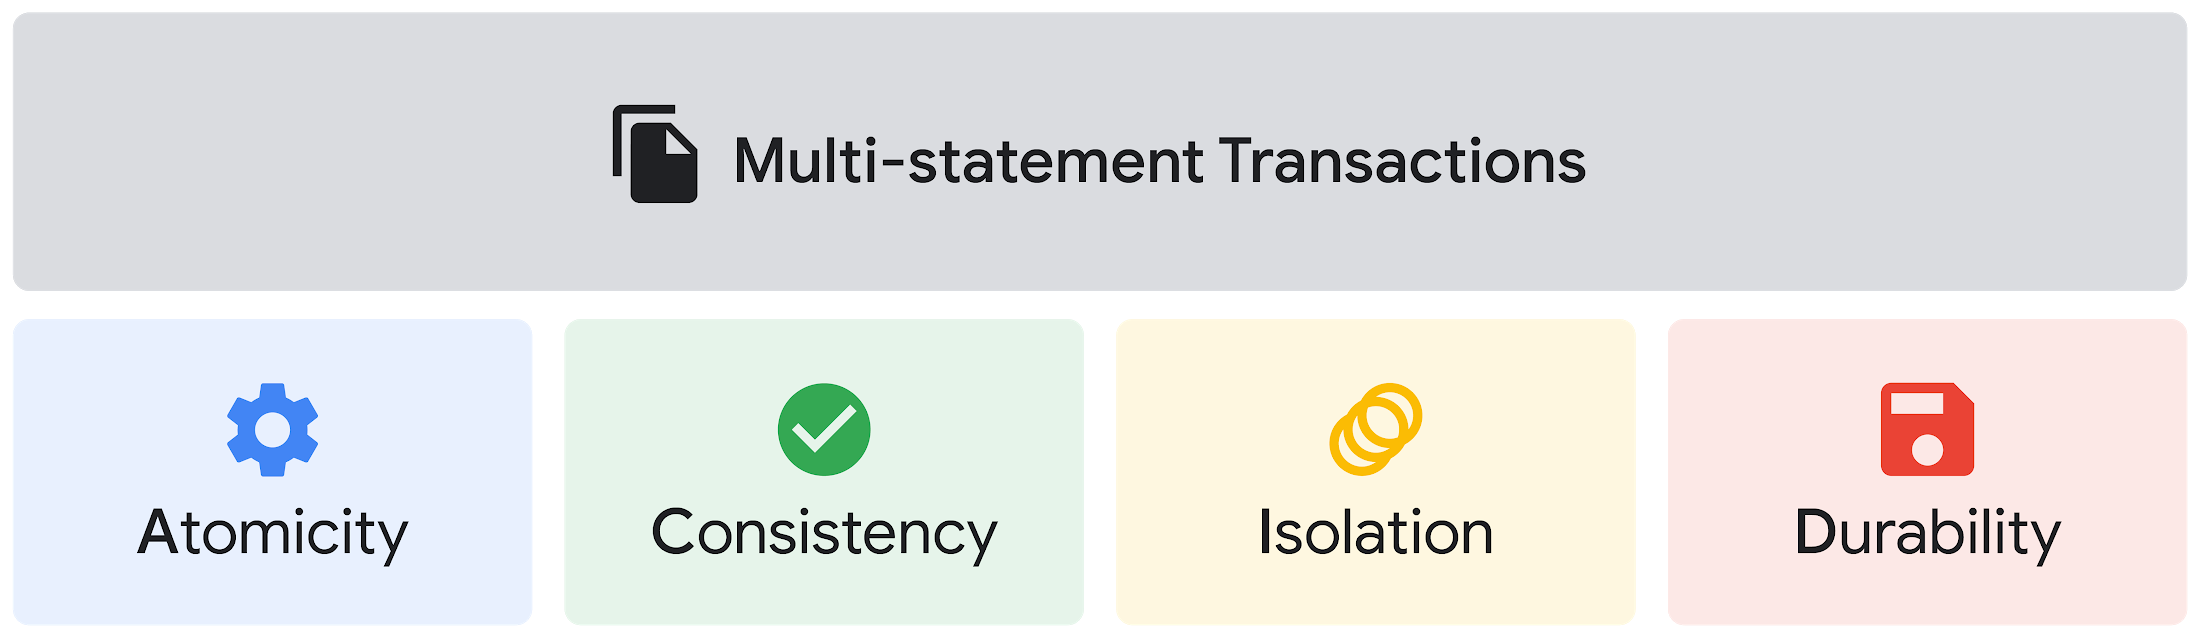
Beyond simplifying commands, we also recognize that it’s equally important to have more sophistication when dealing with transactions. That’s why we introduced multi-statement transactions in BigQuery.
As you probably know, BigQuery has long supported single-statement transactions through DML statements, such as INSERT, UPDATE, DELETE, MERGE and TRUNCATE, applied to one table per transaction. With multi-statement transactions, you can now use multiple SQL statements, including DML, spanning multiple tables in a single transaction.
This means that any data changes across multiple tables associated with all statements in a given transaction are committed atomically (all at once) if successful—or all rolled back atomically in the event of a failure.
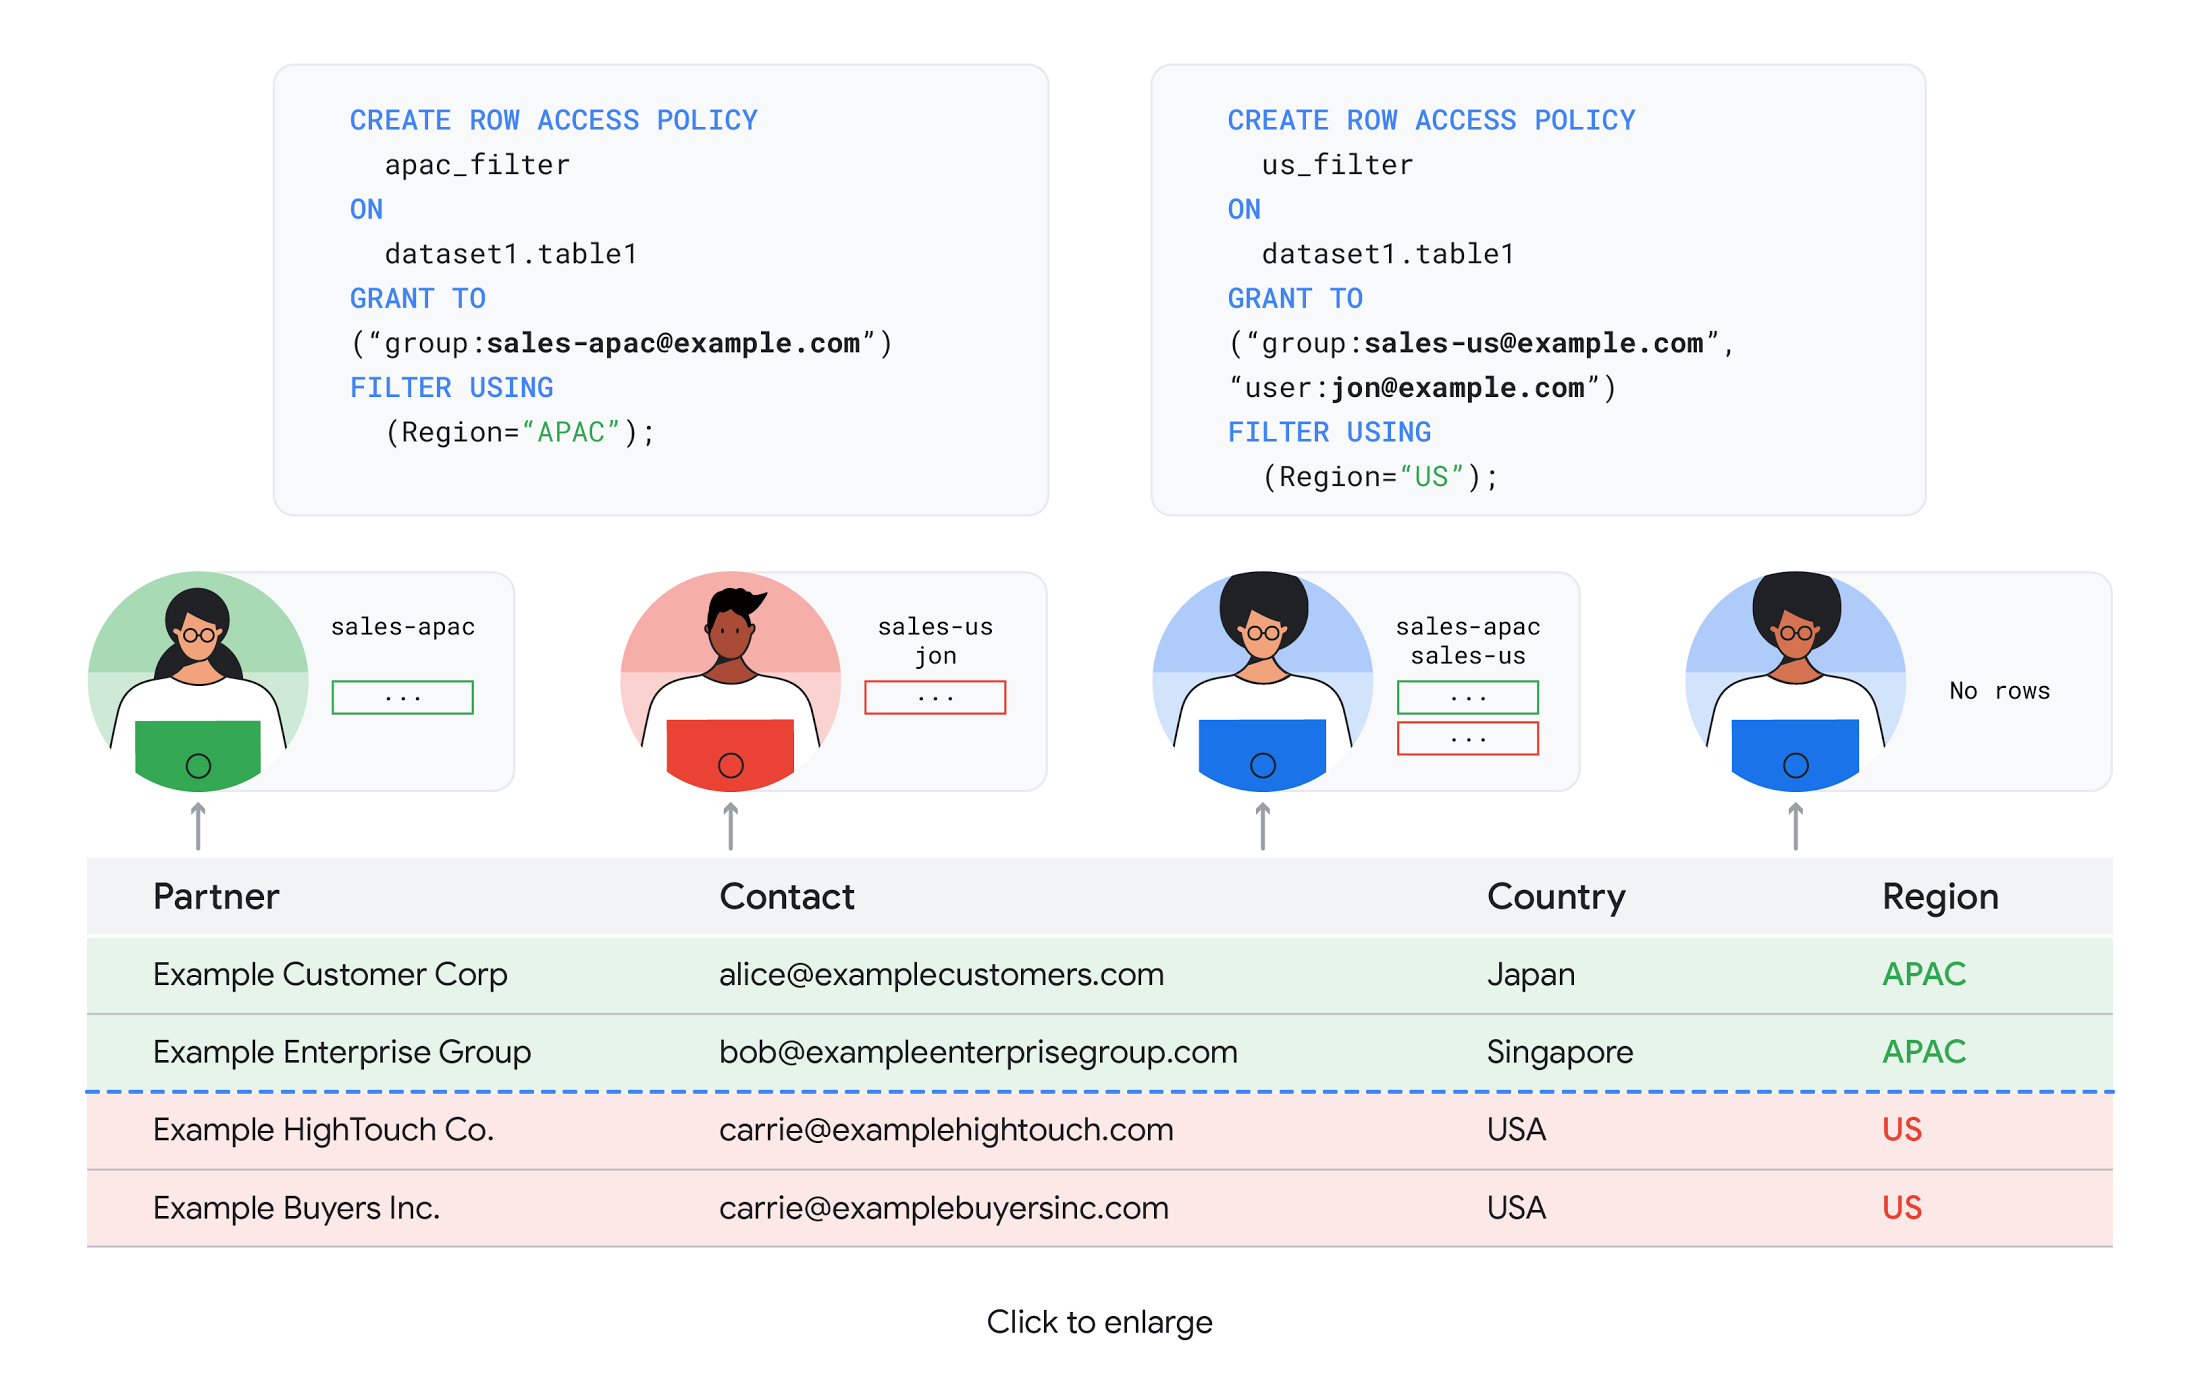
We also know that organizations need to control access to data, down to the granular level and that, with the complexity of data platforms increasing day by day, it’s become even more critical to identify and monitor who has access to sensitive data.
To help address these needs, we announced the general availability of BigQuery row-level security. This capability gives customers a way to control access to subsets of data in the same table for different groups of users. Row-level security in BigQuery enables different user personas access to subsets of data in the same table and can easily be created, updated, and dropped using DDL statements. To learn more, check out the documentation and best practices.
Simple, Safe, and Smart
Beyond building a simpler, more sophisticated and more secure data platform for customers, our team has been focused on providing solutions powered by built-in intelligence. One of our core beliefs is that for machine learning to be adopted and useful at scale, it must be easy to use and deploy.
BigQuery ML, our embedded machine learning capabilities, have been adopted by 80% of our top customers around the globe and it has become a cornerstone of their data to value journey.
As part of our efforts, we announced the general availability of AutoML tables in BigQuery ML. This no-code solution lets customers automatically build and deploy state-of-the-art machine learning models on structured data. With easy integration with Vertex AI, AutoML in BQML makes it simple to achieve machine learning magic in the background. From preprocessing data to feature engineering and model tuning all the way to cross validation, AutoML will “automagically” select and ensemble models so everyone—even non-data scientists—can use it.
Want to take this feature for a test drive? Try it today on BigQuery’s NYC Taxi public dataset following the instructions in this blog!
Speaking of public datasets, we also introduced the availability of Google Trends data in BigQuery to enable customers to measure interest in a topic or search term across Google Search. This new dataset will soon be available in Analytics Hub and will be anonymized, indexed, normalized, and aggregated prior to publication.
Want to ensure your end-cap displays are relevant to your local audience? You can take signals from what people are looking for in your market area to inform what items to place. Want to understand what new features could be incorporated into an existing product based on what people are searching for? Terms that appear in these datasets could be an indicator of what you should be paying attention to.
All this data and technology can be put to use to deploy critical solutions to grow and protect your business. For example, it can be difficult to know how to define anomalies during detection. If you have labeled data with known anomalies, then you can choose from a variety of supervised machine learning model types that are already supported in BigQuery ML.
But what if you don’t know what kind of anomaly to expect, and you don’t have labeled data? Unlike typical predictive techniques that leverage supervised learning, organizations may need to be able to detect anomalies in the absence of labeled data.
That’s why, we were particularly excited to announce the public preview of new anomaly detection capabilities in BigQuery ML that leverage unsupervised machine learning to help you detect anomalies without needing labeled data.
Our team has been working with a large number of enterprises who leverage machine learning for better anomaly detection. In financial services for example, customers have used our technology to detect machine-learned anomalies in real-time foreign exchange data.
To make it easier for you to take advantage of their best practices, we teamed up with Kasna to develop sample code, architecture guidance, and a data synthesizer that generates data so you can test these innovations right away.
Simple, Scalable, and Speedy
Capturing, processing and analyzing data in motion has become an important component of our customer architecture choices. Along with batch processing, many of you need the flexibility to stream records into BigQuery so they can become available for query as they are written.
Our new BigQuery Storage Write API combines the functionality of streaming ingestion and batch loading into a single API. You can use it to stream records into BigQuery or even batch process an arbitrarily large number of records and commit them in a single atomic operation.
Flexible systems that can do batch and real-time in the same environment is in our DNA: Dataflow, our serverless, data processing service for streaming and batch data was built with flexibility in mind.
This principle applies not just to what Dataflow does but also how you can leverage it—whether you prefer using Dataflow SQL right from the BigQuery web UI, Vertex AI notebooks from the Dataflow interface, or the vast collection of pre-built templates to develop streaming pipelines.
Dataflow has been in the news quite a bit recently. You might have noted the recent introduction of Dataflow Prime, a new no-ops, auto-tuning functionality that optimizes resource utilization and further simplifies big data processing. You might have also read that Google Dataflow is a Leader in The 2021 Forrester Wave™: Streaming Analytics, giving Dataflow a score of 5 out of 5 across 12 different criteria.
We couldn’t be more excited about the support the community has provided to this platform. The scalability of Dataflow is unparalleled and as you set your company up for more scale, more speed, and “streaming that screams”, we suggest you take a look at what leaders at Sky, RVU or Palo Alto Networks have already accomplished.
If you’re new to Dataflow, you’re in for a treat: this past month, Priyanka Vergadia (AKA CloudGirl) released a great set of resources to get you started. Read her blog here and watch her introduction video below!
https://youtube.com/watch?v=WRspZRG9e90%3Fenablejsapi%3D1%26
Simple structure that sticks together
We thrive to be the partner of choice for your transformation journey, regardless where your data comes from and how you choose to unify your data stack.
Our partners at Tata Consultancy Services (TCS) recently released research that highlights the importance of a unifying digital fabric and how data integration services like Google Cloud Data Fusion can enable their clients to achieve this vision.
We also announced SAP Integration with Cloud Data Fusion, Google Cloud’s native data integration platform, to seamlessly move data out of SAP Business Suite, SAP ERP and S4/HANA. To date, we provide more than 50 pipelines in Cloud Data Fusion to rapidly onboard SAP data.
This past month, we introduced our SAP Accelerator for Order to Cash. This accelerator is a sample implementation of the SAP Table Batch Source feature in Cloud Data Fusion and will help you get started with your end-to-end order to cash process and analytics.
It includes sample Cloud Data Fusion pipelines that you can configure to connect to your SAP data source, perform transformations, store data in BigQuery, and set up analytics in Looker. It also comes with LookML dashboards which you can access on Github.
Countless great organizations have chosen to work with Google for their SAP data. In June, we wrote about ATB Financial’s journey and how the company uses data to better serve over 800,000 customers, save over CA$2.24 million in productivity, and realize more than CA$4 million in operating revenue through “D.E.E.P”, a data exposure enablement platform built around BigQuery.
Finally, if you are an application developer looking for a unified platform that brings together data from Firebase Crashlytics, Google Analytics, Cloud Firestore, and third party datasets, we have good news!
This past month, we released a unified analytics platform that combines Firebase, BigQuery, Google Looker and FiveTran to easily integrate disparate data sources, and infuse data into operational workflows for greater product development insights and increased customer experience. This resource comes with sample code, a reference guide and a great blog! We hope you enjoy it. See you all next month!
https://youtube.com/watch?v=L25Vfzr2Ciw%3Fenablejsapi%3D1%26
More Relevant Stories for Your Company

ActivStat: Enhancing Live Sports Broadcast with Real-time Stats and Metrics
Millions of people annually view esports, as top players and teams compete in thrilling, fast-paced tests of reflexes, strategy, and teamwork. Fans are a diverse group, sharing a passion for action. A new, revolutionary project we’re working on with Call of Duty League just made that action a lot better.

Google Cloud’s Data Analytics May Recap
May was a very busy month for data analytics product innovation. If you didn’t have the chance to attend our inaugural Data Cloud Summit, video replays of all our sessions are now available so feel free to watch them at your own pace. In this blog, I’d like to share some background behind

Google Data Studio Makes Reporting a Breeze For Genesys
As a customer experience platform, Genesys helps clients nurture great relationships with customers, and creates seamless user journeys across all channels and devices. Its technologies are used by more than 10,000 companies in over 100 countries, making Genesys the top provider of its kind for 25 years in a row.




Best Practices from Experts to Maximize BigQuery Performance (Featuring Twitter)
If you have made the decision to run your data analytics on BigQuery’s serverless platform, you are in good company. Now, as you deploy complex workloads on your data, you want to be able to maximize the performance of all data operations from data loading to data analytics. In this
