





Skyscanner Supercharges Ability to Turn Raw Data into Deep Understanding of Consumer Behaviour, Conversion Jumps 40%

3814
Of your peers have already read this article.
2:30 Minutes
The most insightful time you'll spend today!
Skyscanner is a leading global travel search company covering flights, hotels, and car hire around the world. Founded in 2003, the company helps over 40 million people each month find the best travel options across its portfolio of websites and mobile apps.
Skyscanner wanted to understand the anonymized behaviour of consumers on a more granular level than was possible via standard reports in the Google Analytics Premium web interface or even using the reporting APIs.
“These methods work well for high-level analysis and standard marketing reporting, but we were keen to dig deeper into the data to get more insight and further optimise our products,” explains Mark Shilton, Principal Analyst in the Skyscanner Data Team.
For example, the company wanted to create detailed cohorts to understand how users interacted with Skyscanner over time. Also, different teams in the business were keen to understand the performance of individual pieces of functionality that fell within their remit.
To do this, they needed to understand not just the overall conversion rate, but how users who interact with a given piece of functionality convert compared to those who do not. Skyscanner also wanted drill down into specific markets, devices types, and marketing channels.
Mapping a plan for deeper insights
Skyscanner opted to address all of these needs by integrating Google Analytics Premium with BigQuery. The integration has become the starting point for many detailed investigations across the business.
For example, analysts and engineers now run cohort analyses to understand how frequently users return to Skyscanner and which channels are most effective at which part of the customer journey.
“This type of analysis is allowing a much deeper understanding of our marketing activity and is informing our future strategy and spend,” Mark says.
He reveals that using BigQuery in conjunction with other tools such as Tableau and Python also helps Skyscanner execute analysis much more quickly and efficiently than before.
“While in the past it was tricky to get a fully unsampled report based on specific segments of users flowing directly from Google Analytics Premium into a Tableau dashboard, now it is simply a matter of writing the query, creating a connection in Tableau to automatically refresh the data daily, and publishing this dashboard to the rest of the company.”
Another key benefit of using a flexible combination of tools is the ability to keep an eye on costs.
“Where the aggregations and segments of data are required on a regular basis, we have to consider the potential cost of querying the entire BigQuery dataset multiple times for the same data,” Mark explains. “To minimise this, we use Python scripts to automate these aggregations into new, smaller tables that are much more cost efficient to query.”
Excellent visibility and a clear path ahead
Combining Google Analytics Premium with BigQuery has supercharged Skyscanner’s ability to turn raw data into deep understanding of consumer behaviour.
“We have been using BigQuery for various pieces of analysis, from one-off investigations to powering daily dashboards,” Mark affirms. “In all cases it has speeded up our workflow and enabled us to gain greater insight more quickly. In a fast moving internet economy, this is key. Instead of setting up and scheduling one or more unsampled API reports, analysts can now write a query against BigQuery and have results almost instantly.”
“BigQuery has also allowed us to more easily isolate the effects of marketing from the effects of site changes,” Mark says. “By writing queries that focus on the conversion rate from specific pages in the funnel, we can better segment our traffic. We can separate traffic from various sources, including: specific marketing campaigns, users who make it to specific parts of the funnel, or users who interact with new functionality. This greater understanding has played a key role in improving overall conversion rates on our websites, particularly on mobile where we’ve achieved conversion rate improvements of 30 to 40% on smartphone and tablet devices in the last six months.”
Looking to the future, Skyscanner’s next steps include exploring how this data can be used to segment, cluster, and classify users for machine learning analyses, which would not have been possible using standard reporting functionality.
4936
Of your peers have already watched this video.
9:37 Minutes
The most insightful time you'll spend today!
L’Oréal: Managing Big-data Complexity with Google Cloud
L’Oreal is a global company with a presence in 150 countries worldwide. Between managing all of its brands and requirements for different countries, L’Oreal looks to data to make insightful business decisions. How does L’Oreal unify its data across all its systems and databases? How does L’Oreal make the data accessible to thousands of employees? In this video, Antoine Castex, Enterprise Architect at L’Oreal, discusses with Martin Omander how L’Oreal built a serverless, multi-cloud warehouse based on Google Cloud.
Chapters:
0:00 – Intro
0:23 – Why does L’Oreal need a new data warehouse?
0:51 – Who is the L’Oreal group?
1:35 – Which systems does L’Oreal use?
2:14 – How does L’Oreal manage complexity?
3:59 – What is ELT?
4:57 – Who are L’Oreal’s data consumers?
5:41 – How L’Oreal built the data warehouse
8:51 – L’Oreal’s future plans
9:10 – Wrap up
Google Cloud Workflows → https://goo.gle/3q20M1V
Cloud Run → https://goo.gle/3CSWbXG
Eventarc → https://goo.gle/3B7qhFy
BigQuery → https://goo.gle/3KHgyJ3
Looker → https://goo.gle/3Rx4Ind
Checkout more episodes of Serverless Expeditions → https://goo.gle/ServerlessExpeditions
Subscribe to Google Cloud Tech → https://goo.gle/GoogleCloudTech
Home Depot’s Interconnected Retail Experience by Virtue of Google Cloud Migration for SAP Applications

8292
Of your peers have already read this article.
1:30 Minutes
The most insightful time you'll spend today!
With nearly 2,300 stores, The Home Depot is the world’s largest home-improvement chain — a brand that professional contractors and DIYers alike have come to depend on. The home improvement industry continues to experience unprecedented demand and dramatic increases in online ordering accompanied by expanding consumer expectations for things like curbside pickup and same day delivery. The Home Depot’s decision to migrate to cloud-based infrastructure, including the migration of the company’s SAP applications on Google Cloud which began in 2017, has set it up for success in an increasingly digital world, and helped the company adapt to changing market conditions quickly.
Interconnected retail at scale
Building on a strong customer-first philosophy, The Home Depot aims to create what it calls interconnected retail—allowing customers to shop however, whenever, and wherever they want. “So many companies are focused on omni-channel retail,” explains Sam Moses, Vice President of Corporate Systems. “At The Home Depot, we wanted to take it to the next level. Interconnected retail puts the customer at the center of everything and enables them to shop in store, online, or both. Customers can begin a transaction online and continue in-store, or vice-versa.”
To support this strategy, the company’s SAP environment needed to be more agile. Running everything on-premises, from central finance to POS systems, meant that The Home Depot’s IT teams experienced redundancy and repetitive, manual processes. Their data warehouse needed an upgrade to process and analyze growing and increasingly diverse data sets. The Home Depot chose to migrate its SAP environment to Google Cloud to support both the velocity and scale needed for the business as well as critical analytics capabilities needed for its bold digital initiatives. “We chose Google Cloud to support our SAP implementation. Our decision had a lot to do with the relationship between Google Cloud and SAP and also for the applications and services that are offered by Google Cloud, like BigQuery, which are helping to enable data and analytics within our organization,” Moses explains.
After migrating its SAP applications—including S/4HANA, its customer activity repository (CAR), general ledger, e-commerce system, enterprise data warehouse and more to Google Cloud, the company now has the speed, scale and flexibility to tackle enormous spikes in the business, all while staying fully available for their customers. Additionally, The Home Depot was able to transform its financial systems and make them more agile to deliver critical information across multiple business functions in real time.
Maximizing data insights to support customer experiences
By migrating to Google Cloud, The Home Depot is leveraging Google Cloud analytics to build the industry’s most efficient supply chain including more robust demand forecasting, supplier lead times, estimated delivery times and more, all while maintaining better security than before. “We experienced unprecedented change in our customers’ behavior and their buying patterns, which puts a lot of pressure on our supply chain,” explains Moses. “So having the ability to leverage data and analytics gives us insights to know exactly what it is that our customers need.”
The company’s analysts now use BigQuery ML for machine learning directly against the company’s BigQuery data and use AutoML to determine the best model for predictions. The Home Depot’s engineers have also adapted BigQuery to monitor, analyze, and act on application performance data across all its stores and warehouses in real time—capabilities that were not as seamless in the on-premises environment.
With hundreds of projects on Google Cloud, The Home Depot’s cloud journey is well on track, but the company is always looking to the future. “As our customers’ needs have continued to evolve, and as technology has continued to evolve, our relationship with Google will continue to advance — to be able to innovate together, to be able to find new solutions together, to better serve our customers.”
Learn more about how The Home Depot is renovating its retail operation with SAP on Google Cloud.
3199
Of your peers have already watched this video.
32:30 Minutes
The most insightful time you'll spend today!
Accelerating Insights with the Health Analytics Platform
The healthcare industry is beset with a data challenge, specifically clinical data, and challenges around the proliferation of EHR instances and ancillary clinical systems.
In this video, Vivian Neilley, Solution Architect, Google Cloud and Marianne Slight, Product Manager, Google Cloud discuss how some of these challenges can be overcome with the Health Analytics Platform.
The Health Analytics Platform enables companies who have healthcare data in multiple sources on their own infrastructure to harmonize data across systems, monitor analytics, and create compelling visualizations that enable easier decision-making.
This new product suite allows for healthcare and life science organizations to manage data pipelines and run advanced analytics on managed infrastructure with interactive UIs and health data-aware features.
The Health Analytics Platform provides and end-to-end solution, from ingestion of data to harmonization to a common data model, to dashboard visualizations and machine learning.
Whether organizations leverage a data lake or are utilizing a full data warehouse approach, the platform gives users the flexibility to meet customers where they are today. This session will demonstrate how to leverage the health analytics platform to accelerate time to insights in a healthcare or life sciences organization.
How Kinguin Notched Up Shopping Experience with Google Recommendations AI

6463
Of your peers have already read this article.
3:00 Minutes
The most insightful time you'll spend today!
Over 2.14 billion people worldwide are expected to buy online this year, according to Statista. Online retail sales will account for 22% of all purchases by 2023. But in a competitive retail landscape, positive interactions can mean the difference between a sale and an abandoned shopping cart.
One of the leading global marketplaces – Kinguin.net is a haven for gamers. Their bustling ecommerce business conducts over 500,000 new transactions monthly. Users will encounter over 50,000 unique digital products, from video games, gift cards, in-game items to computer software and services. With over 10 million registered users, Kinguin improved their experience by helping users find items quickly and deliver service at scale.
Helping customers find what they want, fast
Because of Kinguin’s high volume of users—both buyers and sellers—and breadth of digital products, browsing and shopping can be challenging. “Customers shop online for choice and convenience, but it can sometimes be overwhelming. We want anyone who shops at Kinguin to find what they are looking for quickly and easily,” says Viktor Romaniuk Wanli, Kinguin CEO and Founder.
Today’s retailers know that creating personalized shopping experiences is crucial for establishing and maintaining customer loyalty. Kinguin discovered their users were getting a rather standard retail experience. They wondered how they could offer them a more tailored, personalized experience.
They knew product recommendations were a great way to personalize experiences because they help customers discover products that match their tastes and preferences. But it’s not that easy to recommend products. Various shifting factors make recommendations much more complex:
- Customer behavior. Understanding customers is tough. How do you recommend something to a cold start user who’s never been to your site before? What happens when their behavior changes?
- Omnichannel context. According to Harvard Business Review, 73% of all customers use many channels when they buy. What happens when they go from desktop to mobile or from social media shopping to a proprietary app?
- Product data challenges. How do you recommend new products within a large catalog of items? What if your product data has sparse labeling or unstructured metadata?
Data wasn’t a problem for Kinguin. They had data orders, history, wishlists, and could collect events based on their platform interactions. It was the machine learning model expertise they lacked. So rather than building their own solution, they determined it was more cost effective for them to find a reliable partner. It was also essential that the solution integrated easily with Kubernetes, which enabled their global network.
With these considerations in mind, they applied for the Google Recommendations AI beta program. Kinguin became the first gaming e-commerce platform in Europe to use Recommendations AI when it launched in 2020.
Pro gamer move: using a fully managed AI service
Google Recommendations AI uses algorithms to deliver highly personalized suggestions tailored to a customer’s preferences. Google Cloud based these algorithms on the same research that powers models by YouTube search and Google Shopping. Algorithms are always being tuned and adjusted to focus on individuals themselves—not just items.
Many shopping AIs rely on manually provisioning infrastructure and training machine learning models. Instead, Recommendations AI’s deep learning models use item and user metadata to gain insights. It processes Kinguin’s thousands of products at scale, iterating in real time. First, Kinguin pieces together a customer’s history and shopping journey. Then, using Recommendations AI, they can serve up personalized products—even for long-tail products and cold-start users.
By leveraging internal tools, Kinguin didn’t need to start implementation from scratch. After a few trial sessions with Google Cloud engineers, they got started right away. Due to the fast-paced nature of a marketplace—i.e., price changes, out-of-stock items—Kinguin needed their recommendations to be as close to real time as possible. They used internal event buses to stream events and their product catalog directly to the recommendations API.
Kinguin rolled out in high-traffic areas, including their home page, product page, and category pages. They analyzed heat maps and scroll maps to figure out where to test placements. They also experimented with different recommendation models such as “recently bought together” and “you may like.” Engineers also factored in where they were implementing the models. For example, the “others you might like” model would fit best on the homepage, while “frequently bought together” made sense at checkout.
Understanding how product recommendations influence financials is critical for demonstrating the impact of personalization. Using BigQuery, Kinguin could analyze different cost projection models. BigQuery helped them dig into specific financial data to understand their margins and revenue gains.
Playing to win: enhanced customer experience
Since adopting Recommendations AI, Kinguin has improved both customer experience and satisfaction. Search times have shortened by 20 seconds. Additionally, their average cart value has increased by 5 EUR. Conversion rates have quadrupled since the outset. Click-thru rates have doubled, increasing by 2.16 on product pages and 2.8 times on recommendations pages.
“Google Recommendations AI has helped us evolve our service, increase customer loyalty and satisfaction. It has also contributed to a significant rise in sales,” says Wanli. Kinguin is already thinking about other ways of enhancing user experiences with recommendations. Ideas include their checkout process, other landing pages, and email marketing.
Kinguin’s journey with Google Cloud shows how companies can leverage AI to optimize sales and deliver high-performing, low-latency recommendations to any customer touchpoint.
Learn more about Recommendations AI and Google Cloud AI and machine learning solutions.
BigQuery Helps Insurance Firms Leverage Previous Storm Data for Better Pricing Insights

8574
Of your peers have already read this article.
2:00 Minutes
The most insightful time you'll spend today!
It may be surprising to know that U.S. natural catastrophe economic losses totaled $119 billion in 2020, and 75% (or $89.4B) of those economic losses were caused by severe storms and cyclones. In the insurance industry, data is everything. Insurers use data to influence underwriting, rating, pricing, forms, marketing, and even claims handling. When fueled by good data, risk assessments become more accurate and produce better business results. To make this possible, the industry is increasingly turning to predictive analytics, which uses data, statistical algorithms, and machine learning (ML) techniques to predict future outcomes based on historical data. Insurance firms also integrate external data sources with their own existing data to generate more insight into claimants and damages. Google Cloud Public Datasets offers more than 100 high-demand public datasets through BigQuery that helps insurers in these sorts of data “mashups.”
One particular dataset that insurers find very useful is Severe Storm Event Details from the U.S. National Oceanic and Atmospheric Administration (NOAA). As part of the Google Cloud Public Datasets program and NOAA’s Public Data Program, this severe storm data contains various types of storm reports by state, county, and event type—from 1950 to the present—with regular updates. Similar NOAA datasets within the Google Cloud Public Datasets program include the Significant Earthquake Database, Global Hurricane Tracks, and the Global Historical Tsunami Database.
In this post, we’ll explore how to apply storm event data for insurance pricing purposes using a few common data science tools—Python Notebook and BigQuery—to drive better insights for insurers.
Predicting outcomes with severe storm datasets
For property insurers, common determinants of insurance pricing include home condition, assessor and neighborhood data, and cost-to-replace. But macro forces such as natural disasters—like regional hurricanes, flash floods, and thunderstorms—can also significantly contribute to the risk profile of the insured. Insurance companies can leverage severe weather data for dynamic pricing of premiums by analyzing the severity of those events in terms of past damage done to property and crops, for example.
It’s important to set the premium correctly, however, considering the risks involved. Insurance companies now run sophisticated statistical models, taking into account various factors—many of which can change over time. After all, without accurate data, poor predictions can lead to business losses, particularly at scale.
The Severe Storm Event Details database includes information about a storm event’s location, azimuth (an angle measurement used in celestial coordination), distance, impact, and severity, including the cost of damages to property and crops. It documents:
- The occurrence of storms and other significant weather events of sufficient intensity to cause loss of life, injuries, significant property damage, and/or disruption to commerce.
- Rare, unusual weather events that generate media attention, such as snow flurries in South Florida or the San Diego coastal area.
- Other significant weather events, such as record maximum or minimum temperatures or precipitation that occur in connection with another event.
Data about a specific event is added to the dataset within 120 days to allow time for damage assessments and other analysis.
Driving business insights with BigQuery and notebooks
Google Cloud’s BigQuery provides easy access to this data in multiple ways. For example, you can query directly within BigQuery and perform analysis using SQL.
Another popular option in the data science and analyst community is to access BigQuery from within the Notebook environment to intersperse Python code and SQL text, and then perform ad hoc experimentation. This uses the powerful BigQuery compute to query and process huge amounts of data without having to perform the complex transformations within the memory in Pandas, for example.
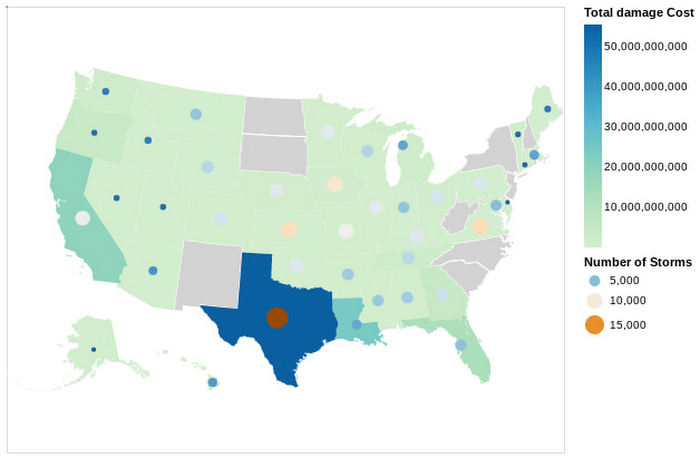
In this Python notebook, we have shown how the severe storm data can be used to generate risk profiles of various zip codes based on the severity of those events as measured by the damage incurred. The severe storm dataset is queried to retrieve a smaller dataset into the notebook, which is then explored and visualized using Python. Here’s a look at the risk profiles of the zip codes:
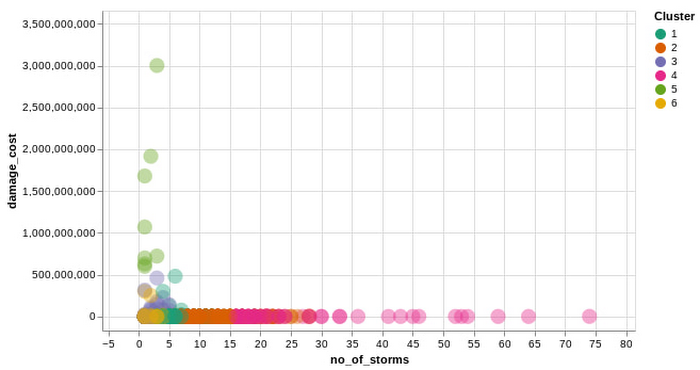
Another Google Cloud resource for insurers is BigQuery ML, which allows them to create and execute machine learning models on their data using standard SQL queries. In this notebook, with a K-Means Clustering algorithm, we have used BigQuery ML to generate different clusters of zip codes in the top five states impacted by severe storms. These clusters show different levels of impact by the storms, indicating different risk groups.
The example notebook is a reference guide to enable analysts to easily incorporate and leverage public datasets to augment their analysis and streamline the journey to business insights. Instead of having to figure out how to access and use this data yourself, the public datasets, coupled with BigQuery and other solutions, provide a well-lit path to insights, leaving you more time to focus on your own business solutions.
Making an impact with big data
Google Cloud’s Public Datasets is just one resource within the broader Google Cloud ecosystem that provides data science teams within the financial services with flexible tools to gather deeper insights for growth. The severe storm dataset is a part of our environmental, social, and governance (ESG) efforts to organize information about our planet and make it actionable through technology, helping people make a positive impact together.
To learn more about this public dataset collaboration between Google Cloud and NOAA, attend the Dynamic Pricing in Insurance: Leveraging Datasets To Predict Risk and Price session at the Google Cloud Financial Services Summit on May 27. You can also check out our recent blog and explore more about BigQuery and BigQuery ML.
More Relevant Stories for Your Company

A Breakdown of Cloud-based Data Ingestion Practices
Businesses around the globe are realizing the benefits of replacing legacy data silos with cloud-based enterprise data warehouses, including easier collaboration across business units and access to insights within their data that were previously unseen. However, bringing data from numerous disparate data sources into a single data warehouse requires you

Seven-Eleven Japan Leverages Google Cloud’s Performance and Speed for Real-time Business Insights
With the rise of technologies like smartphones, retailers have felt the pressure to meet evolving consumer needs and expectations. Seven-Eleven Japan(“SEJ”) has long been on the forefront of this thanks to the way they develop and invest in IT. However, in recent years, Japan’s leading convenience store chain has struggled

Serverless and BigQuery Together on Google Cloud: Behind the L’Oreal Beauty Tech Data Platform
Editor's note: In Today's guest post we hear from beauty leader L'Oréal about their approach to building a modern data platform on fully managed services: managing the ingest of diverse datasets into BigQuery with Cloud Run, and orchestrating transformations into relevant business domain representations for stakeholders across the organization. Learn
Moving Your Data Warehouse to the Cloud? Here’s What You Need to Know
Modernizing your data warehouse is one way to keep up with evolving business requirements and harness new technology. For many companies, cloud data warehousing offers a fast, flexible, and cost-effective alternative to traditional on-premises solutions. In a report sponsored by Google Cloud, TDWI examines the rise of cloud-based data warehouses
