Report on API-led Digital Transformations in 2020 and the Future

6809
Of your peers have already read this article.
1:30 Minutes
The most insightful time you'll spend today!
In 2020, many businesses across industries turned their focus and investments towards digital strategies. APIs being an integral part of every organization’s digital disruption, will grow in relevance throughout 2021. Read the report to gain more insights on driving API-led digital transformations and in-depth analysis of Google Cloud’s Apigee API Management Platform usage data, case studies and third-party surveys conducted with tech leaders.
Learn to Easily Administer Multi-cluster Kubernetes Environs: Part 4 KRM Series

5575
Of your peers have already read this article.
4:00 Minutes
The most insightful time you'll spend today!
This is part 4 in a multi-part series about the Kubernetes Resource Model. See parts 1, 2, and 3 to learn more.
Kubernetes clusters can scale. Open-source Kubernetes supports up to 5,000 Nodes, and GKE supports up to 15,000 Nodes. But scaling out a single cluster can only get you so far: if your cluster’s control plane goes down, your entire platform goes down; if the Cloud region running your cluster has a service interruption, so does your app.
Many organizations choose, instead, to operate multiple Kubernetes clusters. Besides availability, there are lots of reasons to consider multi-cluster, such as allocating a cluster to each development team, splitting workloads between cloud and on-prem, or providing burst capability for traffic spikes.
But operating a multi-cluster platform comes with its own challenges. How to consistently administer many clusters at once? How to keep the clusters secure? How to deploy and monitor applications running across multiple clusters? How to seamlessly fail over from one region to another?
This post introduces a few tools that can help platform teams more easily administer a multi-cluster Kubernetes environment.
The platform base layer, with Config Sync
In the last post, we explored how thoughtful platform abstractions can help reduce toil for app developers- including for a multi-cluster environment, where automation such as CI/CD handles all interactions with the staging and production clusters. But equally important is the platform base layer, the Kubernetes resources and configuration that are shared across services. Your platform base layer might consist of Namespaces, role-based access control, and shared workloads like Prometheus.
Platform abstractions depend on the existence of these base-layer resources. And so does the security and stability of your platform as a whole. It’s important that these resources not only get deployed, but also stay put. CI/CD is great for deploying resources, but what about making sure resources stay deployed? What if a Kubernetes Namespace gets deleted? Or a Prometheus StatefulSet is modified?
Kubernetes’ job is to ensure that the cluster’s actual state matches the desired state. But sometimes, the “desired” state isn’t desired at all – it’s a developer who mistakenly modified a resource, or a bad actor that’s gained access into the system. For this reason, a platform base layer needs more than a one-and-done CI/CD pipeline. A tool called Config Sync can help with this.
Config Sync is a Google Cloud product that can sync Kubernetes resources from a Git repository to one or more GKE or Anthos clusters. Unlike CI/CD tools like Cloud Build, Config Sync watches your clusters constantly, making sure that the intended resource state in the cluster always matches what’s in Git. Config Sync is designed primarily for base-layer resources like namespaces and RBAC. In this way, Config Sync is complementary to, not a replacement for, CI/CD.
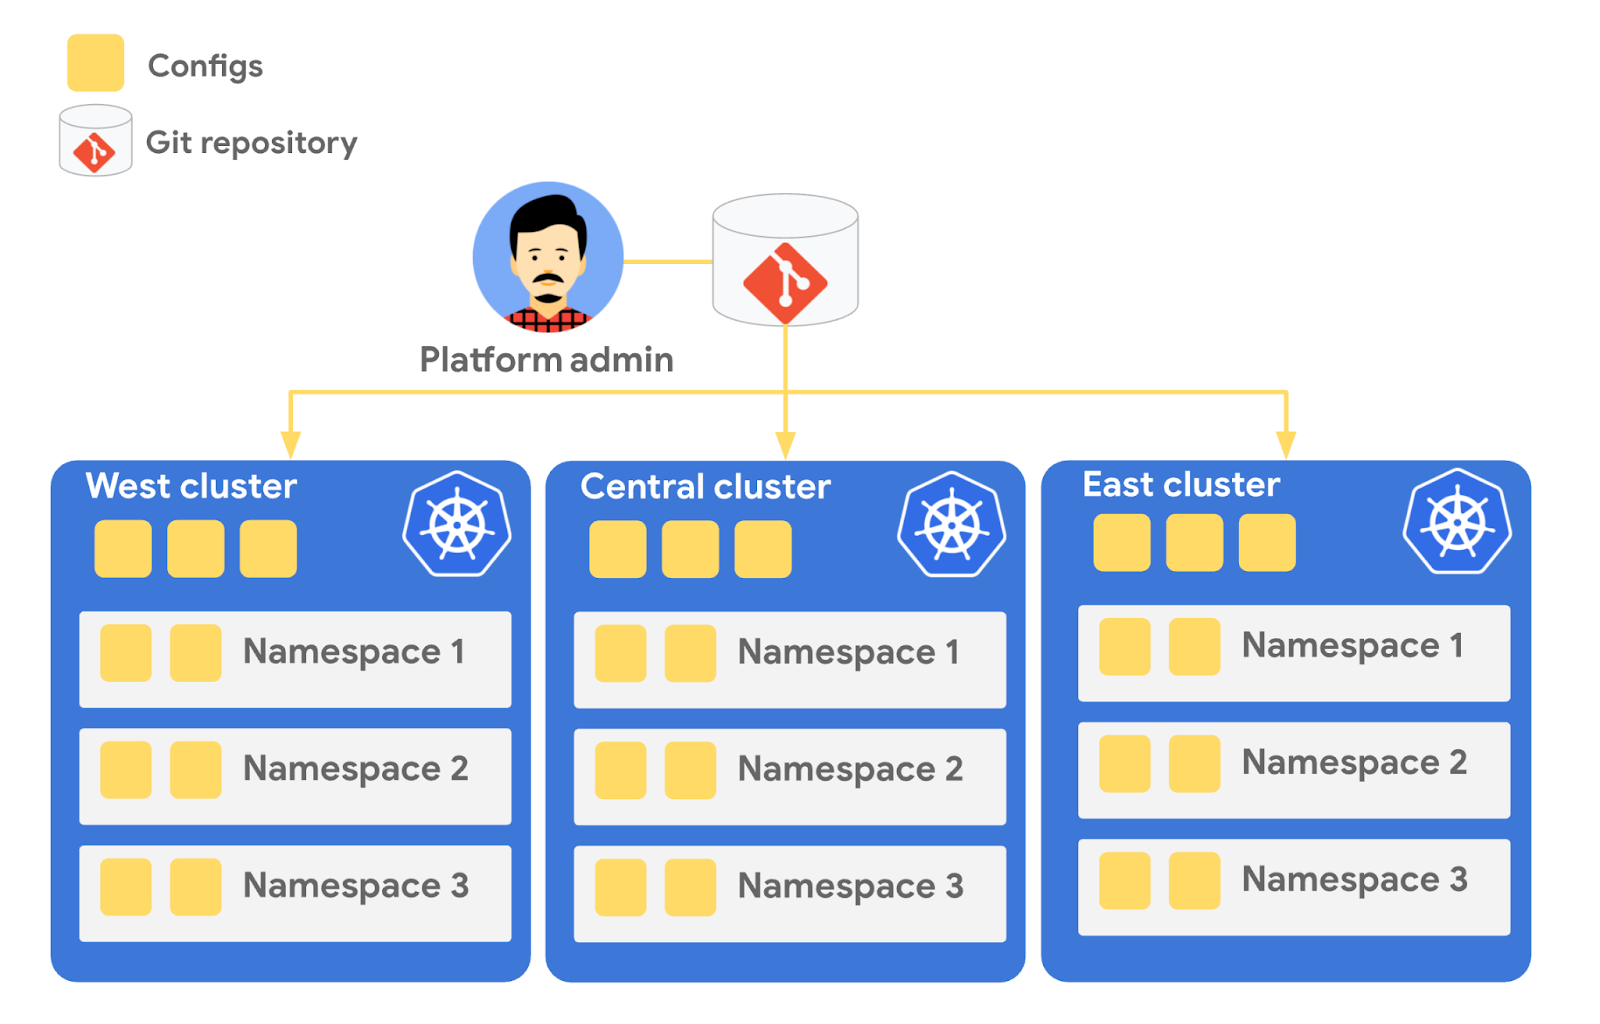
Config Sync runs in a Pod inside your Kubernetes cluster, watching your Git config repo for changes, and also watching the cluster itself for any divergence from your desired state in Git. If any configuration drift is detected from what’s stored in Git, Config Sync will update the API Server accordingly.
You can point multiple Config Sync deployments at the same Git repo, allowing you to manage the base-layer platform resources for multiple clusters using the same source of truth. And by using Git as the landing zone for config, you can benefit from some of the GitOps principles we discussed in part 2, including the ability to audit and roll back configuration changes.
Let’s walk through an example of how to manage base-layer resources with Config Sync.
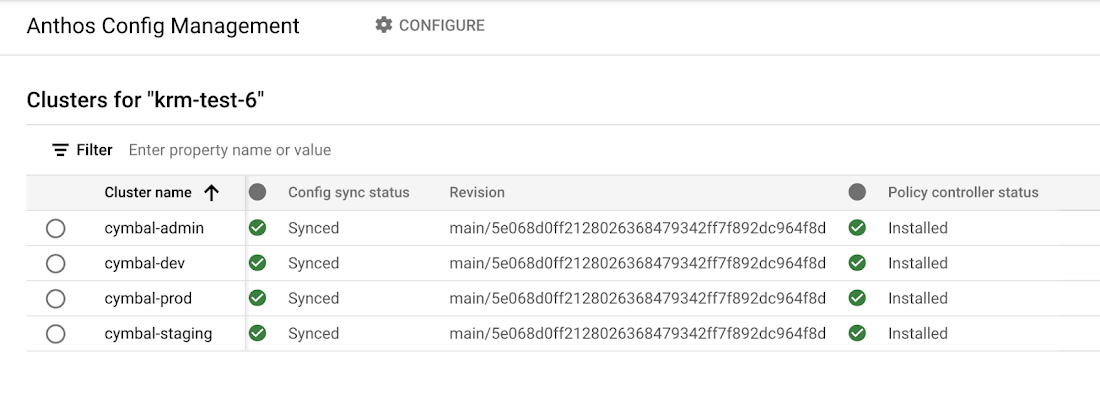
The Cymbal Bank platform consists of four GKE clusters: admin, dev, staging, and prod. We can install Config Sync on all four clusters using the gcloud tool or the Google Cloud Console, pointing all four clusters at a single Git repository, called cymbalbank-policy. Note that this repo is separate from the application source and config repos, and is managed by the platform team. From the Console, we can see that all four clusters are synced to the same commit of the cymbalbank-policy repo.
Now, let’s say that the Cymbal Bank platform team wants to limit the amount of CPU and memory resources each application team can request for their service. Kubernetes ResourceQuotas help impose these limits, and prevent unexpected Pod evictions.
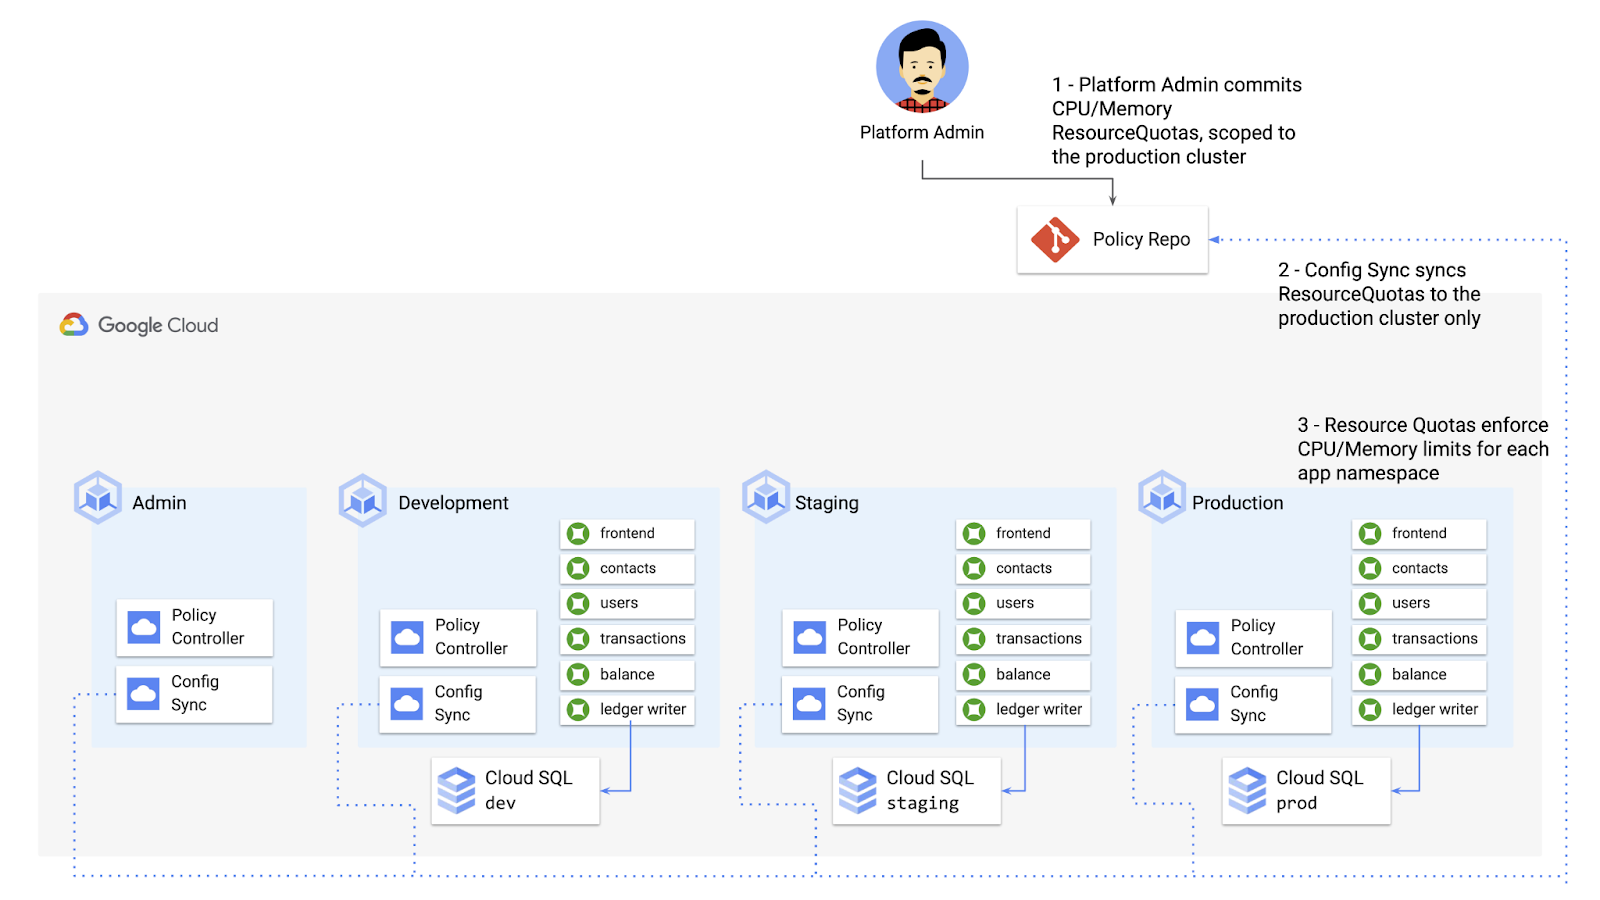
The platform team can define a set of ResourceQuotas for each application namespace. They can also scope the resources to only be applied to a subset of clusters – for instance, to the production cluster only. (If no cluster name selector is specified, Config Sync will deploy the resource to all clusters by default.)
apiVersion: v1kind: ResourceQuotametadata:name: production-quotanamespace: frontendannotations:configsync.gke.io/cluster-name-selector: cymbal-prodspec:hard:cpu: 700mmemory: 512Mi
From here, the platform team can commit the resources to the cymbalbank-policy repo, and Config Sync, always watching the policy repo, will deploy the resources to the production cluster:
NAMESPACE NAME AGE REQUEST LIMITbalancereader production-quota 6m56s cpu: 300m/700m, memory: 612Mi/512Mi
If a developer tries to delete one of the ResourceQuotas, Config Sync will block the request, helping to ensure that these base-layer resources stay put.
error: You must be logged in to the server (admission webhook "v1.admission-webhook.configsync.gke.io" denied the request: requester is not authorized to delete managed resources)
In this way, Config Sync can help platform teams ensure the stability of that platform base-layer, as well as ensure resource consistency across multiple clusters at once. This, in turn, can help organizations mitigate the complexity of adding new clusters to their environment.
Enforce policies on Kubernetes resources
Config Sync is a powerful tool on its own, and can work with any Kubernetes resource that your cluster recognizes. This includes Custom Resource Definitions (CRDs) installed with add-ons like Anthos Service Mesh.
But Config Sync, by default, doesn’t have an idea of “good or bad” Kubernetes resources. It will deploy whatever resources land in Git, even resources that might pose a security risk to your organization. Security is an essential feature of any developer platform, and when it comes to Kubernetes, it’s important to think about security from the initial software design stages, and set up your clusters with security best-practices in mind.
But it’s just as important to think about security at deploy-time. Who and what can access your clusters? What kinds of Kubernetes resources – and fields within those resources- are allowed? These decisions will depend on lots of factors, including the kinds of data your application deals with, and any industry-specific regulations.
One common security use case for KRM is the need to monitor incoming Kubernetes resources, whether they’re coming in through kubectl, CI/CD, or Config Sync. But if you have multiple clusters, your Kubernetes environment has multiple API Servers, and therefore multiple entry points.
A Google tool called Policy Controller can help automate resource monitoring across multiple clusters. Policy Controller is a Kubernetes admission controller that can accept or reject incoming resources based on custom policies you define. Policy Controller is based on the OpenPolicyAgent Gatekeeper project, and it allows you to define policies, or “Constraints,” as KRM. This means you can deploy them using Config Sync, via Git. Once deployed, Policy Controller uses your Constraints as a set of rules to evaluate all incoming KRM, rejecting resources that fall out of compliance.
Let’s walk through an example. Say that the Cymbal Bank security team wants to ensure that no code in development is accessible to the public. Kubernetes Services of type LoadBalancer expose public IP addresses by default, so the platform team wants to define a PolicyController constraint that blocks Services of that type on the development GKE cluster.
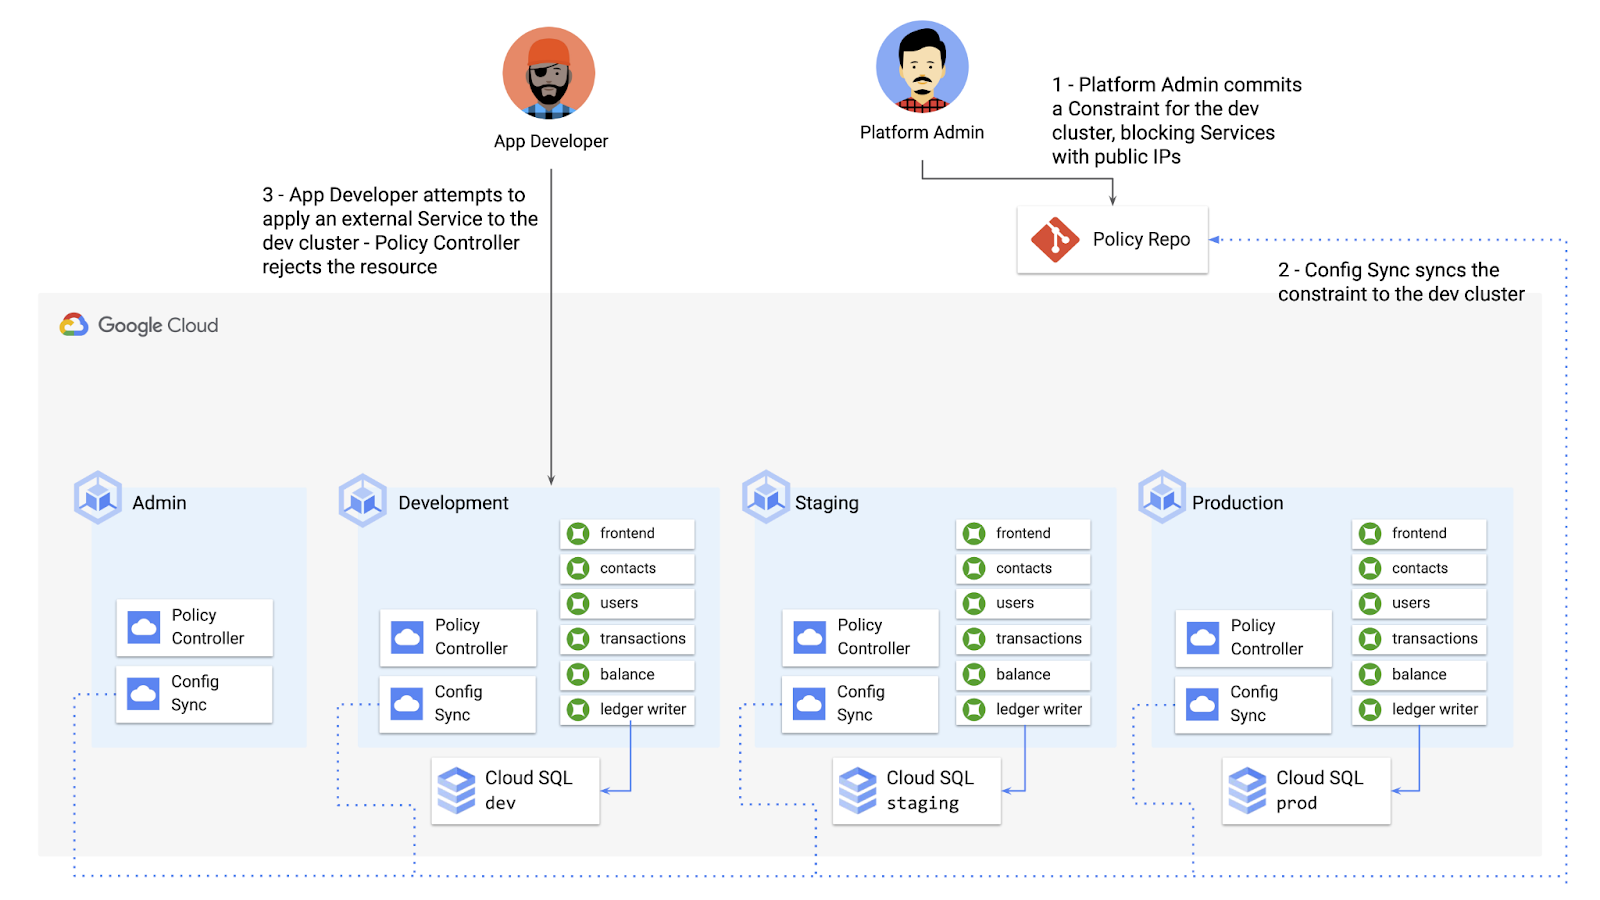
To do this, the platform team can define a Policy Controller Constraint as KRM. This Constraint uses a Constraint Template, provided through the pre-installed Constraint Template library. The ConstraintTemplate defines the logic of the policy itself, and the Constraint makes the template concrete, populating any variables needed to execute the policy logic. Here, we’re also adding a Config Sync cluster name annotation, to scope this resource to apply only to the development cluster.
apiVersion: constraints.gatekeeper.sh/v1beta1kind: K8sNoExternalServicesmetadata:name: dev-no-ext-servicesannotations:configsync.gke.io/cluster-name-selector: cymbal-devspec:internalCIDRs: []
The platform team can then commit the resource to the cymbalbank-policy repo, and Config Sync will deploy the resource to the development cluster.
From here, if an app developer tries to create an externally-accessible Kubernetes Service, Policy Controller will block the resource from being created.
for: "constraint-ext-services/contacts-svc-lb.yaml": admission webhook "validation.gatekeeper.sh" denied the request: [denied by dev-no-ext-services] Creating services of type `LoadBalancer` without Internal annotation is not allowed
The platform team can define as many of these Constraints as they want, each defining a separate policy.
Writing custom policies
The Policy Controller Constraint Template library provides a lot of functionality, from blocking privileged containers, to requiring certain resource labels, to preventing app teams from deploying into certain namespaces. But if you want to enforce custom logic on your organization’s KRM, you can do so by writing a custom Constraint Template.
Constraint Templates are written in a query language called Rego. Rego was designed for policy rule evaluation, and it can introspect Kubernetes resource fields to make a conclusion as to whether the resource is allowed or not.
For instance, let’s say that the platform team wants to limit the number of containers allowed inside a single application Pod. Too many containers per Pod can cause outage risks— when one container crashes, the entire Pod crashes.
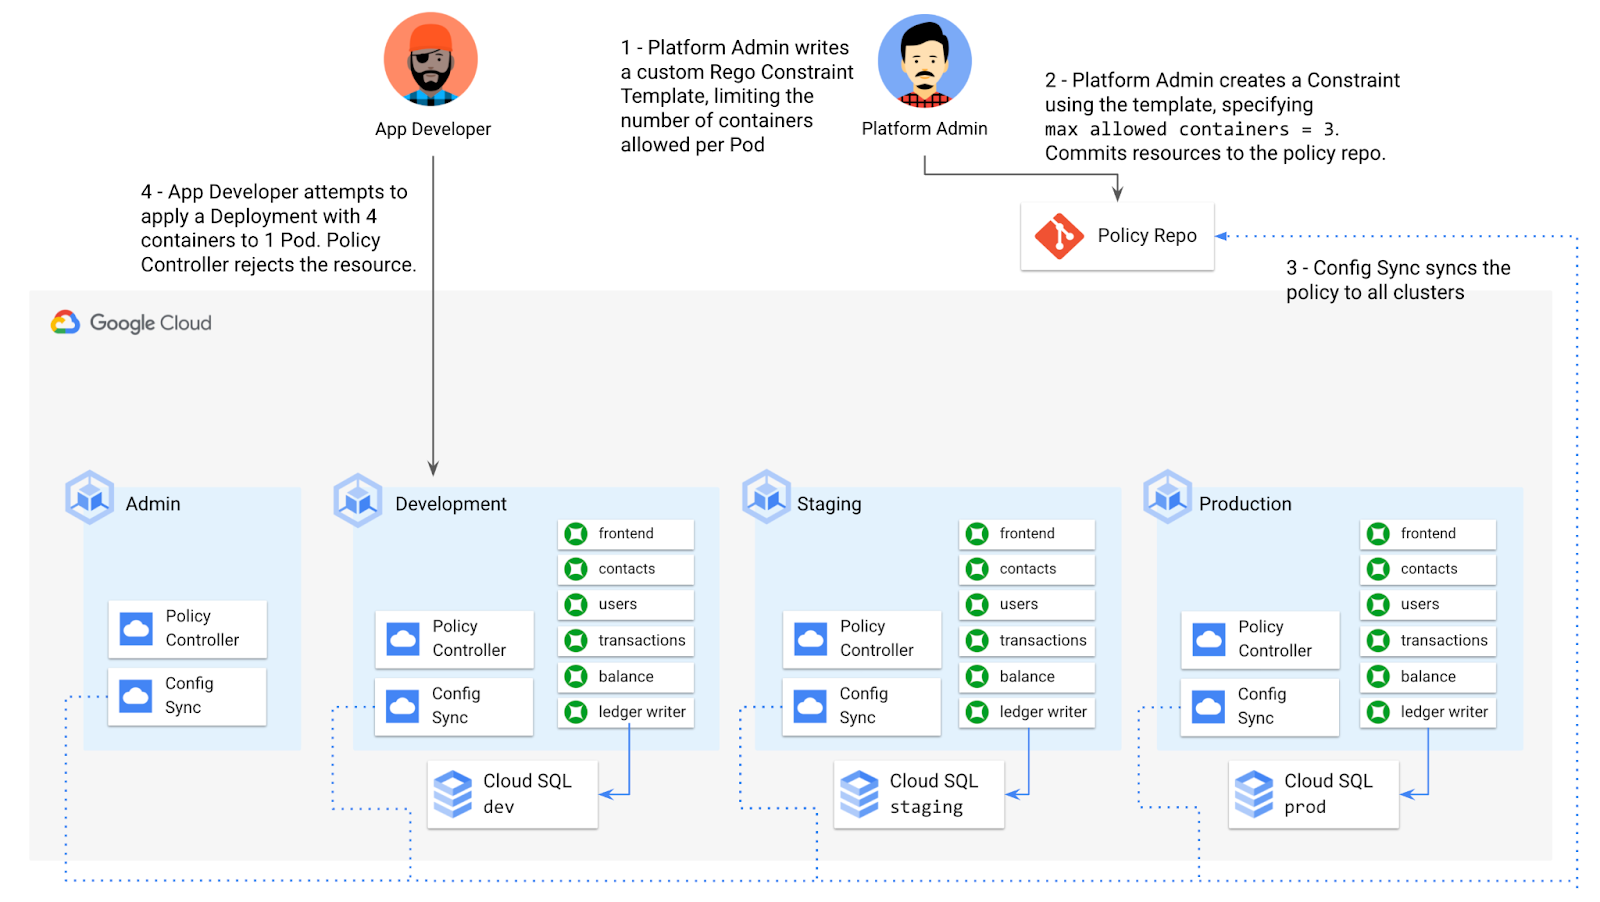
To enforce this policy, the platform team can define a Constraint Template, using the Rego language, that looks inside a resource to ensure that the number of containers per Pod is within the allowed limit:
apiVersion: templates.gatekeeper.sh/v1beta1kind: ConstraintTemplatemetadata:name: k8slimitcontainersperpodspec:crd:spec:names:kind: K8sLimitContainersPerPodvalidation:openAPIV3Schema:properties:allowedNumContainers:type: integertargets:- target: admission.k8s.gatekeeper.shrego: |package k8slimitcontainersperpodnumTemplateContainers := count(input.review.object.spec.template.spec.containers)numRunningContainers := count(input.review.object.spec.containers)containerLimit := input.parameters.allowedNumContainerstemplate_containers_over_limit = true {numTemplateContainers > containerLimit}running_containers_over_limit = true {numRunningContainers > containerLimit}violation[{"msg": msg}] {template_containers_over_limitmsg := sprintf("Number of containers in template (%v) exceeds the allowed limit (%v)", [numTemplateContainers, containerLimit])}violation[{"msg": msg}] {running_containers_over_limitmsg := sprintf("Number of running containers (%v) exceeds the allowed limit (%v)", [numRunningContainers, containerLimit])}Then, the platform team can define a concrete Constraint, using this Constraint Template, to set the number of allowed containers per Pod to 3:apiVersion: constraints.gatekeeper.sh/v1beta1kind: K8sLimitContainersPerPodmetadata:name: limit-three-containersspec:parameters:allowedNumContainers: 3
Finally, the platform team can push these resources to the cymbalbank-policy repo, and Config Sync will deploy the policy to all four clusters. If a developer tries to define a Kubernetes Deployment containing more containers per pod than what’s allowed, the resource will be blocked at deploy time:
Error from server ([limit-three-containers] Number of containers in template (4) exceeds the allowed limit (3)): error when creating "constraint-limit-containers/test-workload.yaml": admission webhook "validation.gatekeeper.sh" denied the request: [limit-three-containers] Number of containers in template (4) exceeds the allowed limit (3)
Custom Constraint Templates can give platform teams lots of flexibility in the types of policies they define and enforce in a Kubernetes environment.
Integrating policy checks into CI/CD
As we explored earlier, Config Sync and CI/CD are complementary tools. Config Sync works great for base-layer platform resources and policies, whereas CI/CD works well for application tests and deployment.
But one pitfall of having two separate KRM deployment mechanisms is that app developers may not know that their resources are out of policy until they try to deploy them into production. This is especially true if some policies are scoped only to production, as we saw with the ResourceQuota example. Ideally, the platform team has a way to empower developers and code reviewers to know ahead of time whether new or modified resources are still in compliance. We can enable this use case by integrating policy checks into the existing Cymbal Bank CI/CD.
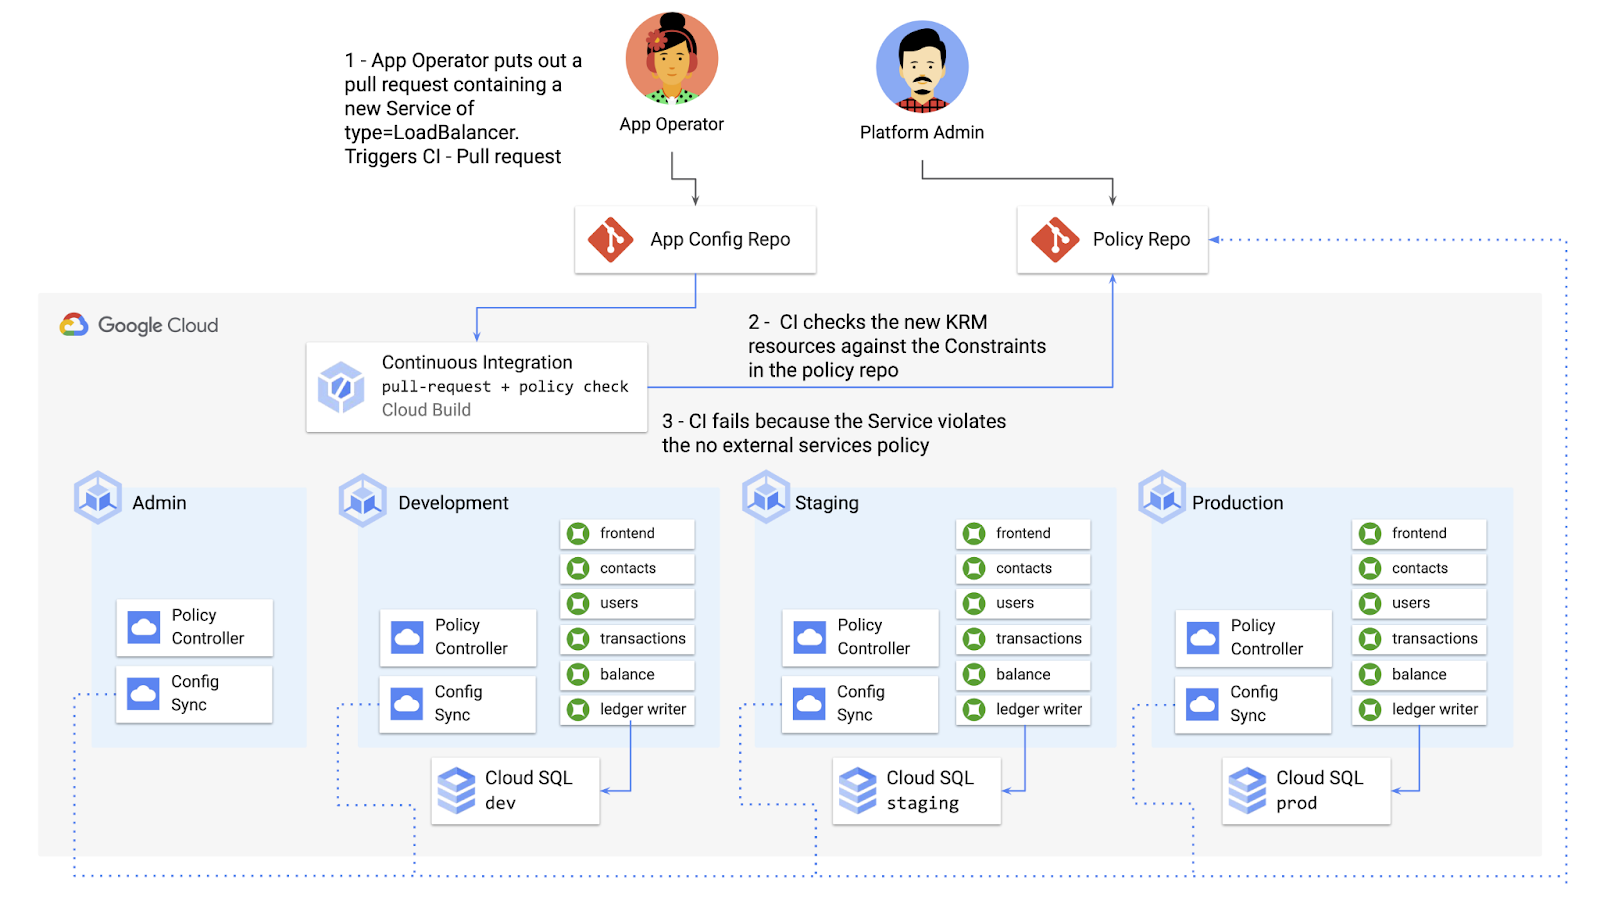
Policy Controller operates, by default, as a Kubernetes Admission Controller running inside the cluster. But Policy Controller also provides a “standalone” mode, running inside a container, that can be used outside of a cluster, such as from inside a Cloud Build pipeline.
In the example below, Cloud Build executes Policy Controller checks by getting the cymbalbank-app-config manifests, cloning the cymbalbank-policy resources, and using the “policy-controller-validate” container image to evaluate the app manifests against the policies.
steps:- id: 'Render prod manifests'name: 'gcr.io/google.com/cloudsdktool/cloud-sdk'entrypoint: '/bin/sh'args: ['-c', 'mkdir hydrated-manifests && kubectl kustomize overlays/prod > hydrated-manifests/prod.yaml']- id: 'Clone cymbalbank-policy repo'name: 'gcr.io/kpt-dev/kpt'entrypoint: '/bin/sh'args: ['-c', 'kpt pkg get https://github.com/$$GITHUB_USERNAME/cymbalbank-policy.git@main constraints&& kpt fn source constraints/ hydrated-manifests/ > hydrated-manifests/kpt-manifests.yaml']secretEnv: ['GITHUB_USERNAME']- id: 'Validate prod manifests against policies'name: 'gcr.io/config-management-release/policy-controller-validate'args: ['--input', 'hydrated-manifests/kpt-manifests.yaml']availableSecrets:secretManager:- versionName: projects/${PROJECT_ID}/secrets/github-username/versions/1env: 'GITHUB_USERNAME'timeout: '1200s' #timeout - 20 minutes
From here, an app developer or operator can know if their resources violate org-wide policies, by looking at the Cloud Build output for their Pull Request:
Status: Downloaded newer image for gcr.io/config-management-release/policy-controller-validate:latestError: Found 1 violations:[1] Number of containers in template (4) exceeds the allowed limit (3)
By integrating policy checks into CI/CD, app development teams can understand whether their resources are in compliance, and platform teams add an additional layer of policy checks to the platform.
Overall, Config Sync and Policy Controller can provide a powerful toolchain for standardizing base-layer config across a multi-cluster environment. Check out the Part 4 demo to try out each of these examples.
And stay tuned for Part 5, where we’ll learn how to use KRM to manage cloud-hosted resources.
AI Features in Apigee X Helps Build and Manage APIs at Scale

5270
Of your peers have already read this article.
2:00 Minutes
The most insightful time you'll spend today!
APIs are the backbone of digital transformation. Via APIs, you can securely share data and functionality with developers both inside and outside of your organizational boundaries, letting you build applications faster, seamlessly connect and interact with partners, and drive new business revenue.
Because APIs encompass business-critical information, any downtime or performance degradation can lead to significant loss in revenue, customers, and brand value. Therefore, there’s mounting pressure on operations teams to ensure that APIs are always available and performing as expected. If the APIs go down, so too do the services that fuel customer experiences and on which the organization relies for collaboration and business processes.
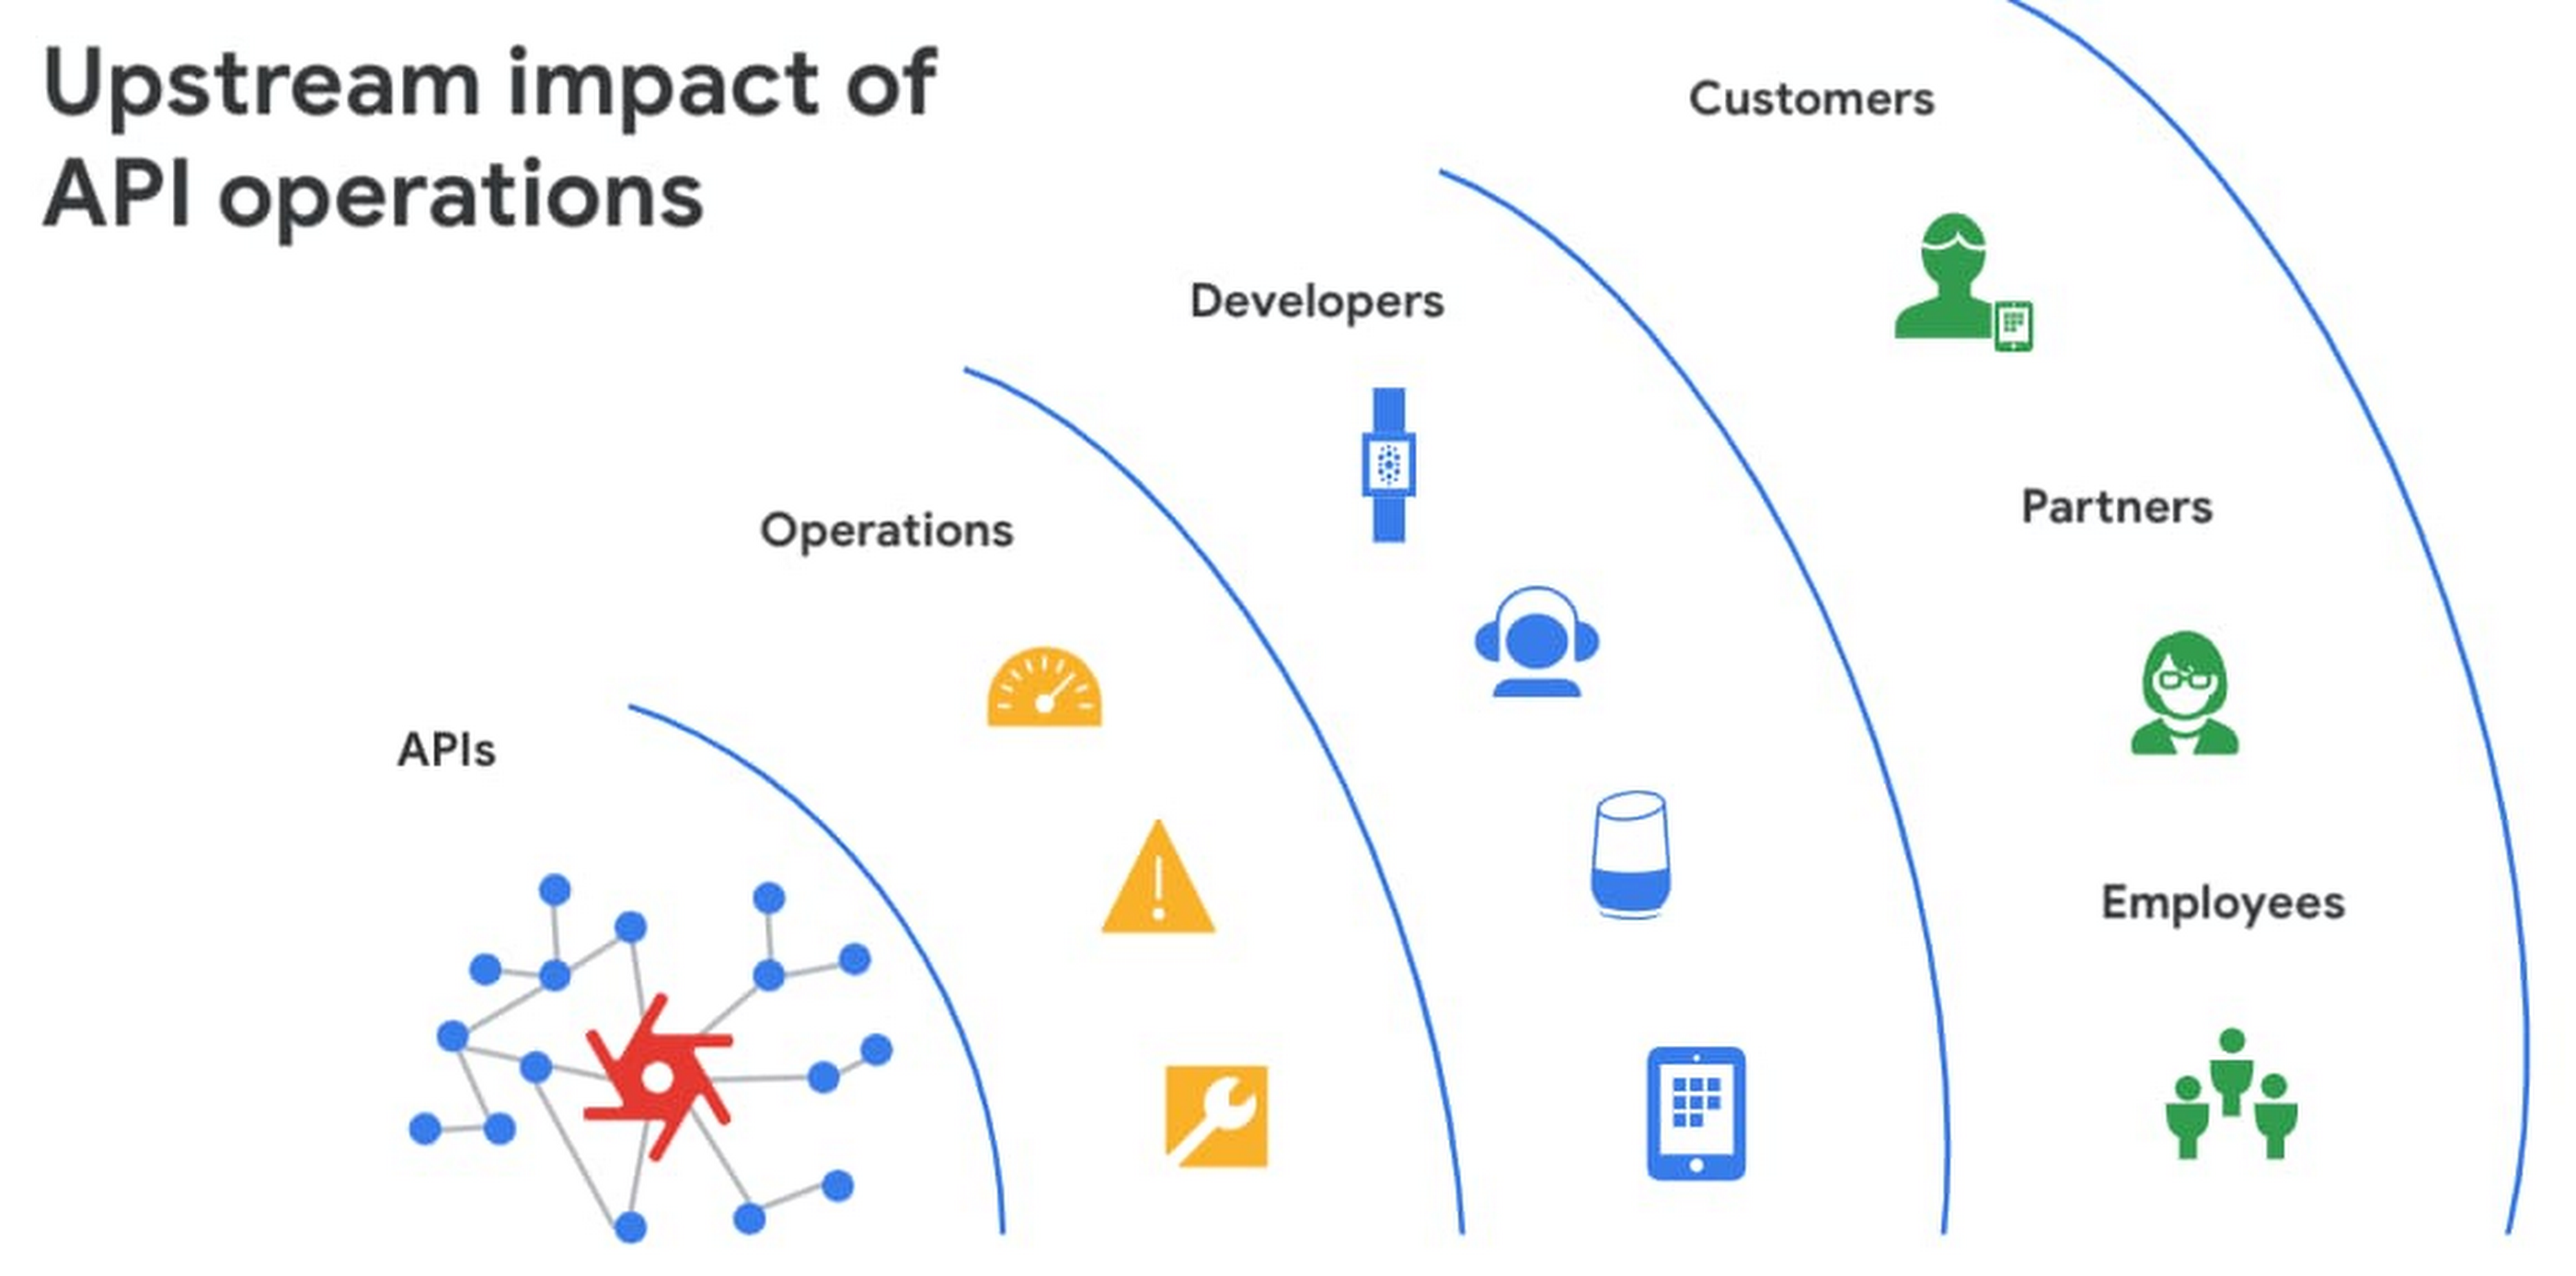
However, as you build and scale your API programs, it becomes practically impossible for API operators to manually monitor and manage all your APIs. To help, we brought the power of industry-leading AI and ML technologies to API operations via Apigee X, a major release of our API management platform. Apigee X seamlessly weaves together Google Cloud’s expertise in AI, security and networking to help you efficiently build and manage APIs at scale.
Put your API data into action
Apigee applies machine learning to your API metadata and provides you the required tools that simplify various aspects of API operations. A great example of AI for APIs is anomaly detection:
- AI-powered rules trigger alerts based on a set of predefined conditions that are determined by applying Google’s industry-leading machine learning models to your historical API data.
- Auto-thresholds adjust the monitoring criteria of your APIs and set them to pattern-based values.
- Reduce overhead results because operators don’t have to manually monitor anomalies or adjust the monitoring thresholds on APIs.
“By applying AI and ML models to our historical API data, these advanced features are able to alert us about scenarios we haven’t thought of. Such automation capabilities significantly reduce our upfront efforts. And from a security perspective, the actionable insights help us ensure that our proxies are exposed only over secure HTTPs ports and adhere to compliance requirements. We’re also able to closely monitor user activity and quickly pull out reports during audits.” – Adam Brancato, Sr. Manager, Global Technology and Security at Citrix

As our customers scale their API programs, they find it extremely useful to harness AI-powered capabilities. In our recent State of the API Economy 2021 report, we found a 230% increase in enterprises’ use of anomaly detection, bot protection, and security analytics features.

To learn more about Apigee X, and see AI and machine learning in action, check out this video, and to try Apigee X for free, click here.
Investing for Future: Why Shifting Security Left Helps Your Bottom Line

4487
Of your peers have already read this article.
3:30 Minutes
The most insightful time you'll spend today!
The concept of “shifting left” has been widely promoted in the software development lifecycle. The concept is that introducing security earlier, or leftwards, in the development process will lead to fewer software-related security defects later, or rightwards, in production.
Shifting cloud security left can help identify potential misconfigurations earlier in the development cycle, which if unresolved can lead to security defects. Catching those misconfigurations early can improve the security posture of production deployments.
Why shifting security left matters
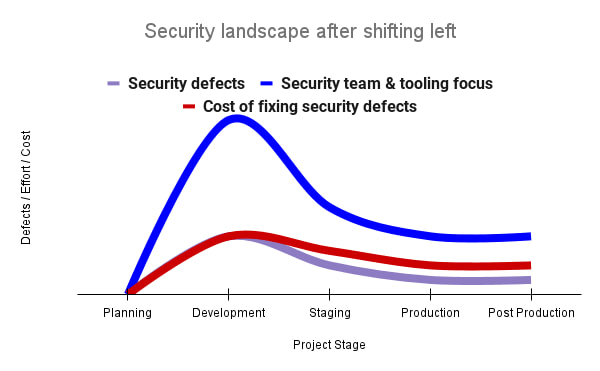
Google’s DevOps Research and Assessment (DORA) highlights the importance of integrating security into DevOps in the 2016 State of DevOps Report. The report discussed the placement of security testing in the software development lifecycle. The survey found that most security testing and tool usage happened after the development of a release, rather than continuously throughout the development lifecycle. This led to increased costs and friction because remediating problems found in testing may involve big architectural changes and additional integration testing, as shown in Figure 1. For example, security defects in production can lead to GDPR violations, which can carry fines up to 4% of global annual revenue.
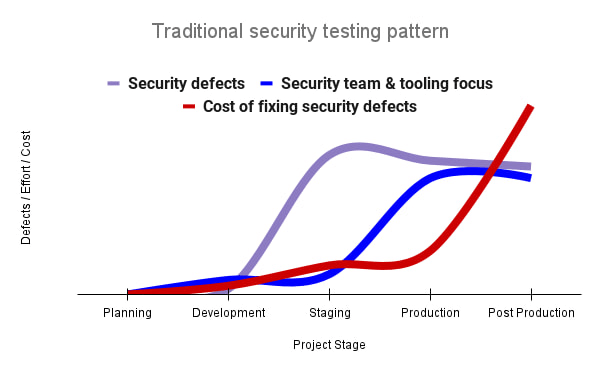
By inserting security testing into the development phase, we can identify security defects earlier and perform the appropriate remediation sooner. This results in fewer defects post-production and reduces remediation efforts and architectural changes. Figure 2 shows us that integrating security earlier in the SDLC results in overall decreases in security defects and associated remediation costs.
The 2021 State of DevOps Report expands the work of the 2016 report and advocates for integrating automated testing throughout the software development lifecycle. Automated testing is useful for continuously testing development code without the need for additional skills or intervention by the developer. Developers can continue to iterate quickly while other stakeholders can be confident that common defects are being identified and remediated.
From code to cloud
The DORA findings with regard to code security can also be applied to cloud infrastructure security. As more organizations deploy their workloads to the cloud, it’s important to test the security and configurations of cloud infrastructure. Misconfigurations in cloud resources can lead toward security incidents that could lead to data theft. Examples of such misconfigurations include overly permissive firewall rules, public IP addresses for VMs, or excessive Identity and Access Management (IAM) permissions on service accounts and storage buckets.
We can and should leverage different Google Cloud services to identify these misconfigurations early in the development process and prevent such errors from emerging in production to reduce the costs of future remediation, potential legal fines, and compromised customer trust.
The key tools in our toolshed are Security Command Center and Cloud Build. Security Command Center provides visibility into misconfigurations, vulnerabilities, and threats within a Google Cloud organization. This information is critical when protecting your cloud infrastructure (such as virtual machines, containers, web applications) against threats, or identifying potential gaps from compliance frameworks (such as CIS Benchmarks, PCI-DSS, NIST 800-53, or ISO 27001.
Security Command Center further supports shifting security left by allowing visibility of security findings at the cloud project level for individual developers, while still allowing global visibility for Security Operations. Cloud Build provides for the creation of cloud-native CI/CD pipelines. You can insert custom health checks into a pipeline to evaluate certain conditions (such as security metrics) and fail the pipeline when irregularities are detected. We will now explore two use cases that take advantage of these tools.
Security Health Checker
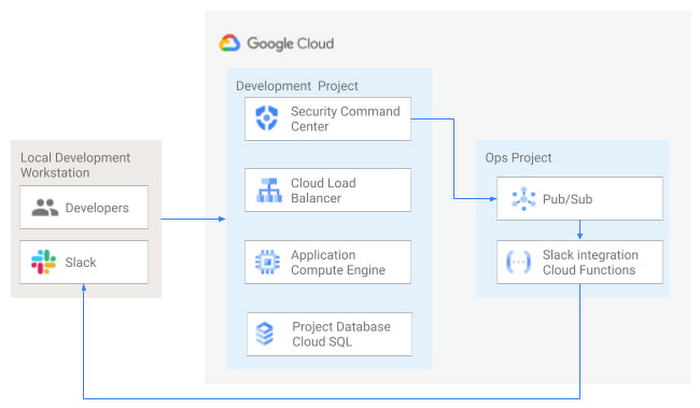
Security Health Checker continuously monitors the security health of a Google Cloud project and promptly notifies project members of security findings. Figure 3 shows developers interacting with a Google Cloud environment with network, compute, and database components. Security Command Center is configured to monitor the health of the project.
When Security Command Center identifies findings, it sends them to a Cloud Pub/Sub topic. A Cloud Function then takes the findings published to that topic and sends them to a Slack channel monitored by infrastructure developers. Just like a spell checker providing quick feedback on misspellings, Security Health Checker provides prompt feedback on security misconfigurations in a Google Cloud project that could lead to deployment failures or post-production compromises. No additional effort is required on the part of developers.
Security Pipeline Checker
In addition to using Security Command Center for timely notification of security concerns during the development process, we can also integrate security checks into the CI/CD pipeline by using Security Command Center along with Cloud Build as shown in Figure 4.
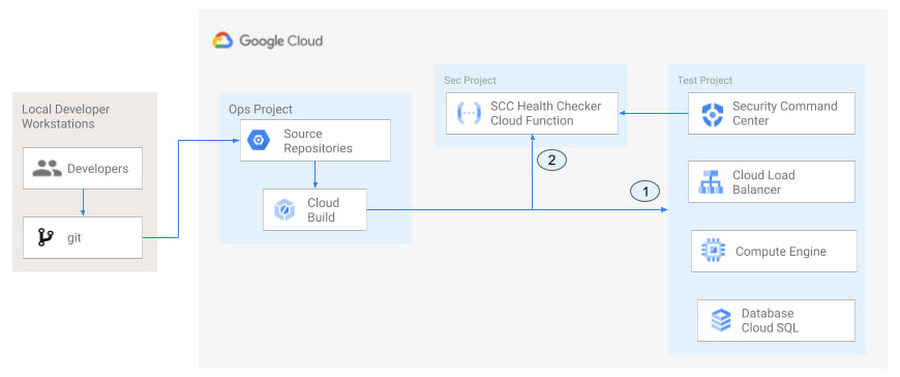
The pipeline begins with a developer checking code into a git repository. This repository is mirrored to Cloud Source Repositories. A build trigger will begin the build process. The build pipeline will include a short waiting period of a few minutes to give Security Command Center a chance to identify security vulnerabilities. A brief delay may appear undesirable at first, but the analysis that takes place during that interval can result in the reduction of security defects post-production.
At the end of the waiting period, a Cloud Function serving as a Security Health Checker will evaluate the findings from Security Command Center (Connector 1 in Figure 4). If the validator determines that unacceptable security findings exist, the validator will inject a failure indication into the pipeline to terminate the build process (Connector 2 in Figure 4). Developers have visibility into the failure triggers and remediate them before successfully deploying code to production. This is in contrast to the findings in the 2016 State of DevOps Report wherein organizations that didn’t integrate security into their DevOps processes spent 50% more time remediating security issues than those who “shifted left” on security.
Closing thoughts
DORA’s 2016 State of DevOps report called out the need for “shifting left” with security, introducing security earlier in the development process to identify security vulnerabilities early to reduce mitigation efforts post-production. The report also advocated for automated testing throughout the software development lifecycle.
We looked at two ways of achieving these objectives in Google Cloud. The Security Health Checker provides feedback to developers using Security Command Center and Slack to notify developers of security findings as they pursue their development activities. The Security Pipeline Checker uses Security Command Center as part of a Cloud Build pipeline to terminate a build pipeline if vulnerabilities are identified during the build process. To implement the Security Heath Checker and the Security Pipeline Checker, check out the GitHub repository. We hope these examples will help you to “shift left” using Google Cloud services. Happy coding!
This article was co-authored with Jason Bisson, Bakh Inamov, Jeff Levne, Lanre Ogunmola, Luis Urena, and Holly Willey, Security & Compliance Specialists at Google Cloud.
The Evolving Landscape of Multicloud: A Journey, Not a Destination

2708
Of your peers have already read this article.
2:30 Minutes
The most insightful time you'll spend today!
Editor’s note: This post is part of an ongoing series on IT predictions from Google Cloud experts. Check out the full list of our predictions on how IT will change in the coming years.
Prediction: Over half of all organizations using public cloud will freely switch their primary cloud provider as a result of available multicloud capabilities
In the years ahead, companies will use a multicloud strategy not just as a way to hedge their bets, but as a way to switch from their first cloud to their next one. Research shows that the majority of companies are already multicloud, meaning they use more than one hyperscale cloud provider.
More and more, we’re talking to companies that describe using multicloud technologies as a way to do switch not just workloads — but mindshare — to a different cloud. In other words, for many people, multicloud is a phase, not a permanent state.
You may start using one cloud but still need to be able to incorporate existing investments you’ve already made in other clouds without having to move anything. Here at Google Cloud, we’ve made unique investments to make sure we can meet our customers wherever, and in whatever cloud, they are.
For instance, Anthos, our multicloud management plane, ensures consistency when working with your compute and data on other clouds. You can view workloads, deploy services, and apply common security policies across multiple clouds. BigQuery Omni allows you to query data in other cloud storage accounts in Amazon S3 or Azure Storage without having to move the data itself, helping to bring analytics to data wherever it resides.
Building new skills and getting comfortable in other clouds is not where multicloud stops. Many organizations are taking it a step further — upgrading technology, moving core data, and continuing to grow cloud adoption with a secondary provider.
What starts out as wanting the best capabilities to achieve IT goals will often lead organizations to swap from their first cloud to their next cloud — and by 2025, we believe that most organizations will be doing just that.
How to Decide Whether to Run a Database on Kubernetes

5615
Of your peers have already read this article.
3:30 Minutes
The most insightful time you'll spend today!
Today, more and more applications are being deployed in containers on Kubernetes—so much so that we’ve heard Kubernetes called the Linux of the cloud.
Despite all that growth on the application layer, the data layer hasn’t gotten as much traction with containerization. That’s not surprising, since containerized workloads inherently have to be resilient to restarts, scale-out, virtualization, and other constraints. So handling things like state (the database), availability to other layers of the application, and redundancy for a database can have very specific requirements. That makes it challenging to run a database in a distributed environment.
However, the data layer is getting more attention, since many developers want to treat data infrastructure the same as application stacks.
Operators want to use the same tools for databases and applications, and get the same benefits as the application layer in the data layer: rapid spin-up and repeatability across environments. In this blog, we’ll explore when and what types of databases can be effectively run on Kubernetes.
Before we dive into the considerations for running a database on Kubernetes, let’s briefly review our options for running databases on Google Cloud Platform (GCP) and what they’re best used for.
- Fully managed databases. This includes Cloud Spanner, Cloud Bigtable and Cloud SQL, among others. This is the low-ops choice, since Google Cloud handles many of the maintenance tasks, like backups, patching and scaling. As a developer or operator, you don’t need to mess with them. You just create a database, build your app, and let Google Cloud scale it for you. This also means you might not have access to the exact version of a database, extension, or the exact flavor of database that you want.
- Do-it-yourself on a VM. This might best be described as the full-ops option, where you take full responsibility for building your database, scaling it, managing reliability, setting up backups, and more. All of that can be a lot of work, but you have all the features and database flavors at your disposal.
- Run it on Kubernetes. Running a database on Kubernetes is closer to the full-ops option, but you do get some benefits in terms of the automation Kubernetes provides to keep the database application running. That said, it is important to remember that pods (the database application containers) are transient, so the likelihood of database application restarts or failovers is higher. Also, some of the more database-specific administrative tasks—backups, scaling, tuning, etc.—are different due to the added abstractions that come with containerization.
Tips for running your database on Kubernetes
When choosing to go down the Kubernetes route, think about what database you will be running, and how well it will work given the trade-offs previously discussed.
Since pods are mortal, the likelihood of failover events is higher than a traditionally hosted or fully managed database. It will be easier to run a database on Kubernetes if it includes concepts like sharding, failover elections and replication built into its DNA (for example, ElasticSearch, Cassandra, or MongoDB). Some open source projects provide custom resources and operators to help with managing the database.
Next, consider the function that database is performing in the context of your application and business. Databases that are storing more transient and caching layers are better fits for Kubernetes. Data layers of that type typically have more resilience built into the applications, making for a better overall experience.
Finally, be sure you understand the replication modes available in the database. Asynchronous modes of replication leave room for data loss, because transactions might be committed to the primary database but not to the secondary database(s). So, be sure to understand whether you might incur data loss, and how much of that is acceptable in the context of your application.
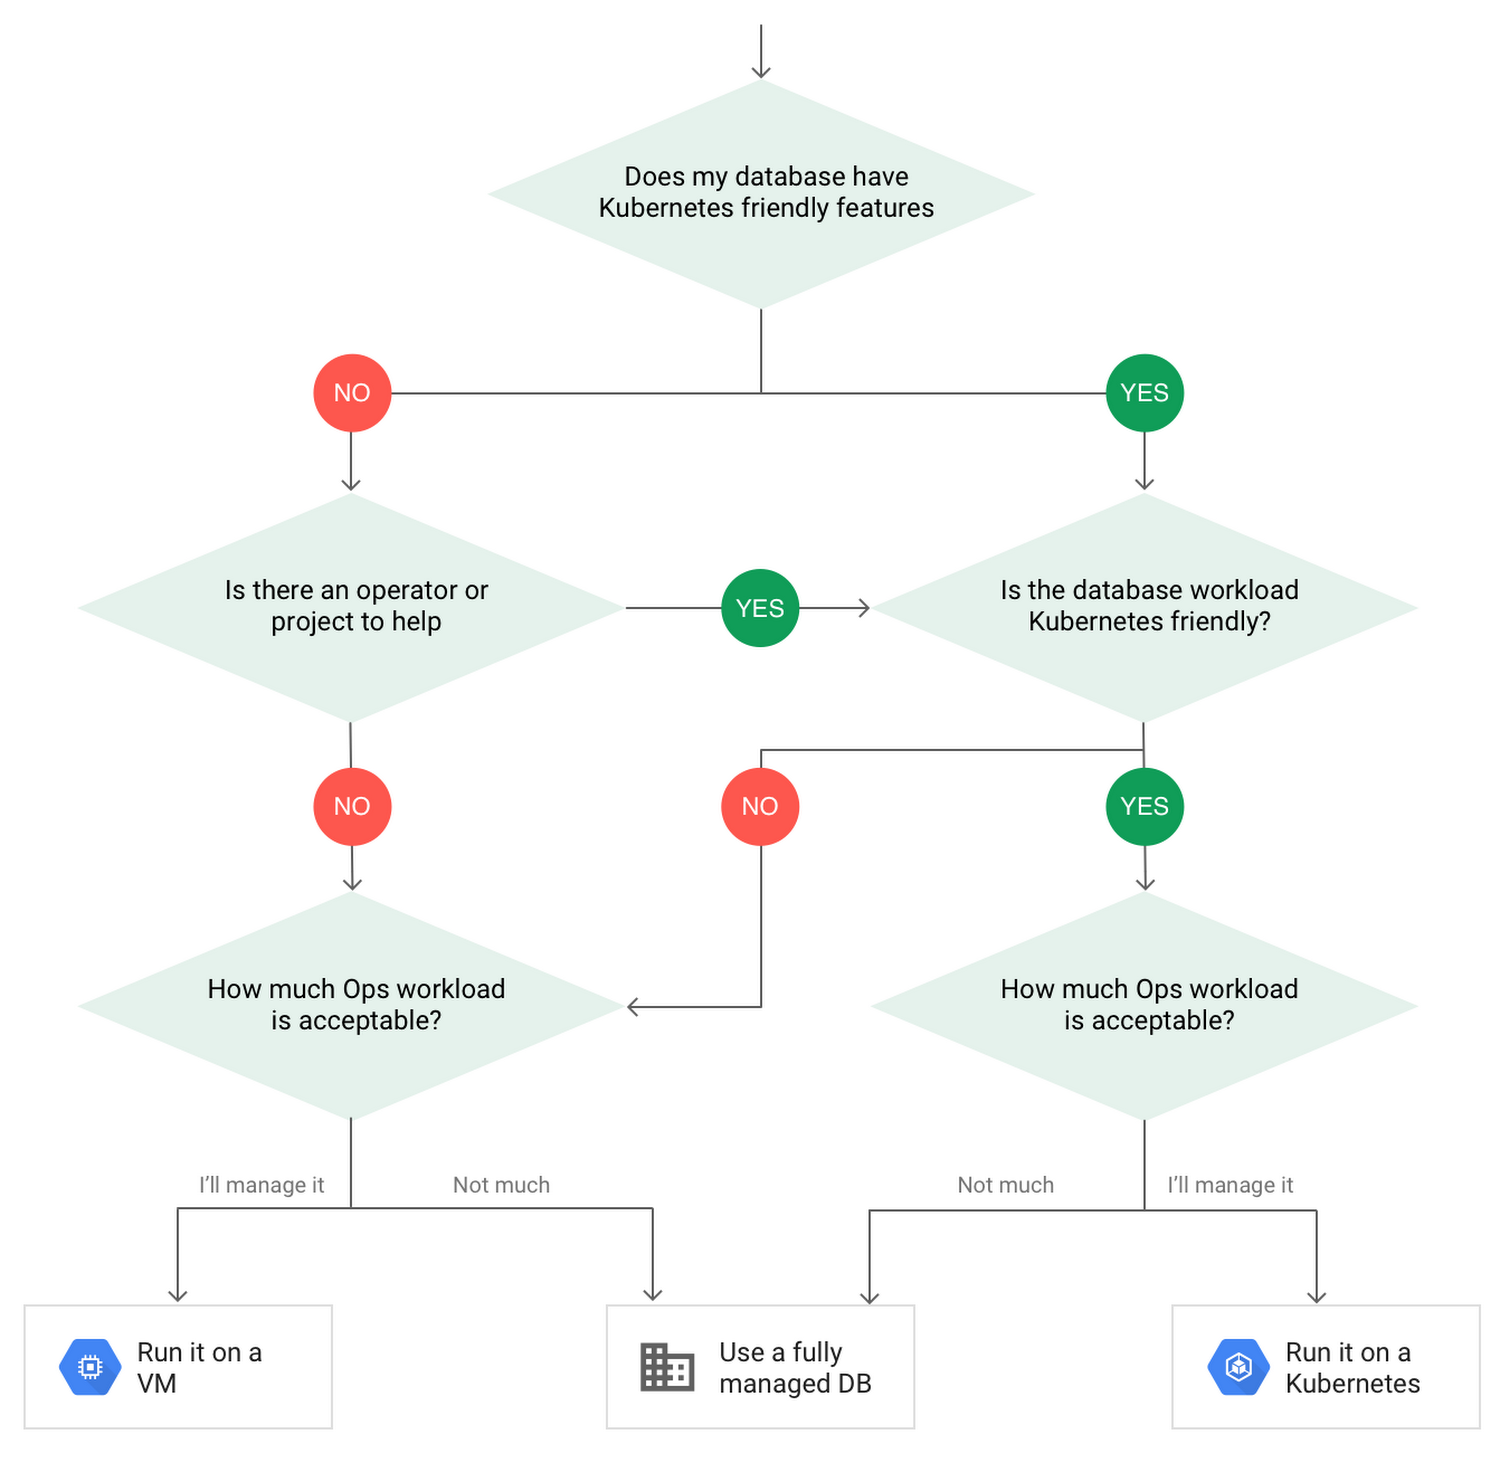
After evaluating all of those considerations, you’ll end up with a decision tree looking something like this:
How to deploy a database on Kubernetes
Now, let’s dive into more details on how to deploy a database on Kubernetes using StatefulSets.
With a StatefulSet, your data can be stored on persistent volumes, decoupling the database application from the persistent storage, so when a pod (such as the database application) is recreated, all the data is still there.
Additionally, when a pod is recreated in a StatefulSet, it keeps the same name, so you have a consistent endpoint to connect to. Persistent data and consistent naming are two of the largest benefits of StatefulSets. You can check out the Kubernetes documentation for more details.
If you need to run a database that doesn’t perfectly fit the model of a Kubernetes-friendly database (such as MySQL or PostgreSQL), consider using Kubernetes Operators or projects that wrap those database with additional features. Operators will help you spin up those databases and perform database maintenance tasks like backups and replication. For MySQL in particular, take a look at the Oracle MySQL Operator and Crunchy Data for PostgreSQL.
Operators use custom resources and controllers to expose application-specific operations through the Kubernetes API. For example, to perform a backup using Crunchy Data, simply execute pgo backup [cluster_name]. To add a Postgres replica, use pgo scale cluster [cluster_name].
There are some other projects out there that you might explore, such as Patroni for PostgreSQL. These projects use Operators, but go one step further. They’ve built many tools around their respective databases to aid their operation inside of Kubernetes. They may include additional features like sharding, leader election, and failover functionality needed to successfully deploy MySQL or PostgreSQL in Kubernetes.
While running a database in Kubernetes is gaining traction, it is still far from an exact science. There is a lot of work being done in this area, so keep an eye out as technologies and tools evolve toward making running databases in Kubernetes much more the norm.
When you’re ready to get started, check out GCP Marketplace for easy-to-deploy SaaS, VM, and containerized database solutions and operators that can be deployed to GCP or Kubernetes clusters anywhere.
More Relevant Stories for Your Company



Modernize Your Security Posture for Cloud-Native Applications with Anthos
Modern security approaches have moved beyond a traditional perimeter-based security model. As many organizations seek to adopt cloud-native architectures and are deploying applications in hybrid and multi-cloud environments they demand a more flexible and extensible approach towards security. Learn how to address security issues as early in the development and

Google Cloud Next ’22 to Commence in October: Block Your Calendar!
We’re excited to announce that Google Cloud Next returns on October 11–13, 2022. Join us for keynotes from industry luminaries and engage live with Google developers. Explore dynamic content across various learning levels, and dive deep into technologies and solutions spanning the Google Cloud and Google Workspace portfolios. Participate in breakout sessions,



API Design Best Practices and Common Pitfalls
The job of an API is to make the application developer as successful as possible. When crafting APIs, the primary design principle should be to maximize application developer productivity and promote adoption. API designers and developers generally understand the importance of adhering to design principles while implementing an interface. No