





Renaulution: Renault’s story of migrating to 70 applications in 2 years

3318
Of your peers have already read this article.
3:00 Minutes
The most insightful time you'll spend today!
Editor’s note: Renault, the French automaker, embarked on a wholesale migration of its information systems—moving 70 applications to Google Cloud. Here’s how they migrated from Oracle databases to Cloud SQL for PostgreSQL.
The Renault Group, known for its iconic French cars has grown to include four complementary brands, and sold nearly 3 million vehicles in 2020. Following our company-wide strategic plan, “Renaulution,” we’ve shifted our focus over the past year from a car company integrating tech, to a tech company integrating cars that will develop software for our business. For the information systems group, that meant modernizing our entire portfolio and migrating 70 in-house applications (our quality and customer information systems) to Google Cloud. It was an ambitious project, but it’s paid off. In two years we migrated our Quality and Customer Satisfaction information systems applications, optimized our code, and cut costs thanks to managed database services. Compared to our on-premises infrastructure, using Google Cloud services and open-source technologies comes to roughly one dollar per user per year, which is significantly cheaper.
An ambitious journey to Google Cloud
We began our cloud journey in 2016 with digital projects integrating a new way of working and new technologies. These new technologies included those for agility at scale, data capabilities and CI/CD toolchain. Google Cloud stood out as the clear choice for its data capabilities. Not only are we using BigQuery and Dataflow to improve scaling and costs, but we are also now using fully managed database services like Cloud SQL for PostgreSQL. Data is a key asset for a modern car maker because it connects the car maker to the user, allows car makers to better understand usage and better informs what decisions we should make about our products and services. After we migrated our data lake to Google Cloud, it was a natural next step to move our front-end applications to Google Cloud so they would be easier to maintain and we could benefit from faster response times. This project was no small undertaking. For those 70 in-house applications (e.g. vehicle quality evaluation, statistical process control in plants, product issue management, survey analysis), for our information systems landscape, we had a range of technologies—including Oracle, MySQL, Java, IBM MQ, and CFT—with some applications created 20 years ago.
Champions spearhead each migration
Before we started the migration, we did a global analysis of the landscape to understand each application and its complexity. Then we planned a progressive approach, focusing on the smallest applications first such as those with a limited number of screens or with simple SQL queries, and saving the largest for last. Initially we used some automatic tools for the migration, but we learned very quickly nothing can replace the development team’s institutional knowledge. They served as our migration champions.
The apps go marching one by one
When we migrated our first few Oracle databases to Cloud SQL for PostgreSQL we tracked our learnings in an internal wiki to share common SQL patterns, which helped us speed up the process. For some applications, we simplified the architecture and took the opportunity to analyze and optimize SQL queries during the rework. We also used monitoring tools like Dynatrace and JavaMelody to ensure we improved the user experience.
The approach we developed was very successful—where database migration was initially seen as insurmountable, the entire migration project was completed in two years.
With on-premises applications it was hard for our developers to separate code performance from infrastructure limitations. So as part of our migration to Google Cloud, we optimized our applications with monitoring services. With these insights our team has more control over resources, which has reduced our maintenance and operations activity and resulted in faster, more stable applications. Plus, migrating to Cloud SQL has made it much easier for us to change our infrastructure as needed, add more power when necessary or even reduce our infrastructure size.
A new regime on Cloud SQL
Now that we’re running on Cloud SQL, we’ve improved performance even on large databases with many connected users. Thanks to built-in tools in the Google Cloud environment, we can now easily understand performance issues and quickly solve them. For example, we were able to reduce the duration of a heavy batch processing by a factor of three from nine to three hours. And we don’t have to wait for the installation of a new server, so our team can move faster. Beyond speed, we’ve also been able to cut costs. We optimized our code based on insights from monitoring tools, which not only enabled a more responsive application for the user, but it also reduced our costs because we’re not overprovisioned.
Learn more about the Renault Group and try out Cloud SQL today.
BigQuery Explainable AI for Demystifying the Inner Workings of ML Models. Now GA!

6562
Of your peers have already read this article.
2:00 Minutes
The most insightful time you'll spend today!
Explainable AI (XAI) helps you understand and interpret how your machine learning models make decisions. We’re excited to announce that BigQuery Explainable AI is now generally available (GA). BigQuery is the data warehouse that supports explainable AI in a most comprehensive way w.r.t both XAI methodology and model types. It does this at BigQuery scale, enabling millions of explanations within seconds with a single SQL query.
Why is Explainable AI so important? To demystify the inner workings of machine learning models, Explainable AI is quickly becoming an essential and growing need for businesses as they continue to invest in AI and ML. With 76% of enterprises now prioritizing artificial intelligence (AI) and machine learning (ML) over other initiatives in 2021 IT budgets, the majority of CEOs (82%) believe that AI-based decisions must be explainable to be trusted according to a PwC survey.
While the focus of this blogpost is on BigQuery Explainable AI, Google Cloud provides a variety of tools and frameworks to help you interpret models outside of BigQuery, such as with Vertex Explainable AI, which includes AutoML Tables, AutoML Vision, and custom-trained models.
So how does Explainable AI in BigQuery work exactly? And how might you use it in practice?
Two types of Explainable AI: global and local explainability
When it comes to Explainable AI, the first thing to note is that there are two main types of explainability as they relate to the features used to train the ML model: global explainability and local explainability.
Imagine that you have a ML model that predicts housing price (as a dollar amount), based on three features: (1) number of bedrooms, (2) distance to the nearest city center, and (3) construction date.
Global explainability (a.k.a. global feature importance) describes the features’ overall influence on the model and helps you understand if a feature had a greater influence than other features over the model’s predictions. For example, global explainability can reveal that the number of bedrooms and distance to city center typically has a much stronger influence than the construction date on predicting housing prices. Global explainability is especially useful if you have hundreds or thousands of features and you want to determine which features are the most important contributors to your model. You may also consider using global explainability as a way to identify and prune less important features to improve the generalizability of their models.
Local explainability (a.k.a. feature attributions) describes the breakdown of how each feature contributes towards a specific prediction. For example, if the model predicts that house ID#1001 has a predicted price of $230,000, local explainability would describe a baseline amount (e.g. $50,000) and how each of the features contributes on top of the baseline towards the predicted price. For example, the model may say that on top of the baseline of $50,000, having 3 bedrooms contributed an additional $50,000, close proximity to the city center added $100,000, and construction date of 2010 added $30,000, for a total predicted price of $230,000. In essence, understanding the exact contribution of each feature used by the model to make each prediction is the main purpose of local explainability.
What ML models does BigQuery Explainable AI apply to?
BigQuery Explainable AI applies to a variety of models, including supervised learning models for IID data and time series models. The documentation for BigQuery Explainable AI provides an overview of the different ways of applying explainability per model. Note that each explainability method has its own way of calculation (e.g. Shapley values), which are covered more in-depth in the documentation.

Examples with BigQuery Explainable AI
In this next section, we will show three examples of how to use BigQuery Explainable AI in different ML applications:
Regression models with BigQuery Explainable AI
Let’s use a boosted tree regression model to predict how much a taxi cab driver will receive in tips for a taxi ride, based on features such as number of passengers, payment type, total payment and trip distance. Then let’s use BigQuery Explainable AI to help us understand how the model made the predictions in terms of global explainability (which features were most important?) and local explainability (how did the model arrive at each prediction?).
The taxi trips dataset comes from the BigQuery public datasets and is publicly available in the table: bigquery-public-data.new_york_taxi_trips.tlc_yellow_trips_2018.
First, you can train a boosted tree regression model.
CREATE OR REPLACE MODEL bqml_tutorial.taxi_tip_regression_modelOPTIONS (model_type='boosted_tree_regressor',input_label_cols=['tip_amount'],max_iterations = 50,tree_method = 'HIST',subsample = 0.85,enable_global_explain = TRUE) ASSELECTvendor_id,passenger_count,trip_distance,rate_code,payment_type,total_amount,tip_amountFROM`bigquery-public-data.new_york_taxi_trips.tlc_yellow_trips_2018`WHERE tip_amount >= 0LIMIT 1000000
Now let’s do a prediction using ML.PREDICT, which is the standard way in BigQuery ML to make predictions without explainability.
SELECT *FROMML.PREDICT(MODEL bqml_tutorial.taxi_tip_regression_model,(SELECT"0" AS vendor_id,1 AS passenger_count,CAST(5.85 AS NUMERIC) AS trip_distance,"0" AS rate_code,"0" AS payment_type,CAST(55.56 AS NUMERIC) AS total_amount))

But you might wonder—how did the model generate this prediction of ~11.077?
BigQuery Explainable AI can help us answer this question. Instead of using ML.PREDICT, you use ML.EXPLAIN_PREDICT with an additional optional parameter top_k_features. ML.EXPLAIN_PREDICT extends the capabilities of ML.PREDICT by outputting several additional columns that explain how each feature contributes to the predicted value. In fact, since ML.EXPLAIN_PREDICT includes all the output from ML.PREDICT anyway, you may want to consider using ML.EXPLAIN_PREDICT every time instead.
SELECT *FROMML.EXPLAIN_PREDICT(MODEL bqml_tutorial.taxi_tip_regression_model,(SELECT"0" AS vendor_id,1 AS passenger_count,CAST(5.85 AS NUMERIC) AS trip_distance,"0" AS rate_code,"0" AS payment_type,CAST(55.56 AS NUMERIC) AS total_amount),STRUCT(6 AS top_k_features))

The way to interpret these columns is:
Σfeature_attributions + baseline_prediction_value = prediction_value
Let’s break this down. The prediction_value is ~11.077, which is simply the predicted_tip_amount. The baseline_prediction_value is ~6.184, which is the tip amount for an average instance. top_feature_attributions indicates how much each of the features contributes towards the prediction value. For example, total_amount contributes ~2.540 to the predicted_tip_amount.
ML.EXPLAIN_PREDICT provides local feature explainability for regression models. For global feature importance, see the documentation for ML.GLOBAL_EXPLAIN.
Classification models with BigQuery Explainable AI
Let’s use a logistic regression model to show you an example of BigQuery Explainable AI with classification models. We can use the same public dataset as before: bigquery-public-data.new_york_taxi_trips.tlc_yellow_trips_2018.
Train a logistic regression model to predict the bracket of the percentage of the tip amount out of the taxi bill.
CREATE OR REPLACE MODEL bqml_tutorial.taxi_tip_classification_modelOPTIONS(model_type='logistic_reg',input_label_cols=['tip_bucket'],enable_global_explain=true) ASSELECTvendor_id,passenger_count,trip_distance,rate_code,payment_type,total_amount,CASEWHEN tip_amount > total_amount*0.20 THEN '20% or more'WHEN tip_amount > total_amount*0.15 THEN '15% to 20%'WHEN tip_amount > total_amount*0.10 THEN '10% to 15%'ELSE '10% or less'END AS tip_bucketFROM`bigquery-public-data.new_york_taxi_trips.tlc_yellow_trips_2018`WHERE tip_amount >= 0LIMIT 1000000
Next, you can run ML.EXPLAIN_PREDICT to get both the classification results and the additional information for local feature explainability. For global explainability, you can use ML.GLOBAL_EXPLAIN. Again, since ML.EXPLAIN_PREDICT includes all the output from ML.PREDICT anyway, you may want to consider using ML.EXPLAIN_PREDICT every time instead.
SELECT *FROMML.EXPLAIN_PREDICT(MODEL bqml_tutorial.taxi_tip_classification_model,(SELECT"0" AS vendor_id,1 AS passenger_count,CAST(5.85 AS NUMERIC) AS trip_distance,"0" AS rate_code,"0" AS payment_type,CAST(55.56 AS NUMERIC) AS total_amount),STRUCT(6 AS top_k_features))

Similar to the regression example earlier, the formula is used to derive the prediction_value:
Σfeature_attributions + baseline_prediction_value = prediction_value
As you can see in the screenshot above, the baseline_prediction_value is ~0.296. total_amount is the most important feature in making this specific prediction, contributing ~0.067 to the prediction_value, though followed by trip_distance. The feature passenger_count contributes negatively to prediction_value by -0.0015. The features vendor_id, rate_code, and payment_type did not seem to contribute much to the prediction_value.
You may wonder why the prediction_value of ~0.389 doesn’t equal the probability value of ~0.359. The reason is that unlike for regression models, for classification models, prediction_value is not a probability score. Instead, prediction_value is the logit value (i.e., log-odds) for the predicted class, which you could separately convert to probabilities by applying the softmax transformation to the logit values. For example, a three-class classification has a log-odds output of [2.446, -2.021, -2.190]. After applying the softmax transformation, the probability of these class predictions is [0.9905, 0.0056, 0.0038].
Time-series forecasting models with BigQuery Explainable AI

Explainable AI for forecasting provides more interpretability into how the forecasting model came to its predictions. Let’s go through an example of forecasting the number of bike trips in NYC using the new_york.citibike_trips public data in BigQuery.
You can train a time-series model ARIMA_PLUS:
CREATE OR REPLACE MODEL bqml_tutorial.nyc_citibike_arima_modelOPTIONS(model_type = 'ARIMA_PLUS',time_series_timestamp_col = 'date',time_series_data_col = 'num_trips',holiday_region = 'US') ASSELECTEXTRACT(DATE from starttime) AS date,COUNT(*) AS num_tripsFROM`bigquery-public-data.new_york.citibike_trips`GROUP BY dateNext, you can first try forecasting without explainability using ML.FORECAST:SELECT*FROMML.FORECAST(MODEL bqml_tutorial.nyc_citibike_arima_model,STRUCT(365 AS horizon, 0.9 AS confidence_level))
This function outputs the forecasted values and the prediction interval. Plotting it in addition to the input time series gives the following figure.

But how does the forecasting model arrive at its predictions? Explainability is especially important if the model ever generates unexpected results.
With ML.EXPLAIN_FORECAST, BigQuery Explainable AI provides extra transparency into the seasonality, trend, holiday effects, level (step) changes, and spikes and dips outlier removal. In fact, since ML.EXPLAIN_FORECAST includes all the output from ML.FORECAST anyway, you may want to consider using ML.EXPLAIN_FORECAST every time instead.
SELECT*FROMML.EXPLAIN_FORECAST(MODEL bqml_tutorial.nyc_citibike_arima_model,STRUCT(365 AS horizon, 0.9 AS confidence_level))

Compared to the previous figure which only shows the forecasting results, this figure shows much richer information to explain how the forecast is made.
First, it shows how the input time series is adjusted by removing the spikes and dips anomalies, and by compensating the level changes. That is:
time_series_adjusted_data = time_series_data - spikes_and_dips - step_changes
Second, it shows how the adjusted input time series is decomposed into different components such as both weekly and yearly seasonal components, holiday effect component and trend component. That is
time_series_adjusted_data = trend + seasonal_period_yearly + seasonal_period_weekly + holiday_effect + residual
Finally, it shows how these components are forecasted separately to compose the final forecasting results. That is:
time_series_data = trend + seasonal_period_yearly + seasonal_period_weekly + holiday_effect
For more information on these time series components, please see the documentation here.
Conclusion
With the GA of BigQuery Explainable AI, we hope you will now be able to interpret your machine learning models with ease.
Thanks to the BigQuery ML team, especially Lisa Yin, Jiashang Liu, Amir Hormati, Mingge Deng, Jerry Ye and Abhinav Khushraj. Also thanks to the Vertex Explainable AI team, especially David Pitman and Besim Avci.
Google Cloud and Climate Engine Collaborate to Support Climate Action in Public Sector

4819
Of your peers have already read this article.
1:30 Minutes
The most insightful time you'll spend today!
While there is uncertainty about how much the climate will change in the future, we know it won’t look like the past. Extreme weather events will increase in frequency and severity; the world will continue to warm, and the cost of climate change will increase.
Government plays a vital role in understanding and responding to these changes quickly. Achieving this improved response time will require data insights to ensure informed decision-making—from local to global scales. The challenge is not only urgent; it’s one of the world’s biggest “big data” problems.
Fortunately, new technologies to help us monitor the Earth are proliferating. Thousands of satellites take millions of images of the planet every day. Sensors generate data about temperature, precipitation, wind, soil conditions, and more—as frequently as every second. We have more information about the planet’s systems than at any other time in history. And the data will only continue to grow. The problem is not the lack of data–it is harnessing this data to drive insights for decision makers to tackle climate change. That’s why Google Cloud has partnered with Climate Engine.
How Climate Engine and Google Cloud enable greater climate resilience
Climate Engine is a scientist-led company that works with Google to accelerate and scale the use of Google Earth Engine’s world-class geospatial capacities (in addition to those of Google Cloud Storage and BigQuery, among other tools) in support of climate action in the public sector. Powered by Google Cloud’s infrastructure, Google Earth Engine (GEE) combines a multi-petabyte catalog of satellite imagery and geospatial datasets with planetary-scale analysis capabilities, enabling scientists, researchers, and developers to detect changes, map trends, and quantify differences on the Earth’s surface.
With cloud-based technologies, we can leverage massive computing at a scale that generates actionable insights from Earth-based data. These insights help us better manage resources, understand risks, predict changes, and respond to disasters as we meet the challenge of climate change. Geospatial AI combines the power of artificial intelligence (AI) and machine learning (ML) with geospatial analysis. Google Cloud’s Geospatial AI solutions provide departments and agencies with a centralized system to collect, process, and deliver Earth-based data into decision-making contexts.
Climate Engine and Google Cloud provide specialists with the opportunity to go back in time and see how our landscapes have changed due to changes in climate and other human activities over the past few decades. Years of data can now be quantitatively analyzed and visualized in a matter of a few seconds, enabling government agencies to fulfill their mandates by drawing invaluable insights into how landscapes are changing, what physical and natural assets are at risk, and where the opportunities are for reducing emissions and increasing carbon sequestration.
“This is game changing for natural resource managers and scientists at public institutions at all levels of government,” says Dr. Daniel McEvoy, regional climatologist, at the Desert Research Institute & Western Regional Climate Center, Nevada System of Higher Education.https://www.youtube.com/embed/aPGsi8bd_Zk?enablejsapi=1&
Use cases for geospatial climate information systems
The use cases for this technology are as varied as the climate challenges themselves. These include monitoring, predicting, and analyzing the risks of extreme weather events like floods, wildfire, drought, extreme heat, wind, and other climate hazards. Use cases also include tracking changes in ecosystems, disease vectors, water availability and quality, soil health, growing seasons, air pollution, and more. These use cases are some of the ways that Google Cloud and Climate Engine can help the public sector deliver on government mandates. These provide insights that are helpful for a wide range of departments, and that can be applied in spatial and temporal scales that are meaningful for governments to take action.
“Our planet is changing at a rate that we have never experienced,” says Forrest Melton of the NASA Western Water Applications Office. To respond to these changes, we must understand what is happening across a wide range of environmental variables and at geospatial scales that range from local to global. We now have access to more data about the planet than ever before. The big challenge is converting data into actionable insights and then rapidly integrating these insights into decision-making systems. Climate Engine and Google Cloud help resolve this problem through innovative analytical tools and effective use of cloud computing.”
Climate change carries an existential risk to our current and future stability and security. Together, we are working to provide transformational technologies that help meet that risk and build a safer, more resilient future for all of us.
Learn more about Google Cloud’s environmental initiatives here and here.
Analytics Hub for Secure Data Sharing and Analytics Unlocks True Data Value and Insights

6744
Of your peers have already read this article.
2:30 Minutes
The most insightful time you'll spend today!
Customers tell us that sharing and exchanging data with other organizations is a critical element of their analytics strategy, but it’s hamstrung by unreliable data and processes, and only getting harder with security threats and privacy regulations on the rise.
Furthermore, traditional data sharing techniques use batch data pipelines that are expensive to run, create late arriving data, and can break with any changes to the source data. They also create multiple copies of data, which brings unnecessary costs and can bypass data governance processes. These techniques do not offer features for data monetization, such as managing subscriptions and entitlements. Altogether, these challenges mean that organizations are unable to realize the full potential of transforming their business with shared data.
To address these limitations, we are introducing Analytics Hub, a new fully managed service, available in Q3, in preview, that helps you unlock the value of data sharing, leading to new insights and increased business value. With Analytics Hub you get:
- A rich data ecosystem by publishing and subscribing to analytics-ready datasets.
- Control and monitoring over how your data is being used, because data is shared in one place.
- A self-service way to access valuable and trusted data assets, including data provided by Google. For example, a unique dataset from Google Search Trends will be available, that you can query and combine with your own data.
- An easy way to monetize your data assets without the overhead of building and managing the infrastructure.
Built on a decade of cross-organizational sharing
While Analytics Hub is a new service, it builds on BigQuery, Google’s petabyte-scale, serverless cloud data warehouse. BigQuery’s unique architecture provides separation between compute and storage, enabling data publishers to share data with as many subscribers as you want without having to make multiple copies of your data. With BigQuery, there are no servers to deploy or manage, which means that data consumers get immediate value from shared data. Data can be provided and consumed in real-time using the streaming capabilities of BigQuery and you can leverage the built in machine learning, geospatial, and natural language capabilities of BigQuery or take advantage of the native business intelligence support with tools like Looker, Google Sheets, and Data Studio.
BigQuery has had cross-organizational, in-place data sharing capabilities since it was introduced in 2010. We took a look at usage metrics in BigQuery and found that over a 7 day period in April, we had over 3,000 different organizations sharing over 200 petabytes of data. These numbers don’t include data sharing between departments within the same organization.
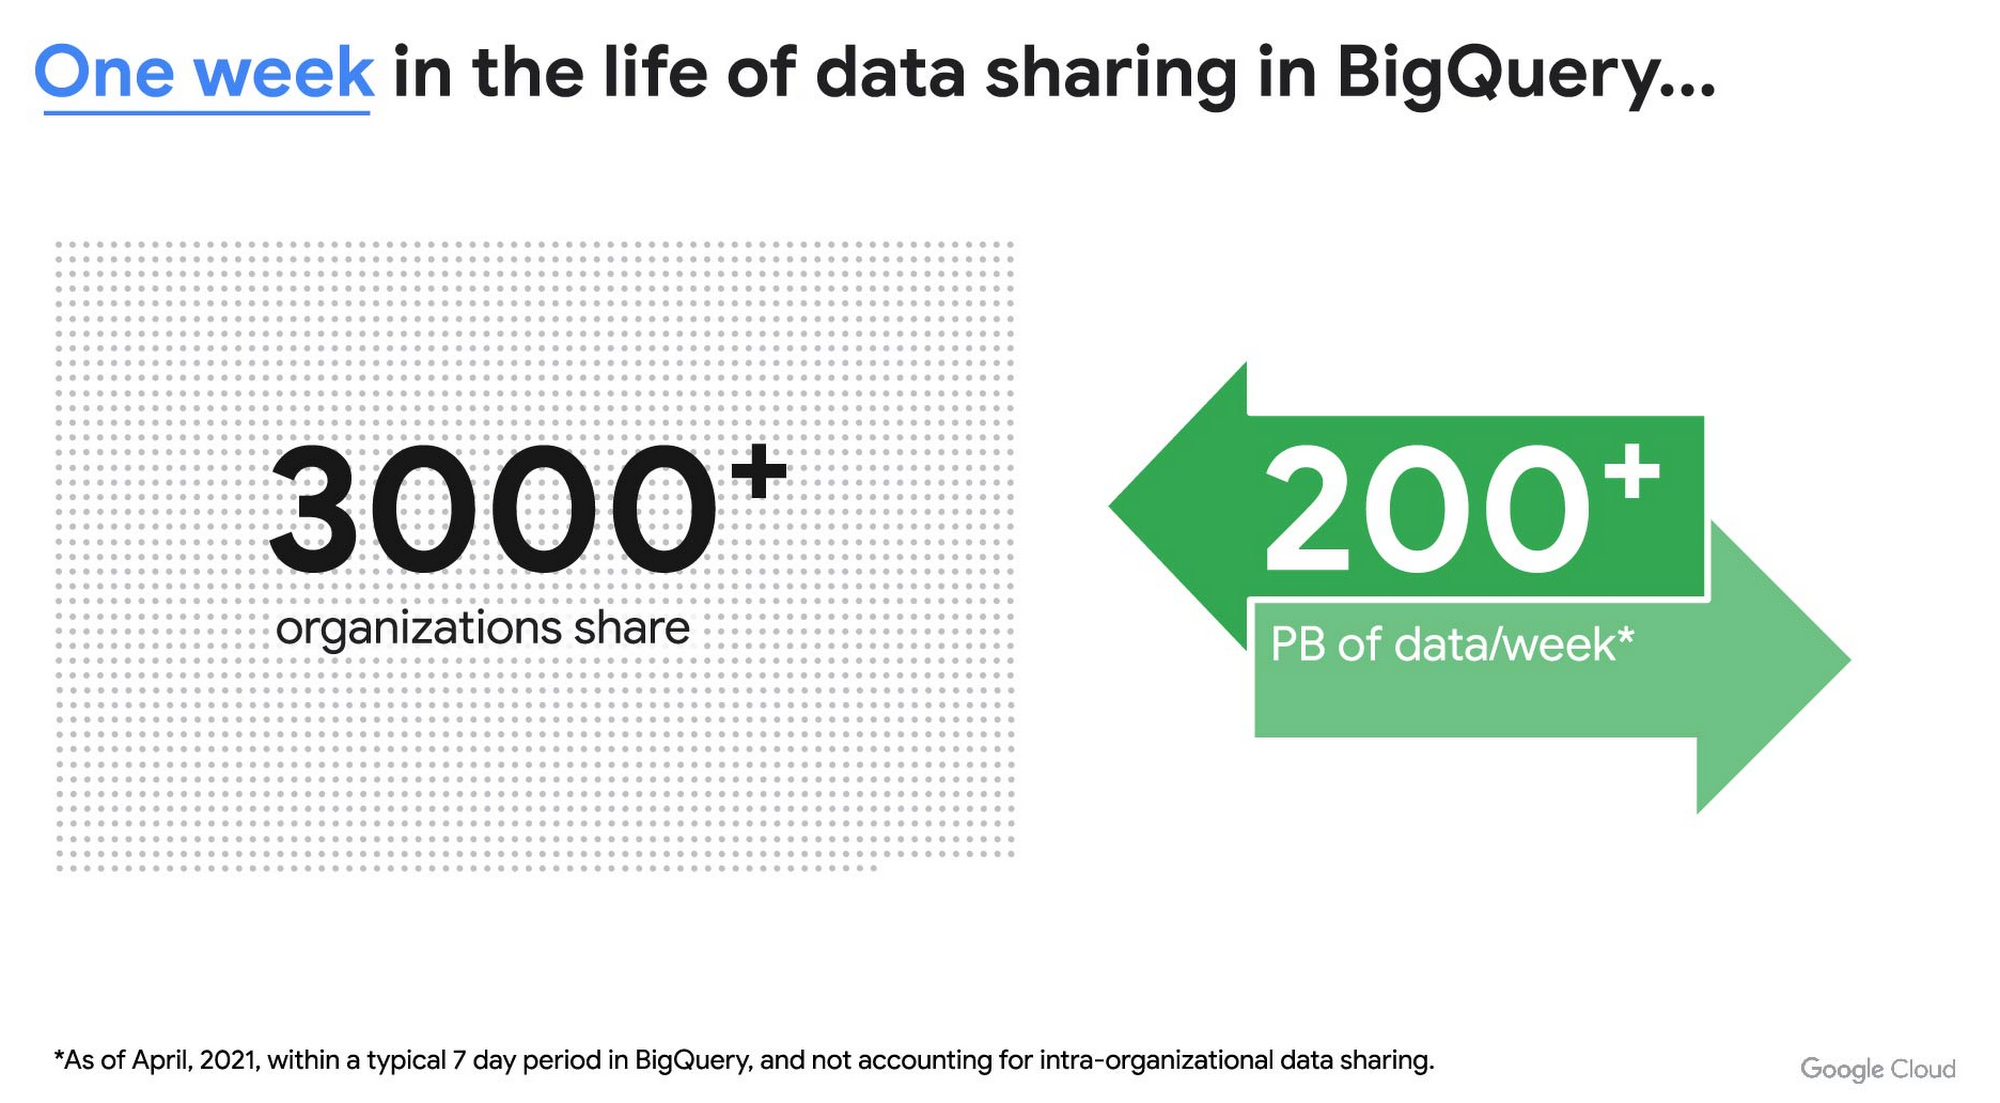
As you can see, data sharing in BigQuery is already popular. But we want to make it easier and even more scalable.
Raising the bar on data sharing
To make data sharing easier and more scalable in BigQuery, Analytics Hub introduces the concepts of shared datasets and exchanges. As a data publisher, you create shared datasets that contain the views of data that you want to deliver to your subscribers. Next, you create exchanges, which are used to organize and secure shared datasets. By default, exchanges are completely private, which means that only the users and groups that you give access to can view or subscribe to the data. You can also create internal exchanges or leverage public exchanges provided by Google. Finally, you publish shared datasets into an exchange to make them available to subscribers.
Data subscribers search through the datasets that are available across all exchanges for which they have access and subscribe to relevant datasets. This creates a linked dataset in their project that they can query and join with their own data. Subscribers pay for the queries that they run against the data while the publisher pays for the storage of the data. Data providers can add new data, new tables, or new columns to the shared dataset and these will be immediately available to subscribers. In addition, the publisher can track subscribers, disable subscriptions, and see aggregated usage information for the shared data.
Analytics Hub makes it easy for you to publish, discover, and subscribe to valuable datasets that you can combine with your own data to derive unique insights. Here are some types of data that will be available through Analytics Hub:
- Public datasets: Easy access to the existing repository of over 200 public datasets, including data about weather and climate, cryptocurrency, healthcare and life sciences, and transportation.
- Google datasets: Unique, freely-available datasets from Google. One example of this is the COVID-19 community mobility dataset. Another example is the forthcoming Google Trends dataset, which will provide the top 25 search terms and top 25 rising search terms over a 5 year window in 210 distinct locations in the US. Trends data can be used by everyone in the organization to gain insights into what customers care about.
- Commercial (paid for) datasets: We are working with leading commercial data providers to bring their data products to Analytics Hub. If you are interested in delivering your data via Analytics Hub, we’re also introducing Data Gravity, an initiative that provides storage benefits and new distribution paths for data published through Analytics Hub.
- Internal datasets: We know that data sharing can be challenging in larger organizations. Analytics Hub can be used for internal data, for example, to share standardized customer demographics with your sales engineering and data science teams.
Customers and partners using Analytics Hub

“Google Search Trends data has always been an important tool for our WPP agency data teams. At WPP we believe that data variety is a superpower which is why we are excited to use the new Trends dataset availability within BigQuery, plus the launch of Analytics Hub. The best creativity in the world is informed by data insights, and influenced by what people search for, so the operational efficiencies we’ll gain via the Analytics Hub and the insights we can drive with Trends data are just phenomenal.”
—Di Mayze Global Head of Data and AI, WPP

“Equifax Ignite is our shared data analytics environment within our Equifax data fabric. We are excited to partner with Google to leverage Analytics Hub and BigQuery to deliver data to over 400 statisticians and data modelers as well as securely sharing data with our partner financial institutions.”
—Kumar Menon, SVP Data Fabric and Decision Science, Equifax

“The flow of data and insights between our teams at Deloitte and our clients is paramount for building truly transformational data cultures. With its purpose-built architecture for secure data exchanges and sharing analytics resources, Google Cloud’s Analytics Hub can help provide significant operational efficiencies for how Deloitte teams support our clients’ data-driven initiatives within their industry ecosystems. It will also help minimize the worries about scale, privacy and security, or the administrative burden associated with each.”
—Navin Warerkar, Managing Director, Deloitte Consulting LLP, and US Google Cloud Data & Analytics GTM Lead

“Crux Informatics is proud to partner with Google to support the launch of Analytics Hub, removing friction for those who need access to analytics-ready data. With thousands of datasets from over 140 sources, Crux Informatics will accelerate access to data on Analytics Hub and together provide a more efficient and cost effective solution to deliver datasets in Google Cloud’s ecosystem.”
—Will Freiberg, CEO, Crux Informatics
Next steps for Analytics Hub
This is just the beginning for Analytics Hub. As we get to preview and general availability, we will be adding additional capabilities, including workflows for publishing and subscribing, publishing analytics assets (Looker Blocks, Data Studio reports, Connected Google Sheets) along with the shared data, the ability for data publishers to specify query restrictions on the usage of their data, and making it easy for data publishers to create sandbox environments for subscribers to work with their data, even if they are not yet on Google Cloud. We will provide features in Analytics Hub for monetization of data, including managing subscriptions, data entitlements, and billing.
Please sign up for the preview, which is scheduled to be available in the third quarter of 2021. In the meantime, you can learn more about BigQuery and how to leverage its built-in data sharing capabilities. Please go to g.co/cloud/analytics-hub to register your interest in Analytics Hub.
Wunderkind Leverages Google Cloud to Address the Growing Needs of its Customer Base

5335
Of your peers have already read this article.
1:30 Minutes
The most insightful time you'll spend today!
Editor’s note: We’re hearing here how martech provider Wunderkind easily met the scaling demands of their growing customer base on multiple use cases with Cloud Bigtable and other Google Cloud data solutions.
Wunderkind is a performance marketing channel and we mostly have two kinds of customers: online retailers, and publishers like Gizmodo Media Group, Reader’s Digest, The New York Post and more. We help retailers boost their e-commerce revenue through real-time messaging solutions designed for email, SMS, onsite, and advertising. Brands want to provide a one-to-one experience to more of their customers, and we use our extensive history with best practices in email marketing and technology to help brands reach more customers through targeted messaging and personalized shopping experiences. With publishers, it’s a different value proposition, we use the same platform to provide a non disruptive and personalized ad experience for their website. For example, if you are on their site and then you left, we might show an ad tailored to you when you come back later – depending on the campaign.
After running into limitations with our legacy database system, we turned to Cloud Bigtable and Google Cloud, which helped us be more flexible and easily scale for high traffic demand – which can be a stable 40,000 requests per second, and meet the needs of our growing number of data use cases.
Three different databases power our core product
In our core offering, companies send us user events from their websites. We store these events and later decide (using our secret sauce) if and how to reach out to those users on behalf of our customers. Because many of our customers are retailers, Black Friday and Cyber Monday are big traffic days for us as. On such days, we can get 31 billion events, sometimes as many as 200K events per second. We show 1.6 billion impressions that have seen close to 1 billion pageviews. And at the end of all this, we securely send about 100 million emails. We noticed the same thing for election time; traffic reached the same high volume. We need scalable solutions to support this level of traffic as well as the elasticity to let us pay only for what we use, and that’s where Google Cloud comes in.
So how does this work? Our externally facing APIs, which are running on Google Kubernetes Engine, receive those user events—up to hundreds of thousand per second. All the components in our architecture need to be able to handle this demand. So from our APIs, those events go to Pub/Sub, Dataflow and from there they are written to Bigtable and BigQuery, Google Cloud’s serverless, and highly scalable data warehouse. This business user activity data underpins almost all our products. Events can be things like product views or additions to shopping carts. When we store this data in Bigtable, we use a combination of email address and the customer ID as the Bigtable key and we record the event details in that record.
What do we do with this information next? It’s important to mention that we also mark the last time we received an event about a user in Memorystore for Redis, Google Cloud’s fully managed Redis service. This is important because we have another service that is periodically checking Memorystore for users that have not been active for a campaign-specific period of time (it can be 30 minutes, for example), then deciding whether to reach out to them.
How we decide when we reach out is an intelligent part of our product offering, based on the channel, message, product, etc. When we do reach out, we use Memorystore for Redis as a rate limiter or token bucket. In order not to overwhelm the email or texting providers we send API requests to, we throttle those requests using Memorystore. (We prefer to preemptively throttle the outgoing API requests as opposed to handling errors later.)
When we do reach out, often we will need details for a specific product—let’s say if the website belongs to a retailer. We usually get that information from the retailer through various channels and we store product information in Cloud SQL for MySQL. We pull that information when we need to send an email with product information, and we use Memorystore for Redis to cache that information, since many of the products are repeatedly called. Our Cloud SQL instance has 16 vCPUs, 60GBs of memory and 0.5TB of disk space and when we perform those product information updates, we have about a thousand write transactions per second. We are also in the process of migrating some tables from a self managed MySQL instance, and we keep those tables synchronized with Cloud SQL using Datastream.
Our user history database was originally stored in AWS DynamoDB, but we were running into problems with how they structured the data, and we’d often get hot shards but with no way to determine how or why. That led to our decision to migrate to Bigtable. We set up the migration first by writing the data to two locations from Pub/Sub, performed some backfill of data until that was up and running, and then started working on the reading. We performed this over a few short months, then switched everything to Bigtable.
So, as mentioned, we are using Bigtable for multiple databases. The instance that stores our user events has about 30 TB with about 50 nodes.
Profile management
A second use case for Bigtable is for user profile management, where we track, for example, user attributes based on subscription activity, whether they’ve opted in or out of various lists, and where we apply list-specific rules that determine which targeted emails we send out to users.
Our very own URL shortener
Our third use case for Bigtable is our URL shortener. When our customers build out campaigns and choose a URL, we append tracking information to the query string of the URLs and they become long. Many times, we are sending them via SMS texts, so the URLs need to be short. We originally used an external solution, but made the determination that they couldn’t support our future demands. Our calls tend to be very bursty in nature, and we needed to plan for a future state of supporting higher throughput. We use a separate table in Bigtable for this shortened URL. We generate the short slug that is 62 bit-encoded and use it as the rowkey. We use the long slug as a Protobuf-encoded data structure in one of the row cells and we also have a cell for counting how many times it was used. We use Bigtable’s atomic increment to increase that counter to track how many times the short slug was used.
When the user receives a text message on their phone, they click the short URL, which goes through to us, and we expand it to the long slug (from Bigtable) and redirect them to the appropriate site location. Obviously, for the URL shortener use case, we need to make the conversion very quickly. Bigtable’s low latency helps us meet that demand and we can scale it up to meet higher throughput demands.
Meeting the future with Google Cloud
Our business has grown considerably, and as we keep signing up new clients, we need to scale up accordingly, and Bigtable has met our scaling demands easily. With Bigtable and other Google Cloud products powering our data architecture, we’ve met the demand of incredibly high traffic days in the last year, including Black Friday and Cyber Monday. Traffic for these events went much higher than expected, and Bigtable was there, helping us easily scale on demand.
We are working on leveraging a more cloud native approach and using Google Cloud managed services like GKE, Dataflow, pub/sub, Cloud SQL , Memorystore, BigQuery and more. Google has those 1st party products and we don’t see the value in rolling out or self managing such solutions ourselves..
Thanks to Google Cloud, we now have reliable and flexible data solutions that will help us meet the needs of our growing customer base, and delight their users with fast, responsive, personalized shopping messaging and experiences.
Learn more about Wunderkind and Cloud Bigtable. Or check out our recent blog exploring the differences between Bigtable and BigQuery.
Qlik and Google Cloud Combo: Extending Integration of SAP Data on BigQuery

5466
Of your peers have already read this article.
2:00 Minutes
The most insightful time you'll spend today!
If your organization is one of the 52% of SAP customers whose top analytics pain point is data integration1, Google Cloud has got you covered. By working with partners like Qlik, we are expanding our integration options and bringing real-time replication capability for SAP to BigQuery.
Integrated data for accelerated insights
BigQuery—our fully managed, enterprise data warehouse that can scale up to petabytes on demand and execute queries in seconds—allows SAP customers to consolidate enterprise data silos and confidently derive more use and value from their data. Customers can accelerate and simplify the delivery of SAP data on BigQuery with the latest Qlik Data Integration platform offering for Google Cloud which allows data integration using an automated, near real-time data pipeline through Qlik Replicate, whether data originates from legacy SAP environments, SAP HANA, or SAP application servers. Additionally, Qlik Compose for Data Warehouses can be used to easily generate and automate logical data models from SAP directly in BigQuery freeing up more time for data analysts to leverage advanced built-in capabilities such as BigQuery ML to derive greater value and insights using standard SQL without the need for advanced programming expertise.
Delivering faster results with real-time
Traditional extract-transform-load (ETL) solutions operate on a batch basis, pulling data sets from SAP daily, hourly, or every minute. These tools often require manual mapping of multiple data fields so that data flows accurately. Given SAP’s highly complex table relationships, in which a single transaction can result in multiple changes, this can be a time consuming and tedious process. ETL can also increase the burden on your SAP systems.
Qlik Replicate simplifies this with its intuitive user interface where you can set up real-time data replication between SAP and BigQuery, eliminating the need for manual coding. And, to prevent system overhead, as soon as a new transaction is entered into SAP, the resulting data is replicated into BigQuery in a process known as change data capture (CDC) from SAP’s log layer. This means that data transfer can benefit from high performance with minimal impact on the source system’s resources. Read our latest white paper to learn how to extract SAP data into BigQuery leveraging Qlik Replicate.
Solution expertise for all core SAP workloads
It doesn’t matter what database your SAP system runs on, Qlik Replicate supports all core SAP systems. It automates real-time data replication and decodes SAP’s complex, application-specific data structures into formats that flow smoothly into BigQuery. This ensures that anyone who depends on data analytics has the most current and relevant SAP data they need. For its robust solution capabilities Qlik has received a new “SAP on Google Cloud Expertise” designation for supporting:
- Fast onboarding and accelerated replication of SAP data into Google Cloud
- Real-time and continuous data replication from SAP applications to BigQuery
- Support for all core SAP modules and a broad set of data sources
- Automated data integration, which cuts resource requirements for initial delivery and ongoing maintenance
Proven customer results
Many SAP customers have experienced the benefits of leveraging Qlik alongside BigQuery for data analytics and AI at scale, including German luxury department store chain Breuninger. In order to meet its customers’ growing and changing expectations,Breuninger needed to accelerate its time to insight from data sources across a highly dispersed landscape of on-premises databases and systems, including SAP. The company uses Qlik Replicate to feed corporate data from modules in its SAP system into BigQuery and integrate its varying on-premises databases with the Google Cloud environment. This has yielded game-changing, real-time customer insights for the retailer.
What could your business do with faster, more integrated insights? Learn more about BigQuery for SAP customers and also how Qlik and Google Cloud can help you modernize and automate data integration and analytics.
More Relevant Stories for Your Company

Lending DocAI Shortens Borrowers’ Journey on Roostify
The home lending journey entails processing an immense number of documents daily from hundreds of thousands of borrowers. Currently, home lending document processing relies on some outdated digital models and a high dependency on manual labor, resulting in slow processing times and higher origination costs. Scaling a business that sorts

Canadian Bank’s SAP Workload Moved to BigQuery Helps Unlock New Business Opportunities
When ATB Financial decided to migrate its vast SAP landscape to the cloud, the primary goal was to focus on things that matter to customers as opposed to IT infrastructure. Based in Alberta, Canada, ATB Financial serves over 800,000 customers through hundreds of branches as well as digital banking options. To

Four Key Takeaways from Google and Quantum Metric’s Back-to-School Retail Benchmark Study
Is it September yet? Hardly! School is barely out for the summer. But according to Google and Quantum Metric research, the back-to-school and off-to-college shopping season – which in the U.S. is second only to the holidays in terms of purchasing volume1 – has already begun. For retailers, that means


How to Migrate an Oracle Database to Google Cloud
As more enterprises migrate a growing number of workloads to the cloud, migrating databases, too, has become a key focus. But migrating databases is also really tough. This is due to a number of different reasons. The first one is that there's a lot of proprietary technology and functionality that's
