





Real-time analytics for on-time delivery: Mercado Libre

3053
Of your peers have already read this article.
1:30 Minutes
The most insightful time you'll spend today!
Iteration and innovation fuel the data-driven culture at Mercado Libre. In our first post, we presented our continuous intelligence approach, which leverages BigQuery and Looker to create a data ecosystem on which people can build their own models and processes.
Using this framework, the Shipping Operations team was able to build a new solution that provided near real-time data monitoring and analytics for our transportation network and enabled data analysts to create, embed, and deliver valuable insights.
The challenge
Shipping operations are critical to success in e-commerce, and Mercado Libre’s process is very complex since our organization spans multiple countries, time zones, and warehouses, and includes both internal and external carriers. In addition, the onset of the pandemic drove exponential order growth, which increased pressure on our shipping team to deliver more while still meeting the 48-hour delivery timelines that customers have come to expect.
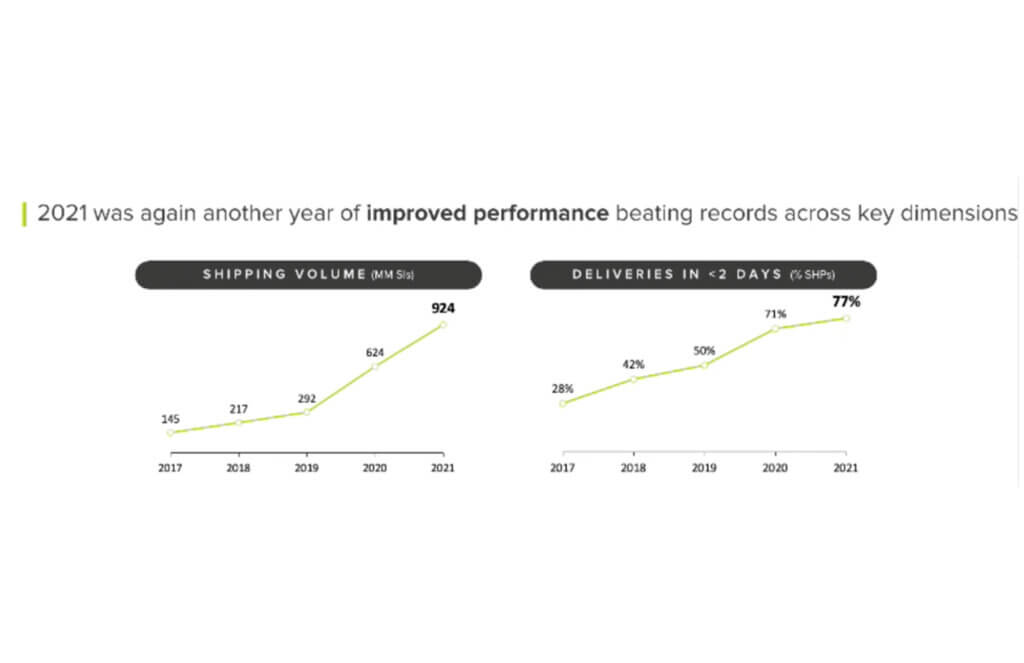
This increased demand led to the expansion of fulfillment centers and cross-docking centers, doubling and tripling the nodes of our network (a.k.a. meli-net) in the leading countries where we operate. We also now have the largest electric vehicle fleet in Latin America and operate domestic flights in Brazil and Mexico.
We previously worked with data coming in from multiple sources, and we used APIs to bring it into different platforms based on the use case. For real-time data consumption and monitoring, we had Kibana, while historical data for business analysis was piped into Teradata. Consequently, the real-time Kibana data and the historical data in Teradata were growing in parallel, without working together. On one hand, we had the operations team using real-time streams of data for monitoring, while on the other, business analysts were building visualizations based on the historical data in our data warehouse.
This approach resulted in a number of problems:
- The operations team lacked visibility and required support to build their visualizations. Specialized BI teams became bottlenecks.
- Maintenance was needed, which led to system downtime.
- Parallel solutions were ungoverned (the ops team used an Elastic database to store and work with attributes and metrics) with unfriendly backups and data bounded for a period of time.
- We couldn’t relate data entities as we do with SQL.
Striking a balance: real-time vs. historical data
We needed to be able to seamlessly navigate between real-time and historical data. To address this need, we decided to migrate the data to BigQuery, knowing we would leverage many use cases at once with Google Cloud.
Once we had our real-time and historical data consolidated within BigQuery, we had the power to make choices about which datasets needed to be made available in near real-time and which didn’t. We evaluated the use of analytics with different time windows tables from the data streams instead of the real-time logs visualization approach. This enabled us to serve near real-time and historical data utilizing the same origin.
We then modeled the data using LookML, Looker’s reusable modeling language based on SQL, and consumed the data through Looker dashboards and Explores. Because Looker queries the database directly, our reporting mirrored the near real-time data stored in BigQuery. Finally, in order to balance near real-time availability with overall consumption costs, we analyzed key use cases on a case-by-case basis to optimize our resource usage.
This solution prevented us from having to maintain two different tools and featured a more scalable architecture. Thanks to the services of GCP and the use of BigQuery, we were able to design a robust data architecture that ensures the availability of data in near real-time.
Streaming data with our own Data Producer Model: from APIs to BigQuery
To make new data streams available, we designed a process which we call the “Data Producer Model” (“Modelo Productor de Datos” or MPD) where functional business teams can serve as data creators in charge of generating data streams and publishing them as related information assets we call “data domains”. Using this process, the new data comes in via JSON format, which is streamed into BigQuery. We then use a 3-tiered transformation process to convert that JSON into a partitioned, columnar structure.
To make these new data sets available in Looker for exploration, we developed a Java utility app to accelerate the development of LookML and make it even more fun for developers to create pipelines.
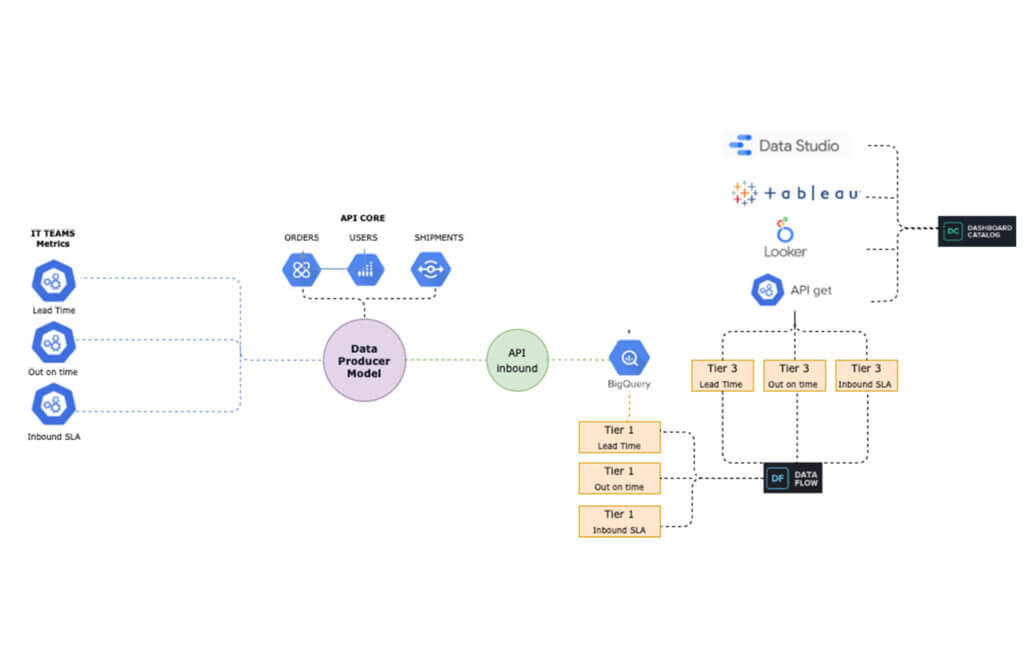
The complete “MPD” solution results in different entities being created in BigQuery with minimal manual intervention. Using this process, we have been able to automate the following:
- The creation of partitioned, columnar tables in BigQuery from JSON samples
- The creation of authorized views in a different GCP BigQuery project (for governance purposes)
- LookML code generation for Looker views
- Job orchestration in a chosen time window
By using this code-based incremental approach with LookML, we were able to incorporate techniques that are traditionally used in DevOps for software development, such as using Lams to validate LookML syntax as a part of the CI process and testing all our definitions and data with Spectacles before they hit production. Applying these principles to our data and business intelligence pipelines has strengthened our continuous intelligence ecosystem. Enabling exploration of that data through Looker and empowering users to easily build their own visualizations has helped us to better engage with stakeholders across the business.
The new data architecture and processes that we have implemented have enabled us to keep up with the growing and ever-changing data from our continuously expanding shipping operations. We have been able to empower a variety of teams to seamlessly develop solutions and manage third party technologies, ensuring that we always know what’s happening – and more critically – enabling us to react in a timely manner when needed.
Outcomes from improving shipping operations:
Today, data is being used to support decision-making in key processes, including:
- Carrier Capacity Optimization
- Outbound Monitoring
- Air Capacity Monitoring
This data-driven approach helps us to better serve you -and everyone- who expects to receive their packages on-time according to our delivery promise. We can proudly say that we have improved both our coverage and speed, delivering 79% of our shipments in less than 48 hours in the first quarter of 2022.
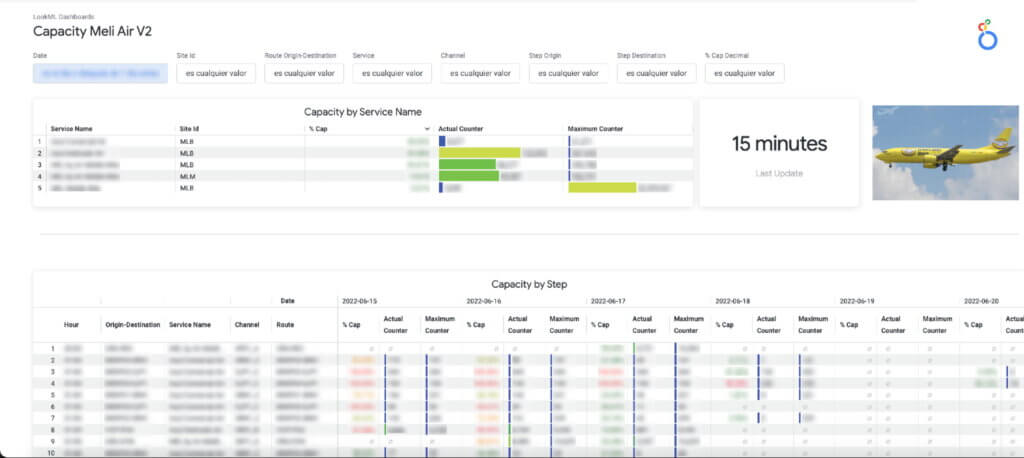
Here is a sneak peek into the data assets that we use to support our day-to-day decision making:
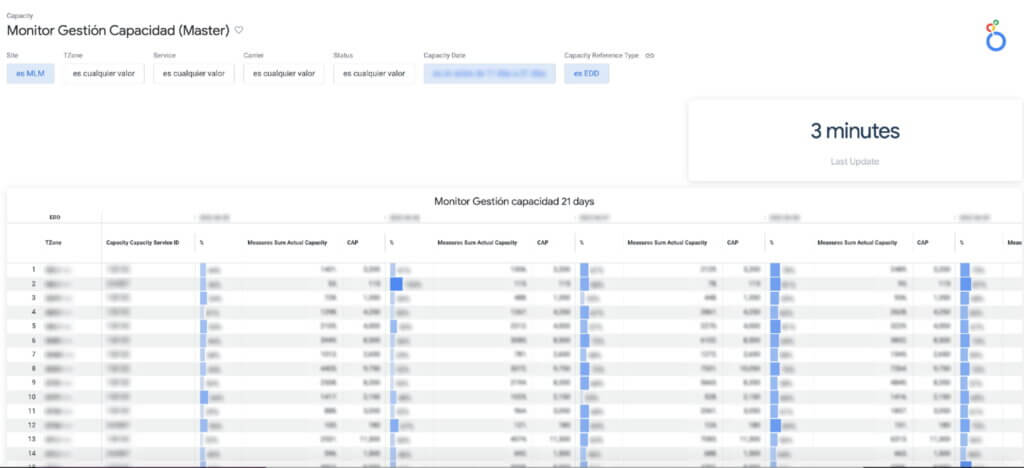
a. Carrier Capacity: Allows us to monitor the percentage of network capacity utilized across every delivery zone and identify where delivery targets are at risk in almost real time.
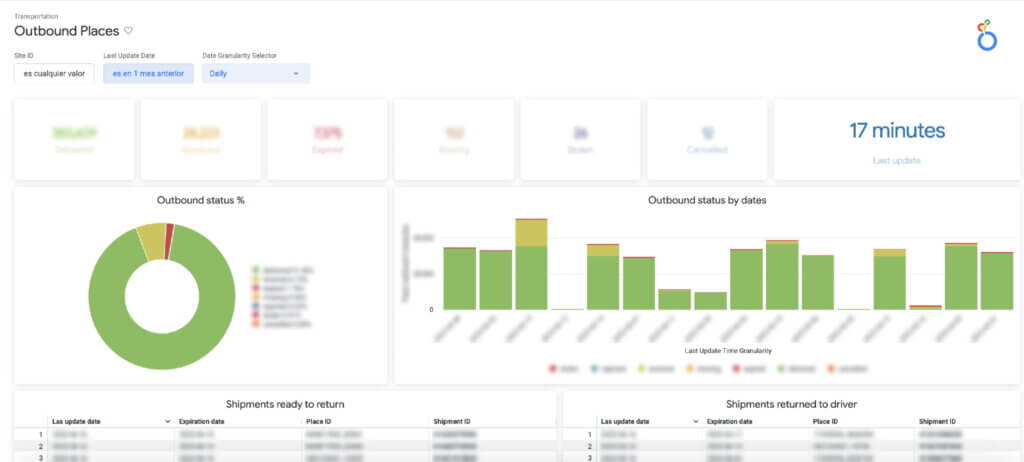
b. Outbound Places Monitoring: Consolidates the number of shipments that are destined for a place (the physical points where a seller picks up a package), enabling us to both identify places with lower delivery efficiency and drill into the status of individual shipments.
c. The Air Capacity Monitoring: Provides capacity usage monitoring for our aircrafts running each of our shipping routes.
Costs into the equation
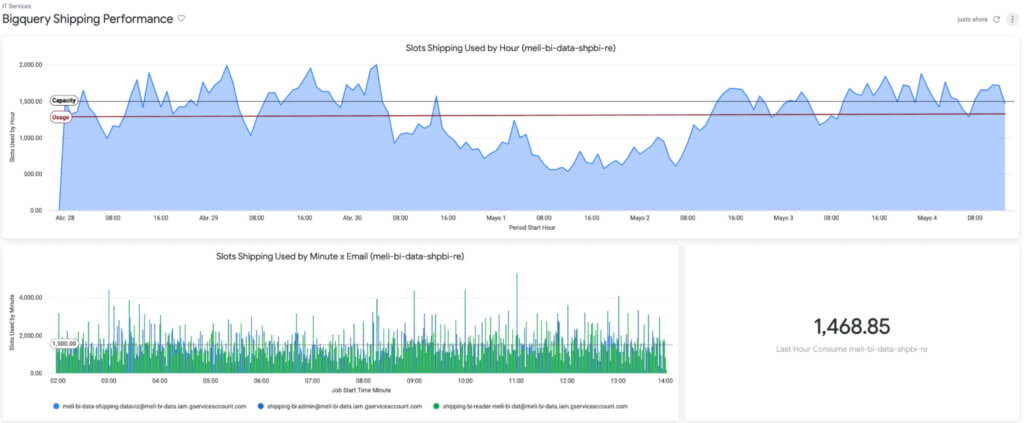
The combination of BigQuery and Looker also showed us something we hadn’t seen before: overall cost and performance of the system. Traditionally, developers maintained focus on metrics like reliability and uptime without factoring in associated costs.
By using BigQuery’s information schema, Looker Blocks, and the export of BigQuery logs, we have been able to closely track data consumption, quickly detect underperforming SQL and errors, and make adjustments to optimize our usage and spend.
Based on that, we know the Looker Shipping Ops dashboards generate a concurrency of more than 150 queries, which we have been able to optimize by taking advantage of BigQuery and Looker caching policies.
The challenges ahead
Using BigQuery and Looker has enabled us to solve numerous data availability and data governance challenges: single point access to near real-time data and to historical information, self-service analytics & exploration for operations and stakeholders across different countries & time zones, horizontal scalability (with no maintenance), and guaranteed reliability and uptime (while accounting for costs), among other benefits.
However, in addition to having the right technology stack and processes in place, we also need to enable every user to make decisions using this governed, trusted data. To continue achieving our business goals, we need to democratize access not just to the data but also to the definitions that give the data meaning. This means incorporating our data definitions with our internal data catalog and serving our LookML definitions to other data visualizations tools like Data Studio, Tableau or even Google Sheets and Slides so that users can work with this data through whatever tools they feel most comfortable using.
If you would like a more indepth look at how we made new data streams available from a process we designed called the “Data Producer Model” (“Modelo Productor de Datos” or MPD) register to attend our webcast on August 31.
While learning and adopting new technologies can be a challenge, we are excited to tackle this next phase, and we expect our users will be too, thanks to a curious and entrepreneurial culture. Are our teams ready to face new changes? Are they able to roll out new processes and designs? We’ll go deep on this in our next post.
5928
Of your peers have already watched this video.
33:30 Minutes
The most insightful time you'll spend today!
How Spotify Serves Personalized Music Recommendations
Music for everyone. That’s Spotify’s promise. And it lives up to it by serving over 140 million music lovers across the world. Every day it renders personalized music recommendations to hundreds of millions of happy customers.
“Spotify is a global business with a global user base. Being able to provide a great audio experience to our users is a key priority for us,” said Niklas Gustavsson, chief architect at Spotify.
To be able to do that, Spotify needed a system that would scale and enable personalization and provide a seamless customer experience. That’s why it moved its infrastructure to Google Cloud and Cloud Bigtable. This allows Spotify to deliver recommendations at scale, roll out experiments quickly, and ingest terabytes every day via Cloud Dataflow.
“With Cloud Bigtable clusters in Asia, Europe, and the United States, we’re able to get low-latency data access all over the world, enabling Spotify to provide a seamless experience for our users. We’re also pleased with the continuous collaboration and deep engagement with Google’s product teams to accelerate both our businesses, ” says Gustavsson.
In this video, Peter Sobot, Senior Engineer, Personalization, Spotify talks about how Cloud Bigtable is helping Cloud Bigtable personalize recommendations, including tips about how to design a good schema, how to avoid latency when ingesting new data, and effective caching strategies to scale to tens of millions of data points per second.
Google Cloud Helps Northwell Health to Boost Caregiver Productivity and Access to Right Care Using AI

7989
Of your peers have already read this article.
2:00 Minutes
The most insightful time you'll spend today!
Lung cancer is the leading cause of cancer death in the United States and like any cancer, early detection is crucial to survival. Screening at-risk populations is an important part of reducing mortality, and if concerning nodules are found on imaging, further testing may be required. Today, we’ll share how Northwell Health uses Google Cloud products such as Cloud Healthcare APIs and BigQuery to increase caregiver productivity and deliver better care for patients with findings that indicate potential development of lung cancer.
Northwell is New York’s largest healthcare provider
Northwell Health is New York’s largest healthcare provider with 23 hospitals and nearly 800 outpatient facilities. Northwell’s nearly 4,000 doctors care for millions of patients each year, and at this scale, there is an immense amount of healthcare data to manage. To better manage and leverage this data, Northwell Health partnered with Google Cloud starting in 2018.
Enabling caregivers to spend more time with patients
Nic Lorenzen, the lead developer of Northwell Emerging Technology and Innovation team, has a mission to put together data for caregivers in a way that makes sense. It is no secret that inefficient electronic health records systems have a negative impact on a physician’s ability to deliver quality care. Traditional EHRs have information distributed across many tabs, which forces caregivers to spend considerable time at the computer trying to find information. Moreover, speed of care matters. If care is delayed, patients may have to spend more time in the hospital and may suffer worse health outcomes.
To solve this problem, Nic’s team focused on giving caregivers the most relevant pieces of data at the right time by developing an intelligent clinician rounding app. The data needed to derive these insights can depend on the caregiver’s role–a nurse cares about different things than a cardiologist. This system aggregates multiple data sources, and provides patient-specific insights to caregivers.
This system would not have been possible before with traditional EHRs and data warehouses that have proprietary data models and rarely sync data in real time. Now with data easily accessible through Google Cloud’s Healthcare solutions, Nic’s team can deliver the right clinical information to the right people instantly. These days, Nic says, “instead of spending 75% of our time dealing with architecting the underlying platforms, we spend 75% of our time focused on higher value use cases for clinicians and patients. Google Cloud’s Healthcare solutions have greatly improved our developer productivity and time to value.”
Caregivers have found this new system to be a game changer.Before the implementation of this system, caregivers would spend, on average, seven to nine minutes finding the data needed to make medical decisions for one patient. Now, that aggregated information is delivered to a caregiver’s mobile device in less than a second.
Ensuring patients get the right care with the power of AI
There are a number of reasons why patients might not get the care that they need. For example, patients today can go to multiple hospitals and clinics settings, and coordinating care across multiple facilities is complex. Regional hospitals and clinics have their own siloed view of their data, so pertinent information gathered by one clinic might not be seen by another. These gaps in clinical data lead to gaps in patient care.
When a patient gets radiologic imaging, they may have findings unrelated to the reason they initially got the imaging. For example, a chest CT for a car accident might reveal an incidental lung nodule that could be cancerous. Unfortunately, research shows that a large portion of patients do not get follow up for these incidental findings because it isn’t the primary reason why the patient is seeing a doctor. Moreover, social determinants of health are a factor that affects which patients receive follow-up care. Identifying these patients and providing the necessary follow up care prevents adverse events related to delayed detection of cancer.

With Cloud Healthcare solutions, Northwell built an AI model to identify these patients so that oncologists can appropriately follow up with patients who have findings suspicious for lung cancer. The AI model detects incidental pulmonary nodules in radiology reports so that doctors can then contact the patients that need follow-up care. Nic says his team was able to build this system in a week: “Google Cloud did a lot of heavy-lifting for us and allowed us to get to the AI applications much faster. It allowed us to build a platform that just works.”
Healthcare systems can now rapidly generate healthcare insights with one end-to-end solution, Google Cloud Healthcare Data Engine. It builds on and extends the core capabilities of the Google Cloud Healthcare API to make healthcare data more immediately useful by enabling an interoperable, longitudinal record of patient data. Northwell Health uses Google Cloud as the core of their platform, enabling their developers to create solutions to the most pressing healthcare problems.
Special thanks to Kalyan Pamarthy, Product Management Lead on Cloud Healthcare and Natural Language APIs for contributing to this blog post.
Google Cloud Migration Speeds Up The New York Times’ Journey to New Normal
5805
Of your peers have already read this article.
2:30 Minutes
The most insightful time you'll spend today!
Like virtually every business across the globe, The New York Times had to quickly adapt to the challenges of the coronavirus pandemic last year. Fortunately, our data system with Google Cloud positioned us to perform quickly and efficiently in the new normal.
How we use data
We have an end-to-end type of data platform; on one side we work very closely with our product teams to collect the right level of data that they’re interested in, such as which articles people are reading, and how long they’re staying onsite. We frequently measure our audience to understand our user segments, and how they come onsite or use our apps. We then provide that data to analysts for end-to-end analytics.
On the other side, the newsroom is also focused on audience, and we build tools to help them understand how Google Search or different social promotions play a role in a person’s decision to read The New York Times, and also to get a better sense of their behavior on our pages. With this data, the newsroom can make decisions about information that should be displayed on our homepage or in push notifications.
Ultimately, we’re interested in behavioral analytics—how people engage with our site and our apps. We want to understand different behavioral patterns, and which factors or features will encourage users to register and subscribe with us.
We also use data to create or curate preferences around personalization, to ensure we’re delivering to our users fresh content, or content that they may not have normally read. Likewise, our data also gets used in our targeting system, so that we can send out the right messaging about our various subscription packages to the right users.
Choosing to migrate to Google Cloud
When I came to The New York Times over five years ago, our data architecture was not working for us. Our infrastructure was gathering data that proved harder for analysts to crunch on a daily basis. We were also hitting hang ups with how that data was streaming into our system and environment. Back then we’d run a query and then go grab some coffee, hoping that the query would finish or give us the right data by the time we came back to our desks. Sometimes it would, sometimes it wouldn’t.
We realized that Hadoop was definitely not going to be the on-premises solution for us, and that’s when we started talking with the Google Cloud team. We began our digital transformation with a migration to BigQuery, their fully managed, serverless database warehouse. We were under a pretty aggressive migration timeline, focusing first on moving over analytics. We made sure our analysts got a top-of-the-line system that treated them the way that they themselves would want to treat the data.
One significant prominent requirement in our data architecture choice was to enable analysts to be able to work as quickly as they needed to provide high-quality deliverables for their business partners. For our analysts, the transition to BigQuery was night and day. I still remember when my manager ran his very first query on BigQuery and was ready to go grab his coffee, but the query finished by the time he got up from his chair. Our analysts talk about that to this day.
While we were doing the BigQuery transition, we did have concerns about our other systems not scaling correctly. Two years ago, we weren’t sure we’d be able to scale up to the audience we expected on that election day. We were able to band-aid a solution back then, but we knew we only had two more years to figure out a real, dependable solution.
During that time, we moved our streaming pipeline over to Google Cloud, primarily using App Engine, which has been a flexible environment that enabled quick scaling changes and requirements as needed. Dataflow and Pub/Sub also played significant roles in managing the data. In Q4 of 2020 we had our most significant traffic ever recorded, at 273 million global readers, and four straight days of the highest traffic we’ve had compared to other election weeks. We were proud to see that there was no data loss.
A couple of years ago, on our legacy system, I was up until three in the morning one night trying to keep data running for their needs. This year, for election night, I relaxed and ate a pint of ice cream because I was able to more easily manage our data environment, allowing us to set and meet higher expectations for data ingestion, analysis and insight among our partners in the newsroom.
How COVID-19 changed our 2020 roadmap
The coronavirus pandemic definitely wasn’t on my team’s roadmap for 2020, and it’s important to mention here that The New York Times is not fundamentally a data company. Our job is to get the news out to our users every single day in paper, on apps, and onsite. Our newsroom didn’t expect the need to build out a giant coronavirus database that would enrich the news they share every day.
Our newsroom moves quickly, and our engineers have built one of the most comprehensive datasets on COVID-19 in the U.S. With Google, The New York Times decided to make our data publicly available on BigQuery Google’s COVID-19 public dataset. Check out this webinar for more details on our evolution architecture:https://www.youtube.com/embed/mtNlrFpschU?enablejsapi=1&
Flexible approach
We have many different teams that work within Google Cloud, and they’ve been able to pick from the range of available services and tailor project requirements keeping those tools available in mind.
One challenge we think about with the data platform at The New York Times is determining the priorities of what we build. Our ability to engage with product teams at Google though the Data Analytics Customer Council allows us to see into the BigQuery roadmap, or the data analytics roadmap, and plays a significant role in determining where we focus our own development. For example, we’ve built tools like our Data Reporting API, which reads data directly from BigQuery, in order to take advantage of tools like BigQuery BI Engine. This approach encourages our analysts to be better managers of their domains around dimensions and metrics, but not have to focus on building caching mechanisms of their data. Getting that kind of clarity helps us plan how to build The New York Times in the new normal and beyond.
If you are interested to learn more about the data teams at the New York Times, take a look at our open tech roles here and you’ll find many interesting articles at NYT data blog.
5052
Of your peers have already watched this video.
21:00 Minutes
The most insightful time you'll spend today!
Uber’s Story of Scaling Their App with Millions of Concurrent Requests
Uber has millions of concurrent customers who use the platform to book rides and place food delivery orders, generating billions of database transactions per day. In just a click of a button, Uber captures users’ intent which bases their fulfillment model to meet the customers’ demand, and match it to active providers that address their demand with supply.
Uber’s fulfillment platform capability is the lifeline powering every line of business and also allows rapid scaling of new verticals. Hundreds of microservices at Uber depend on this fulfillment platform as a source of truth for all their active booking, delivery or order session. The events generated by this platform are used by hundreds of offline data sets to power business decisions. Additionally over hundreds of developers at Uber extend the platform with APIs, events and codes to build 120+ unique fulfillment flows!
Watch the video to learn about Uber’s decision to move from on-prem to Google Cloud’s Cloud Spanner while still taking live orders at scale and meeting customers’ expectations.
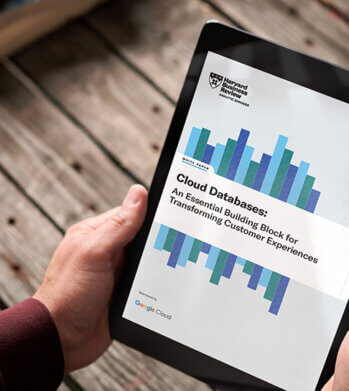
Cloud Databases: An Essential Building Block for Transforming Customer Experiences
DOWNLOAD RESEARCH REPORTS2770
Of your peers have already downloaded this article
11:30 Minutes
The most insightful time you'll spend today!
Around the globe, companies realize that iterating and innovating the customer experience (CX) is the key to their business transformation and success goals. Customers expect exceptional and speedy service from organizations through personalized experiences and easy-to-use apps.
However, while most companies want data-driven innovation, many of them overlook a key mechanism to do so: operational databases. These databases run a company’s day-to-day operations and power applications around the globe.
“Operational databases are often overlooked because they are behind the scenes,” says Kumar Menon, senior vice president of data fabric and decision science technology at Atlanta-based Equifax, the multinational consumer credit reporting agency. “Companies often focus on providing strong customer-facing applications, but the application will only achieve the desired results with a well-architected operational data capability that helps drive the real-time analytics needed to make the customer experience effective and memorable. It is the backbone of anything that you will build on top of it.”
Better customer experience is a business outcome of using cloud databases to build applications. This dictum stands to reason because moving from a traditional on-premises database to a modern database in the cloud, or simply building new applications in the cloud, allows companies to address operational overhead, unlock new possibilities, implement new features quickly, increase application reliability, and serve users across more regions—all the things that enhance CX and make it possible. Google Cloud sponsored this research by Harvard Business Review Analytic Services to understand how digital innovators are delighting their customers by using modern cloud databases. The report analyzes why operational databases are an essential building block for transformative experiences and highlights some of the critical capabilities leaders should prioritize. Through interviews with technology executives, data leaders, and industry experts, it provides real-world examples of benefits companies are realizing with cloud databases. We hope you find the findings and real-world examples in this report insightful and inspiring.
More Relevant Stories for Your Company




Indian Retailer Figures Optimizes Hyperlocal Delivery to Increase Customer Experience
Anyone who follows the Indian e-commerce scene knows that one of the largest challenges these companies face is hyperlocal delivery. That was a problem facing Wellness Forever, a retail chain of pharmacies with 150-plus stores across India. “Exactly a year ago, we started our journey of hyperlocal deliveries. This optimization

Google’s Diversity Annual Report public dataset & BigQuery
Since 2014, tech companies have relied on metrics to identify trouble spots, establish baselines, and measure meaningful progress in diversity, including publishing DEI data directly through diversity annual reports. However, as our understanding of DEI has evolved over time each company’s report has diverged, creating a fragmented landscape of industry-wide

Serverless and BigQuery Together on Google Cloud: Behind the L’Oreal Beauty Tech Data Platform
Editor's note: In Today's guest post we hear from beauty leader L'Oréal about their approach to building a modern data platform on fully managed services: managing the ingest of diverse datasets into BigQuery with Cloud Run, and orchestrating transformations into relevant business domain representations for stakeholders across the organization. Learn

Unification of Dataplex and Data Catalog: A Full Spectrum of Data Governance and Data Management at Scale
Today, we are excited to announce that Google Cloud Data Catalog will be unified with Dataplex into a single user interface. With this unification, customers have a unified experience to search and discover their data, enrich it with relevant business information, organize it by logical data domains, and centrally govern
