





Reactive Programming on Google Maps Platform: Watch Video to Learn

5299
Of your peers have already read this article.
1:30 Minutes
The most insightful time you'll spend today!
The Google Maps Platform Android SDK supports extensions for reactive programming, which helps you write code to handle asynchronous operations.
Write reactive and responsive mapping applications with Google Maps Platform
In mobile apps, asynchronous events can happen at any point in time: user touch events, waiting for network calls to complete, or receiving push notifications, to name a few. As an app developer, accounting for these events and composing them with other asynchronous events can be challenging. Reactive programming is an alternative to passing callbacks for different events and helps simplify the process of working with asynchronous events. In reactive programming, events are modeled as a stream, emitting items over time.
https://youtube.com/watch?v=1TmJvOZfBVQ%3Fenablejsapi%3D1%26
There are two libraries you can use to write reactive code: Kotlin Flows and RxJava. The next two videos show you how to use each one.
Writing reactive and responsive mapping applications using Kotlin
If you’re a Kotlin developer looking to use Coroutines and Flows, the KTX library allows you to use Kotlin Flows to receive events. The Maps KTX library includes extension functions that return Kotlin Flow objects, so you can listen to events in a reactive manner. Unlike suspending functions, which return a single value, Kotlin Flows can return several values over time. For example, you can use a Flow to receive camera event changes over time. To get started using Kotlin Flows in your app, include the Maps KTX library in the dependencies section in your build.gradle file.
https://youtube.com/watch?v=Cotx1ZmEYg8%3Fenablejsapi%3D1%26
Creating reactive maps on Android with RxJava
Integrate Google Maps Platform SDKs with popular Android library RxJava. RxJava is the Java implementation of Reactive Extensions, which is a library for composing asynchronous and event-based programs using observable sequences. One thing RxJava does is allows you to convert callback-based asynchronous code into a chain of transformations. Learn how this works and the other ways you can use RxJava in the third video in this series.
https://youtube.com/watch?v=AgGE7fAMrdA%3Fenablejsapi%3D1%26
We hope you learn more about reactive programming concepts to help you build responsive and reactive mobile apps in this three-part YouTube series. Have ideas for helpful videos you’d like to see on our channel? Leave a comment on any of our videos. And don’t forget to subscribe to our YouTube channel for the latest updates, tutorials, customer stories, and more.
For more information on Google Maps Platform, visit our website.
Transforming Businesses with Google Distributed Cloud Edge Appliance: A Look at Real-World Use Cases

2531
Of your peers have already read this article.
4:30 Minutes
The most insightful time you'll spend today!
While many organizations are driving digital transformation by migrating to the cloud, there are some industries, geographies, and use cases that require a different approach to cloud modernization. Regulated industries such as healthcare, insurance, pharmaceutical, energy, telecommunication, and banking have stringent data residency and sovereignty requirements. Other industries need to meet local data processing requirements, while others require real-time data processing with sub-millisecond latencies, for example to detect defects on manufacturing lines. These use cases demand a combination of edge, on-premises and cloud services for their infrastructure.
With these requirements in mind, Google Cloud launched Google Distributed Cloud powered by Anthos to extend the power of Google Cloud infrastructure and services to the edge (or closer). The underlying infrastructure for this service comes in two variants: a 42U rack filled with compute, storage, and networking devices called Google Distributed Cloud Edge Rack and a 1U appliance called Google Distributed Cloud Edge Appliance.
In this blog post, we discuss the Google Distributed Cloud Edge Appliance and how manufacturing, retail, and automotive industry verticals can use it to address common use cases.
How the appliance works
But first, let’s talk about the Google Distributed Cloud Edge Appliance itself.
Google Distributed Cloud Edge Appliances comprises two components: (1) Distributed Cloud Edge infrastructure and (2) the Distributed Cloud Edge service.
The Google Distributed Cloud Edge service runs on Google Cloud and serves as a control plane for the nodes and clusters running on your appliance. In order to perform remote management of the appliance and to collect metrics, the Distributed Cloud Edge service must be connected to Google Cloud at all times, allowing you to manage your workloads on the edge hardware through the Google Cloud Console. For customers who can’t be connected at all times for data residency or sovereignty reasons, we highly recommend that the appliance be connected to the cloud at least once a month to allow for needed security patches and updates.
Google Distributed Cloud Edge Appliances come with built-in network ports that provide connectivity to the control plane via the internet, Cloud VPN, or Dedicated Interconnect, and to your on-prem network. Each Google Distributed Cloud Edge Appliance is homed to a specific Google Cloud region but it is designed to also use any public Google Cloud endpoint to communicate with the control plane in Google Cloud, allowing you to move these appliances between different geographic locations.
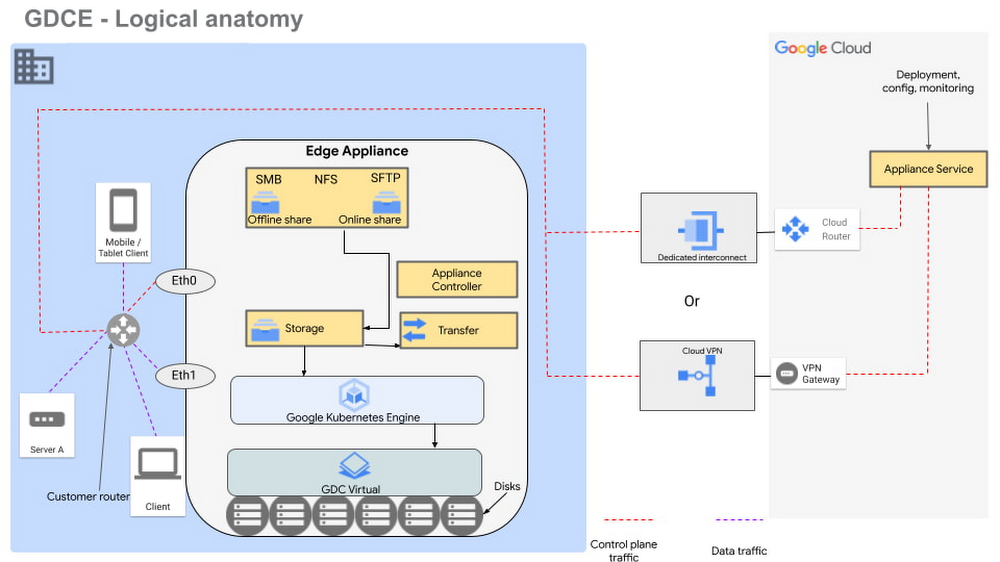
Figure 1 – Logical design of Google Distributed Cloud Edge Appliance
There are two NFS shares on each appliance; one is offline, meaning it does not transfer data to Google Cloud, and the other is online, meaning data saved to that share is synced to Cloud Storage on Google Cloud for further processing. The appliance supports Server Message Block (SMB) and Secure File Transfer Protocols (SFTP) for communication.
Each Google Distributed Cloud Edge Appliance runs Google Distributed Cloud Virtual, enabling you to build a single-node Kubernetes cluster with access to the underlying file system of the appliance. This allows you to build containerized applications on the underlying appliance hardware to address use cases in the following verticals.
Vertical use cases
Now that you understand how Google Cloud Edge Appliance is configured, let’s consider some of the industry use cases where it can provide unique value.
Manufacturing
In the manufacturing industry, quality control and safety is a crucial factor. Businesses need to ensure products are manufactured to the highest standards to remain competitive in their markets, to retain customers, and to keep factory workers safe. To do this, manufacturers need real-time data about the products being manufactured on the production lines, ensuring quality control and gaining a real-time view of where people are on the factory floor.
In manufacturing environments, Google Distributed Cloud Edge Appliance can be used to detect hazards or manufacturing defects in real-time. Figure 1 is a reference architecture for a hazard detection solution running off a Google Distributed Cloud Edge Appliance on a factory floor.
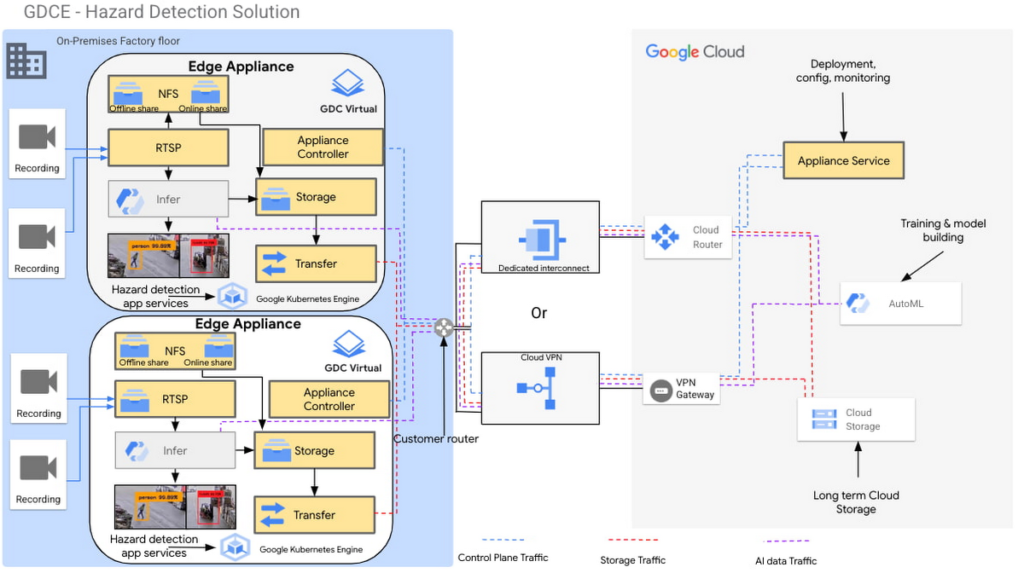
Figure 2 – Hazard detection architecture using Google Distributed Cloud Edge Appliance
In this architecture, cameras on the factory floor stream live video into the Google Distributed Cloud Edge Appliance. Depending on the number of cameras and appliances, cameras could be split or mapped to different appliances. This architecture makes it possible to initially transfer video data to Google Cloud using an online NFS share. Once in Google Cloud, you can use AutoML to train and build models that can be used as part of the hazard detection solution.
With these trained models, the cameras can stream video data into the appliance using the real-time streaming protocol (RTSP). You can then use AutoML inference to analyze the real-time video streaming data.
For example, in this reference architecture, if an individual comes too close to the fork lift, a function is triggered by the microservices running on the edge appliance that pushes a notification either to a messaging service, or to an enterprise resource planning tool. This alerts factory managers to factory floor hazards in real time so they can take corrective action.
You can also review messages and videos later on for preventive planning purposes, or push streamed videos to Cloud Storage for archive, to use the appliance’s storage space more efficiently.
Data transfers to Google Cloud can be done over Google Cloud Dedicated Interconnect, or VPN between the region and your site. This connectivity also allows you to send the appliance’s control-plane network traffic to the region.
You could also use the reference architecture in figure 2 for a product anomaly detection solution running off a Google Distributed Cloud Edge Appliance on a factory floor or manufacturing line. In this instance, machine learning models are trained to detect anomalies on finished products before final packaging.
Retail
In the retail industry, the Google Distributed Cloud Edge Appliance reference architecture in Figure 2 enables a number of transformative capabilities for retail operations, including:
- contactless checkout
- product scans
- mobile-scan-bag
- cashierless checkout
- unattended retail shops
- visual check-out monitoring
It does all this within a retailer’s facilities with the low latency and high throughput you need to process data locally, so you can obtain actionable insights from your data.
Or, you could use Google Distributed Cloud Edge Appliance at the edge to overhaul store management operations, for example, monitoring store occupancy, queue depth and wait times, detecting slips and falls and out-of-stock items, or monitoring inventory compliance.
Automotive
Advanced Driver Assistance Systems (ADAS) are becoming standard in modern automobiles. To successfully build and roll out continued improvements around ADAS, the automotive industry continues to run extensive tests on ADAS systems that are built into the vehicles they manufacture. Automotive companies can use Google Distributed Cloud Edge Appliance to modernize and transform how they collect data for the ADAS systems they’re developing. For example, test vehicles contain several different sensors that generate data, which can be quickly offloaded to an in-vehicle edge appliance.
Then, within the appliance, you can deploy containerized workloads to transform sensor data, infer videos and images and detect events. This alleviates the need for operators to label all events and allows development teams to quickly gather insights from the tests.
If you want to focus on a subset of information, you can transfer specific data or the entire data payload into Transfer Appliances when vehicles return to the development center. All these systems, i.e., transfer appliances and edge appliances, work in tandem to reduce local system administration and operational costs through a cloud-based control plane.
This approach allows you to deploy, track, monitor and configure services that are running in data centers or at edge locations from the cloud. From the factories, the data can be moved offline or online into Google Cloud where you can use different storage classes and processing capabilities to further process or store the data. You can also deploy newly trained models and business rules back to the edge appliances. In all this, data transfers between the cloud and the appliance are performed using end-to-end encryption, to give you control over your data.
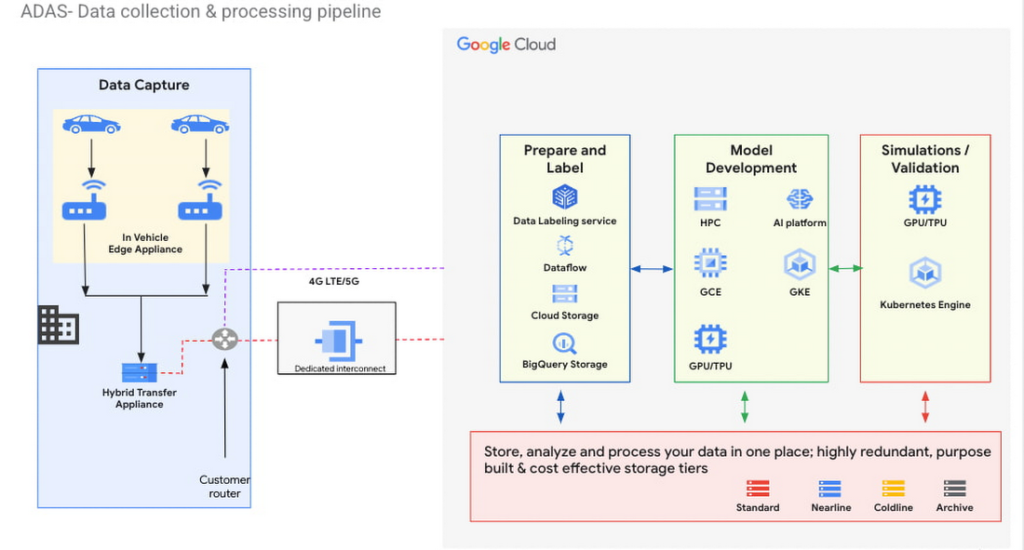
Figure 3 – ADAS implementation with a Google Distributed Cloud Edge Appliance
The reference architecture in Figure 3 shows an ADAS implementation where Google Distributed Cloud Edge Appliance is being used to gather, process and transform data at the edge in the automotive industry. It could also be applied to data capture and processing use cases in manned and unmanned vehicles. Notice how the Distributed Edge Appliance extends to the cloud by sending data there, or using other cloud-based services.
We’re just getting started
These are just a few of the use cases where organizations in the manufacturing, retail and automotive industries are using Google Distributed Cloud Edge Appliance with modern and containerized applications that are powered by Google Cloud. If you’re interested in bringing the power of Google Cloud to the edge using Google Distributed Cloud Edge Appliances to transform your business, reach out to us or any of our accredited partners.
3 Ways To Reduce App Downtime With Google Cloud’s API Monitoring Tools

3078
Of your peers have already read this article.
2:30 Minutes
The most insightful time you'll spend today!
How many times have you closed an application when you encounter the “spinning wheel of death” (a melodramatic way of saying an application that is taking too long to load)? In today’s digital economy where many organizations rely on applications as a primary source of revenue, that spinning wheel of death (or poor application performance) can mean lost users or revenue. And just about every modern application relies on APIs as the nervous system across distributed systems, third-party services and microservice architectures. While meeting the need for rapid release cycles and frequent API updates, it is also imperative for IT teams to ensure that your APIs are meeting SLOs, performance requirements, and proactively mitigating issues.
Why are synthetic monitoring tools not enough?
When thousands or even millions of users are making multiple requests to your APIs, just relying on synthetic monitoring tools (that rely on sampling or limited API availability information) is not enough for precision diagnoses or useful forensics. At the same time, monitoring every single aspect just increases your overhead and mean time to diagnosis. Apropos, API monitoring has become absolutely critical — and a fusion of art and science — for operations teams to make sure all APIs are running and performing as intended. If you are worried about monitoring blind spots or overheads, let us look at 3 key practices you can follow to stop dreading your sev1 alerts.
#1 Prioritize alerts for critical events requiring immediate investigation
- Ask any engineer on-call for a critical service and they will tell you about the overheads created by incorrectly prioritized alerts. For example let us imagine a distributed application with 20 APIs. Even if you set up basic alert monitors across latency, error, and traffic for these APIs, you end up monitoring and maintaining 60 alert definitions – which is a lot. To balance avoiding monitoring blindspots and alert fatigue at the same time, operations teams must develop a clear understanding of all events and prioritize configuring alerts for events supporting critical traffic.
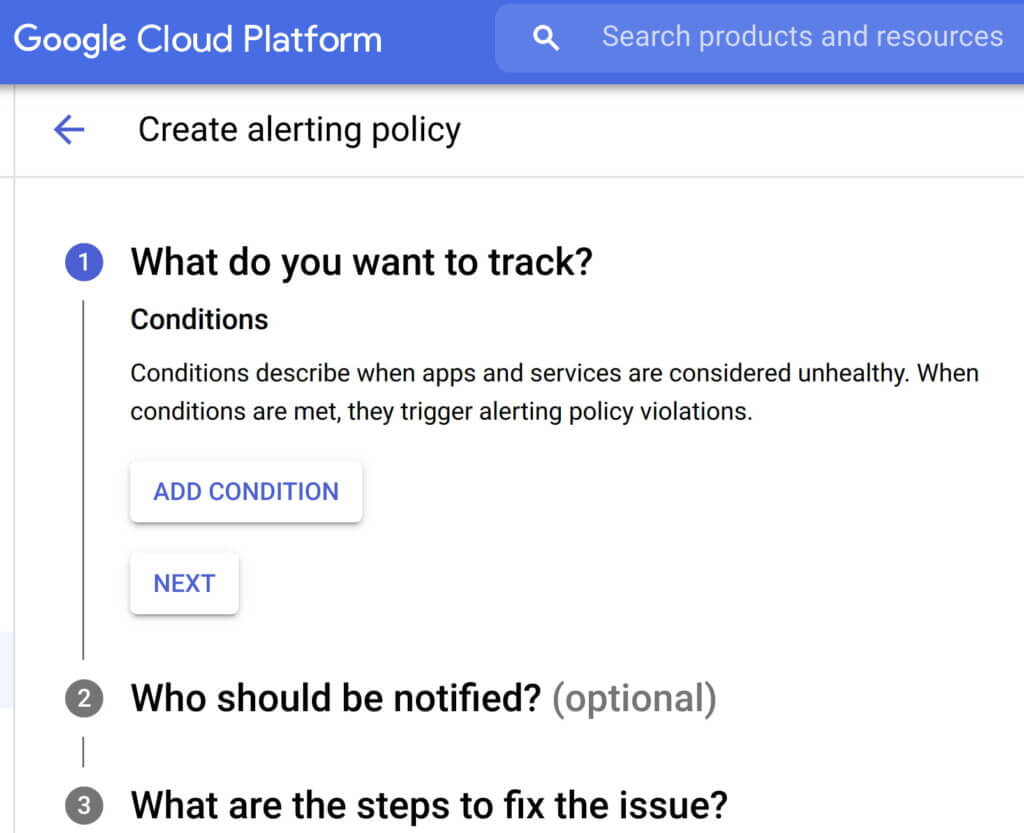
- Consider quality over quantity while defining new alert conditions where each new condition is urgent, actionable, and actively or imminently user-visible. Every alert condition created should also contain intelligence that requires active engagement from a user as opposed to a mere robotic response. Apigee’s API monitoring allows creation of alert conditions based on metrics or logs while providing actionable information (Ex: status code, rate etc.,) and playbooks for diagnosi
- In today’s multilayered systems, one team’s symptom (“what’s broken?”) is another downstream system’s cause (“Why?”). Even if some events are not suitable for actionable alerts, a failure needs to create an informational broadcast to a downstream system to mitigate the impact of the upstream dependency. In such cases, investing in automating alerts, grouping multiple incidents in notification channels, and incident tracking. For example, Apigee lets you integrate and group your alert notifications in channels like Slack, Pagerduty, webhooks etc.,
- Modern production systems are ever-evolving where an alert that’s currently rare might become frequent and automatable. Analogous to ticket backlog grooming, alert policies need to be reviewed periodically to make sure new conditions are identified and existing alerts are refined with new thresholds, prioritization and correlation. Controls like Advanced API Ops leverage AI and ML to detect anomalous traffic differentiated from random fluctuations to help define accurate alert definitions
Check out some examples of alerts here
#2 Isolate problem areas quickly with dashboards
Google’s Site Reliability Engineering book presents the case for efficient diagnosis by building dashboards that answer basic questions about every service, normally including some form of the four golden signals — latency, traffic, errors and saturation. But at the same time, capturing just these golden metrics at different levels of granularity can quickly add up. Like all software systems, monitoring can become an endless pit of complexity, complicated to change and a burden to maintain. In the same book, the most effective direction to create a well-functioning standalone system is to collect and aggregate basic metrics, paired with alerting and dashboards.
If you are running a large scale API program with a dedicated team to monitor your APIs, you can leverage the out-of-the-box monitoring dashboards in your API Management solution (like Apigee’s API monitoring) to gather real-time insights into your API performance, availability, latency, and errors. In other cases, you can use solutions like Cloud Monitoring that can provide visibility across your full application stack where individual metrics, events, and metadata can be visualized in a rich query language for rapid analysis. Leveraging a single system for your application stack provides observability in context and can reduce your time spent navigating between systems (Apigee customers can use Cloud Monitoring by default or integrate with other systems using Cloud Monitoring API)
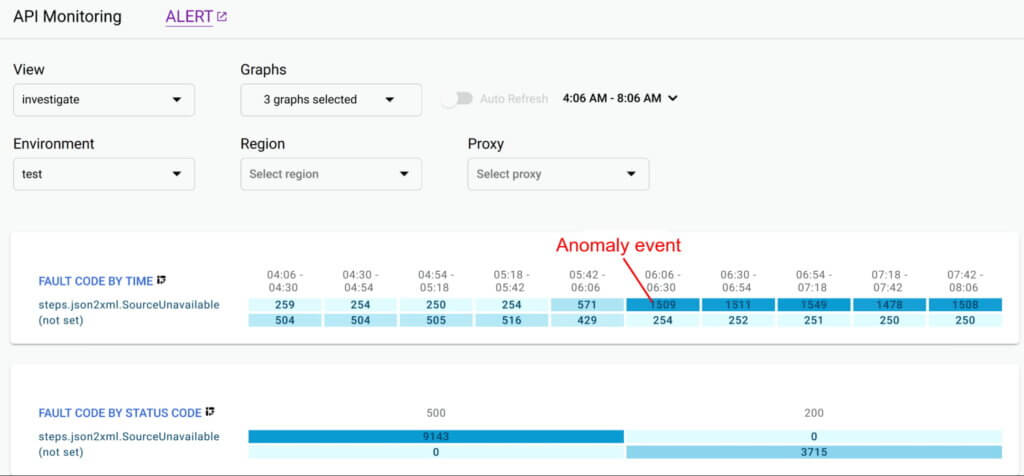
Even after you collect and aggregate the metrics, it is important to have impactful data visualizations to quickly understand the issue and identify correlations during diagnosis. In data visualizations as well, focusing on too many dashboards creates a steep learning curve and increases mean time for every diagnosis. For example, Apigee API Monitoring provides the following visualizations as a standard to balance simplicity and efficiency:
- Timeline view to diagnose traffic (in 1 min intervals), error rates (4xx and 5xx across traffic) and latencies (50th, 90th, 95th and 99th percentiles)
- Pivot tables of metrics and attributes for all API traffic, to help compare activity across different metrics
- Treemaps of recent API traffic by proxy to get a snapshot of incidents, error rates and latencies
#3 Incorporate distributed tracing into your end to end observability strategy
Modern application development accelerated the adoption of technologies and practices like cloud, containers, APIs, microservice architectures, DevOps, SRE etc. While this increases release velocity, it also introduces complexity and more points of failure in an application stack. For example, a slow response to a customer request spans across multiple micro services owned (and monitored) by various teams who might not observe any individual performance issues. Without an end-to-end contextual view of a request, it is nearly impossible to isolate the point of high latency.
In such cases, distributed tracing is the best way for DevOps, Operations and SREs to get answers to questions such as service health, root cause of defects, or performance bottlenecks in a distributed system. Organizations should invest in instrumenting their distributed applications using open source standards such as OpenCensus and Zipkin. Using tools like Cloud Trace with a broad platform, language and environment support can help easily ingest data from any source — open instrumentation or proprietary agents.
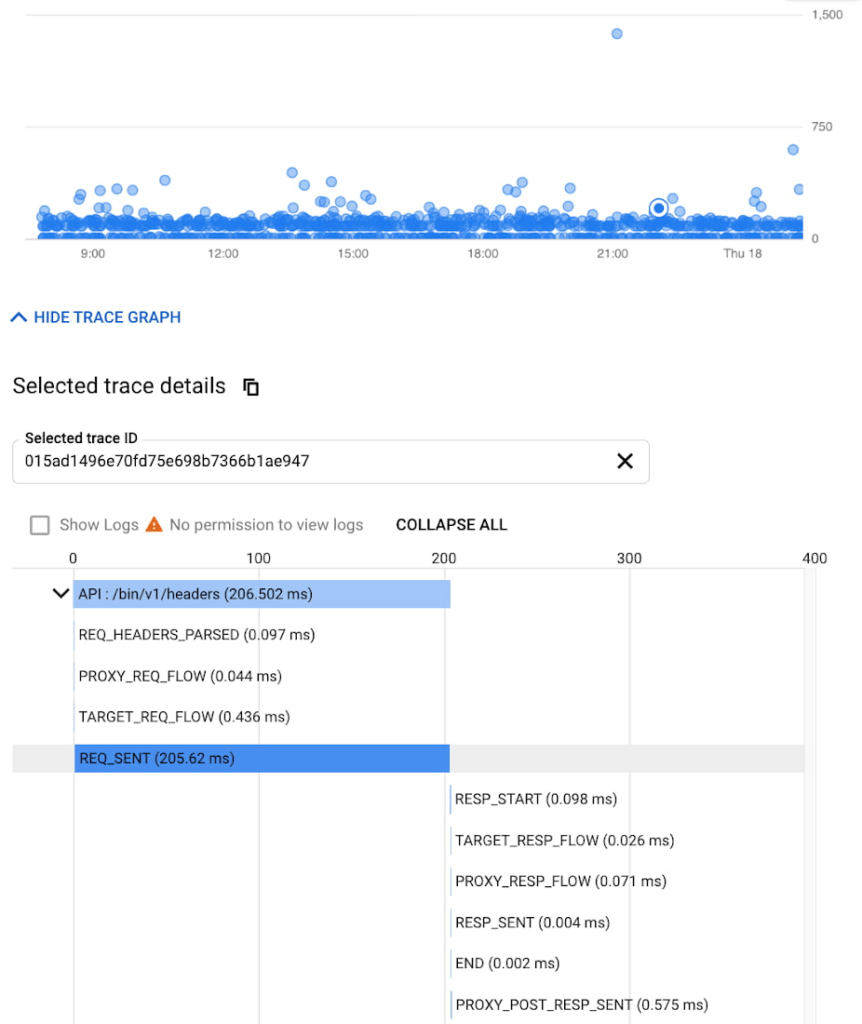
While distributed tracing helps in narrowing the issue to a given service, in some cases you might need further context to pinpoint the root cause. For example: Even if you have isolated the source of a performance issue to an API proxy, it is still a tedious process to identify the right bottleneck among multiple policies being executed. Tools like Apigee Debug enable you to zoom into an API proxy flow and probe the details of each step to see internal details like policy executions, performance issues, and routing etc.,
As soon as a request starts to span across a handful of microservices, tools like distributed tracing and Debug will become crucial elements of your monitoring strategy. When every service in a distributed system emits a trace, the amount of data can quickly become overwhelming leading to the classic “needle in the haystack” problem. In such scenarios, it becomes vital to ask the right questions and choose between head-based sampling (randomly selecting which traces will be sampled for analysis) and tail-based sampling (observe all trace information and sample the traces with unusual latency or errors) based on application complexity
Implement effective API monitoring in Apigee
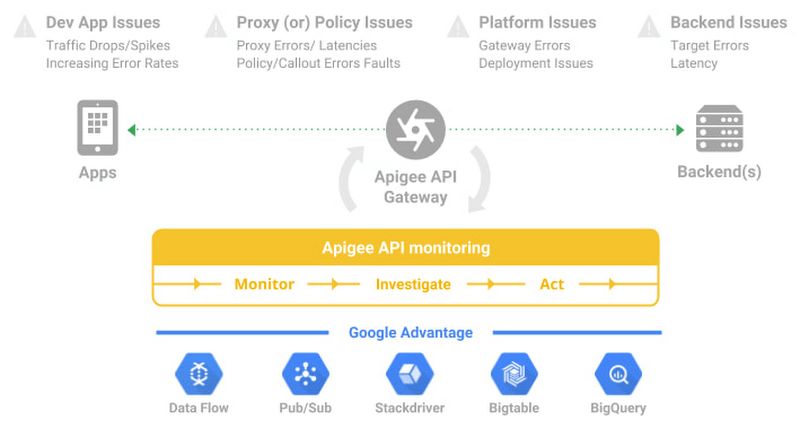
Apigee’s API monitoring (based on metrics exposed by the internals of the system) capabilities work with your existing monitoring infrastructure to help reduce mean time to diagnosis and increase application resiliency. Specifically, operations teams can leverage
- Monitoring dashboards to gain in-depth insights into API availability and performance metrics.
- Debug to precisely diagnose with deeper insights into an API proxy flow without toggling multiple tools.
- Alerts and notifications to gather contextual Insights, facilitate customization, and grouping with first class integrations to various tools (like Slack, PagerDuty, email and support for webhooks).
- Best of Google technologies such as Data Flow, Pub/Sub, Stackdriver, Bigtable and BigQuery to handle massive volumes and complex metrics at scale
Using Apigee’s API monitoring will help you maintain high application resiliency with comprehensive controls to reduce mean time to diagnosis and resolution. Get started with Apigee today or explore Apigee’s API monitoring for free here. Check out our documentation for additional information on API monitoring.
Rubin Observatory Leverages Google Cloud to Power Astronomical Research

6062
Of your peers have already read this article.
2:00 Minutes
The most insightful time you'll spend today!
This week, the Vera C. Rubin Observatory is launching the first preview of its new Rubin Science Platform (RSP) for an initial cohort of astronomers. The observatory, which is located in Chile but managed by the U.S. National Science Foundation’s NOIRLab in Tucson, AZ and SLAC in California, is jointly funded by the NSF and the U.S. Department of Energy. The platform provides an easy-to-use interface to store and analyze the massive datasets of the Legacy Survey of Space and Time (LSST), which will survey a third of the sky each night for ten years, detecting billions of stars and galaxies, and millions of supernovae, variable stars, and small bodies in our Solar System.
The LSST datasets are unprecedented in size and complexity, and will be far too large for scientists to download to their personal computers for analysis. Instead, scientists will use the RSP to process, query, visualize, and analyze the LSST data archives through a mixture of web portal, notebook, and other virtual data analysis services. An initial launch with simulated data, called Data Preview 0, builds on the Rubin Observatory’s three-year partnership with Google to develop an Interim Data Facility (IDF) on Google Cloud to prototype hosting of the massive LSST dataset. This agreement marks the first time a cloud-based data facility has been used for an astronomy application of this magnitude.
Bringing the stars to the cloud
For Data Preview 0, the IDF leverages Cloud Storage, Google Kubernetes Engine (GKE), and Compute Engine to provide the Rubin Observatory user community access to simulated LSST data in an early version of the RSP. The simulated data were developed over several years by the LSST Dark Energy Science Collaboration to imitate five years of an LSST-like survey over 300 square degrees of the sky (about 1,500 times the area of the moon). The resulting images are very realistic: they have the same instrumental characteristics, such as pixel size and sensitivity to photons, that are expected from the Rubin Observatory’s LSST Camera, and they were processed with an early version of the LSST Science Pipelines that will eventually be used to process LSST data. “This will be the first time that these workloads have ever been hosted in a cloud environment. Researchers will have an opportunity to explore an early version of this platform,” says Ranpal Gill, senior manager and head of communications at the Rubin Observatory.
Broadening access for more researchers
Over 200 scientists and students with Rubin Observatory data rights were selected to participate in Data Preview 0 from a pool of applicants that represents a wide range of demographic criteria, regions, and experience level. Participants will be supported with resources such as tutorials, seminars, communication channels, and networking opportunities—and they will be free to pursue their own science at their own pace using the data in the RSP.
“The revolutionary nature of the future LSST dataset requires a commensurately innovative system for data access and analysis paired with robust support for scientists,” says Melissa Graham, lead community scientist for the Rubin Observatory and research scientist in the astronomy department at the University of Washington. “I’m personally excited to enhance my own skills by using the RSP’s tools for big data analysis, while also helping others to learn and to pursue their LSST-related science goals during Data Preview 0.”
At the same time, the fact that the RSP is hosted in the cloud provides researchers at smaller institutions access to state-of-the-art astronomy infrastructure that is comparable to that of the largest national research centers.
The launch benefits the observatory too: the development team can learn what researchers are interested in while also testing and debugging the platform. Graham says that “the platform is still in active development so researchers using it will be able to follow along in the progress, and provide feedback on ways that we can optimize the development of the tools.”
Next steps
The LSST aims to begin the ten-year survey in 2023-24 and expects it to include 500 petabytes of data. Through the cloud, Google aims to help make this extraordinary project scalable and accessible to researchers everywhere. To learn more about Data Preview 0, watch this video.
Want to ramp up your own research in the cloud? We offer research credits to academics using Google Cloud for qualifying projects in eligible countries. You can find our application form on Google Cloud’s website or contact our sales team.
Ensuring Reliability in a DevOps World: Insights from the 2022 State of DevOps Report

2675
Of your peers have already read this article.
3:30 Minutes
The most insightful time you'll spend today!
When a software change is deployed — after being designed, coded, tested, packaged, and tested some more — a journey comes to an end. At the same time, a new journey begins: your customer’s relationship with your service. It’s here, in the domain of operations, that abstract risks like launch schedule slippage give way to tangible risks like lost revenue, degraded trust, and tarnished reputation. Only when it’s available to users can software contribute to (or threaten!) the success of your organization. And so, throughout the past several years, the DevOps Research and Assessment (DORA) project has incrementally deepened our research into the reliability of services, through and beyond deployment, into ongoing operation.
Reliability is a broadly defined term, which refers to a team’s ability to meet their users’ expectations — for software services, it may encompass aspects of availability, latency, correctness, or other characteristics that influence the consistency and quality of user experience. Google’s practice of Site Reliability Engineering (SRE), which has been embraced and extended by a global community of reliability engineering practitioners, is an approach to operations that prioritizes user-oriented measurement, shared responsibility, and collaborative, blameless learning. Starting with the 2021 Accelerate State of DevOps Report, we began asking survey respondents detailed questions about reliability engineering in their organizations. We continued and expanded our investigation in 2022, and found further evidence that modern reliability engineering is widespread: a majority of respondents report that they employ SRE-style practices. With this extensive body of data to draw from, this year we pushed further into analyses of the impact of reliability and its interaction with other dynamics present in our model of technology’s influence on organizational success.
Reliability matters
When reliability is poor, improvements to software delivery have no effect — or even a negative effect — on organizational outcomes
Reliability is more than beneficial: it’s essential. As in prior studies, we find that software delivery performance (as measured by the “four key metrics” of change lead time, deploy frequency, change failure rate, and failure recovery time) is predictive of organizational performance. However, this year’s analysis revealed a previously unseen nuance: the influence of software delivery on organizational performance is predicated on reliability. When reliability is high, high-performance software delivery predicts better outcomes for the organization. But when reliability is poor, improvements to software delivery have no effect — or even a negative effect — on organizational outcomes. This affirms a long-held belief among reliability engineers: “reliability is the most important feature of any system.” If a service or product doesn’t meet its users’ reliability expectations, it’s counter-productive to rapidly ship flashy new features, because users can’t properly experience them. Software delivery relies on a foundation of reliability to create value.
https://storage.googleapis.com/gweb-cloudblog-publish/images/dora.max-900×900.jpg
Reliability is a journey
Any experienced leader will tell you that progress is rarely linear: even with a discipline like SRE, widely practiced and with demonstrable benefits, the path to success is unlikely to follow a straight line. DORA describes the “J-Curve” of organizational transformation, a phenomenon in which durable success comes only after setbacks and lessons learned. This year, we compared the depth of teams’ reliability engineering practices to their impact on the services they provide: will an investment in SRE produce greater reliability? The answer is yes, but with a significant caveat: not at first. Comparing reliability outcomes across a range of levels of SRE adoption, the J-Curve is plainly visible. A team which practices SRE only lightly — at the beginning of their SRE journey, perhaps — is likely not only to not benefit, but to regress in terms of the reliability experienced by their users. However, after these practices have more deeply permeated, an inflection point is reached and we see strong reliability benefits from continuing to grow the reliability engineering capability.
Knowing that it will likely take time to realize the benefits of adopting SRE, it may be tempting to start the process as soon, and as broadly, as possible. But we offer a note of caution here: organization-wide cultural transformation initiatives typically fail from overreach. We studied this and reported findings in a previous report. And even if you manage to beat the odds and fully adopt SRE across multiple teams simultaneously, the cost may be unacceptable: the setbacks in reliability that you are likely to experience early on, amplified across an entire organization all at once, could have catastrophic consequences. Therefore the SRE principle of gradual change should also be applied to the adoption of SRE itself.
Reliability is about people
Reflecting back on over a decade of SRE practice and theory, the Enterprise Roadmap to SRE underlines the importance of culture, suggesting that Site Reliability Engineering is in fact emergent from culture. Tools and frameworks are important; language is essential. But only a trustful, psychologically safe culture can support the environment of continuous learning which enables SRE to manage today’s complex, dynamic technology environments. DORA’s research in 2022 demonstrates the interplay between culture and reliability: we found that “generative” culture, as defined by the Westrum model, is predictive of higher reliability outcomes. And reliability has benefits not only for a system’s users, but for its makers as well: teams whose services are highly reliable are 1.6 times less likely to suffer from burnout.
Got a story to share about your DevOps journey? Submit it to Google Cloud’s 2022 DevOps Awards by January 31, 2023!
Lending DocAI Shortens Borrowers’ Journey on Roostify

11793
Of your peers have already read this article.
3:00 Minutes
The most insightful time you'll spend today!
The home lending journey entails processing an immense number of documents daily from hundreds of thousands of borrowers. Currently, home lending document processing relies on some outdated digital models and a high dependency on manual labor, resulting in slow processing times and higher origination costs. Scaling a business that sorts through millions of documents daily, while increasing efficacy and accuracy, is no small feat. When it comes to applying for a mortgage loan, consumers expect a digital experience that’s as good as the in-person one. Roostify simplifies the home lending journey for lenders and their customers.
No time to spare: Overcoming document processing challenges with AI
Roostify provides enterprise cloud applications for mortgage and home lenders. In order to empower its customers to deliver a better, more personalized lending experience, they needed to automate and scale their in-house document parsing functionality.
As a key component of its document intelligence service, Roostify is leveraging Google Cloud’s Lending DocAI machine learning platform to automate processing documents required during a home loan application process, such as tax returns or bank statements with multi-language support. This partnership delivers data capture at scale, enabling Roostify customers to automatically identify document types from the uploaded file and to extract relevant entities such as wages, tax liabilities, names, and ID numbers for further processing, and make things move faster in the cumbersome lending process.
Roostify’s solutions leverage Google Cloud’s Lending DocAI, which is built on the recently announced Document AI platform, a unified console for document processing. Customers can easily create and customize all the specialized parsers (e.g., mortgage lending documents and tax returns parsers) on the platform without the need to perform additional data mapping or training. All Google Cloud’s specialized parsers are fine-tuned to achieve industry-leading accuracy, helping customers and partners confidently unlock insights from documents with machine learning. Learn more about the solution from the GA launch blog and the overview video.
Integrating Lending DocAI’s intelligent document processing capabilities into the Roostify platform means more innovation for their customers and tangible results: faster loan processing times, fewer document intake errors, and lower origination costs. Additional support in Google Lending DAI for other languages and more documents like global Know Your Customer (KYC) documents or payroll reports is in the near future.
Full integration of AI solutions
Working together with Roostify’s platform team, we were able to help them solve their document processing challenge through integration of various GCP products such as Lending DocAI (LDAI), Data Loss Prevention (DLP) for redacting sensitive data, BigQuery for data warehousing and analytics, and Firestore for API status. To make it very safe and secure, all data was encrypted end-to-end at Rest and in Transit. LDAI won’t require any training data to process. It is an easy plug and play API.
Here is a sneak peek in the high level deployment architecture for LDAI in Roostify environment:

Here are the steps for processing data:
- Receives document processing request from the client.
- API Function directs requests to the pre-processing service. For Async requests a processing ID is generated and returned to the caller.
- Pre-processing service sends the request for further processing (Long/short PDF conversion), calling other microservices and receives back the responses. Any error in the response received is then sent to the response processing service.
- If the response is synchronous, the pre-processing service directs it to the LDAI Invoker service.
- If the response is asynchronous, the pre-processing service feeds it into the Cloud Pub/Sub service.
- Cloud Pub/Sub service feeds the response back to the LDAI Invoker service.
- LDAI Invoker service routes the request to the Google LDAI API for classification if there are multiple pages in the document.
- Document will be split based on LDAI response and then saved in a GCS bucket for temporary storage.
- LDAI entity interface for single page processing and then LDAI Invoker sends LDAI results to LDAI Response Processing
- If a request is a synchronous request the LDAI Response Processor sends results to the API Function so that it can complete the synchronous call and respond to the rConnect caller.
- If the request is an asynchronous request the LDAI Response Processor will respond to the caller’s webhook and complete the transaction.
- Finally, Data stored in the GCP bucket will be deleted.
All the responses that come from the LDAI API can optionally feed into BigQuery via the Response Processor, after parsing it through Data Loss Prevention (DLP) API to redact the PII/sensitive information. Throughout the processing of both asynchronous and synchronous requests all transactions are logged using Cloud Logging. For asynchronous transactions, the state is maintained throughout the process using Cloud Firestore.
Roostify currently uses this technology to power two different solutions: Roostify Document Intelligence and Roostify Beyond™. Roostify Document Intelligence is a real-time document capture, classification, and data extraction solution built for home lenders. It ingests documents uploaded by borrowers and loan officers, identifies the relevant documents, and extracts and classifies key information. Roostify Document Intelligence is available as a standalone API service to any home lender with any digital lending infrastructure already in place.
Roostify Beyond™ is a robust suite of AI-powered solutions that enables home lenders to create intelligent experiences from start to close. It combines powerful data, insightful analytics, and meaningful visualization to streamline the underwriting process. Roostify Beyond™ is currently available only to Roostify customers as part of an Early Adopter program and will be rolled out to the market later this year.


Through this partnership, Roostify has enabled its customers to adopt a data-first approach to their home lending processes, which will lead to improved user experiences and significantly reduced loan processing times.
Fast track end-to-end deployment with Google Cloud AI Services (AIS)
Google AIS (Professional Services Organization), in collaboration with our partner Quantiphi, helped Roostify deploy this system into production and fast-tracked the development multifold to generate the final business value.
The partnership between Google Cloud and Roostify is just one of the latest examples of how we’re providing AI-powered solutions to solve business problems.
More Relevant Stories for Your Company

Application Modernization Made Easy
Modernizing apps on the cloud isn’t an “all or nothing” decision. Businesses want the option to modernize on-premises or choose multi-cloud solutions that meet their needs. That’s why we created a new solution for running apps anywhere – simply, flexibly, and securely. Embracing open standards, Anthos lets you run your applications, unmodified,
How Google Anthos Can Help Modernize Application Security
Anthos is a modern app management platform from Google Cloud that aims to deliver a consistent development, operations, and security experience across cloud environments. Anthos is designed for enterprise organizations that want to accelerate the development and deployment of dynamic apps and who value service automation, cost governance, and security

A Pro’s Tip on Choosing the Right Google Cloud Compute Options
Where should you run your workload? It depends...Choosing the right infrastructure options to run your application is critical, both for the success of your application and for the team that is managing and developing it. This post breaks down some of the most important factors that you need to consider




Guide: How to Accelerate App Development with Google Cloud
Cloud-native, Kubernetes, Serverless have been the hottest and most widely discussed topics given the velocity and agility benefits. Learn more about how you can leverage these modern app development practices to ship software faster, while reducing costs and improving security and compliance. Learn how Google Cloud lets you modernize existing
