





Query Insights for Spanner: A blessing for developers and DBAs

3298
Of your peers have already read this article.
1:30 Minutes
The most insightful time you'll spend today!
Today, application development teams are more agile and are shipping features faster than ever before. In addition to these rapid development cycles and the rise of microservices architectures, the end-to-end ownership of feature development (and performance monitoring) has moved to a shared responsibility model between advanced database administrators and full-stack developers. However, most developers don’t have the years of experience or the time needed to debug complex query performance issues and database administrators are now a scarce resource in most organizations. As a result, there is a dire need for tools for developers and DBAs alike to quickly diagnose performance issues.
Introducing Query Insights for Spanner
We are delighted to announce the launch of Query Insights for Spanner, a set of visualization tools that provide an easy way for developers and database administrators to quickly diagnose query performance issues on Spanner. Using Query Insights, users can now troubleshoot query performance in a self-serve way. We’ve designed Query Insights using familiar design patterns with world-class visualizations to provide an intuitive experience for anyone who is debugging issues with query performance on Spanner. Query Insights is available at no additional cost.
By using out-of-the-box visual dashboards and graphs, developers can visualize aberrant behavior like peaks and troughs in various performance metrics over a time-series and quickly identify problematic queries. Time series data provides significant value to organizations because it enables them to analyze important real-time and historical metrics. Data is valuable only if it’s easy to comprehend;. that’s where being able to view intuitive dashboards becomes a force multiplier for organizations looking to expose their time series data across teams.
Follow a visual journey with pre-built dashboards
With Query Insights, developers can seamlessly move from detection of database performance issues to diagnosis of problematic queries using a single interface. Query Insights will help identify query performance issues easily with pre-built dashboards.
The user could do this by following a simple journey where they can quickly confirm, identify and analyze query performance issues. Let’s walk through an example scenario.
Understand database performance
This journey will start by the user setting up an alert on Google Cloud Monitoring for CPU utilization going above a certain threshold. The alert could be configured in a way that if this threshold is crossed, the user will be notified with an email alert, with a link to the “Monitoring” dashboard.
Once the user receives this alert, they would click on the link in the email, and navigate to the “Monitoring” dashboard. If they observe high CPU Utilization and high read latencies, the possible root cause could be expensive queries. A spike in CPU Utilization could be a strong signal that the system is using more compute than it usually would, due to an inefficient query.
The next step is to identify which query might be the problem, this is where Query Insights comes in. The user can get to this tool by clicking on Query Insights in the left navigation of your Spanner Instance. Here, they can drill down into the CPU usage by query and observe that for a specific database, CPU Utilization (attributed to all queries) is spiking for a particular time window. This confirms that the CPU utilization is due to inefficient queries.
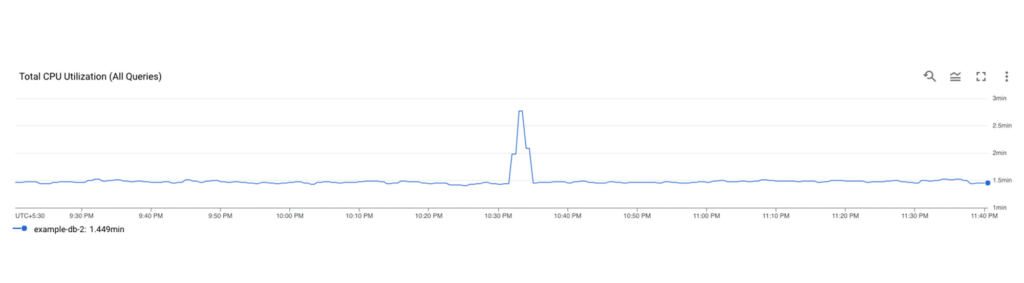
Identifying a problematic query
The user now observes the TopN (Top queries by CPU Utilization) query graph to see the TopN queries by CPU Utilization. From the graph, it is very easy to visualize and identify the top queries which could be causing the spike in CPU Utilization.
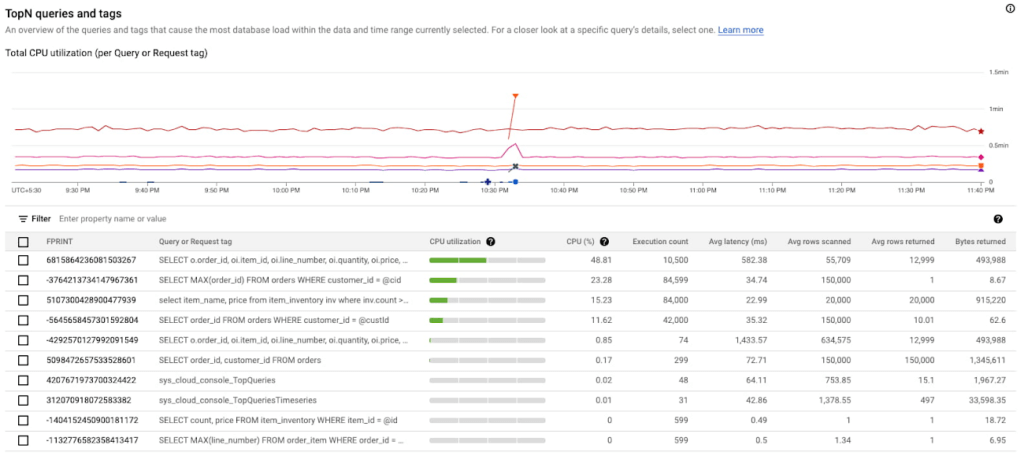
In the above screenshot, we can see that the first query in the table is showing a clear spike at 10:33 PM consuming 48.81% of total CPU. This is a clear indication that this query could be problematic, and the user should investigate further.
Analyzing the query performance
Once they have identified the problematic query, they can now drill down into this query shape to confirm, identify the root cause of the high CPU utilization.
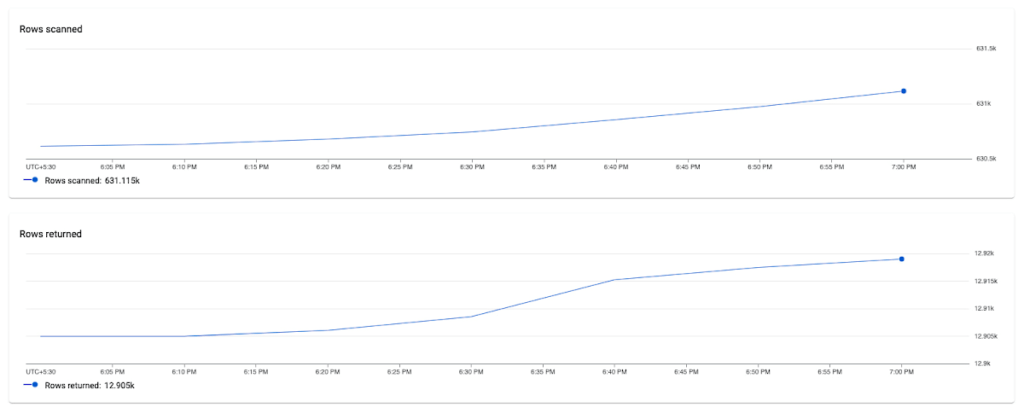
They can do this by clicking on the Fingerprint ID for the specific query from the topN table, and navigating to the Query Details page where they will be able to see a list of metrics (Latency, CPU Utilization, Execution count, Rows Scanned / Rows Returned) over a time series for that specific query.
In this example, we notice that the average number of rows scanned for this specific query are very high (~ 600k rows scanned to return ~ 12k rows), which could point to a poor query design, resulting in an inefficient query. We can also observe that latency is high (1.4s) for this query.
Fixing the issue
To fix the problem in this scenario, the user could optimize this query by specifying a secondary index in the query using a FORCE_INDEX query hint to provide an index directive. This would provide more consistent performance, make the query more efficient, and lower CPU utilization for this query.
In the screenshot below, you can see that after specifying the index in the query, the query performance dramatically increases in terms of CPU, rows scanned (54K vs 630k) and also in terms of query latency (536 ns vs 1.4 s).
Unoptimized Query:
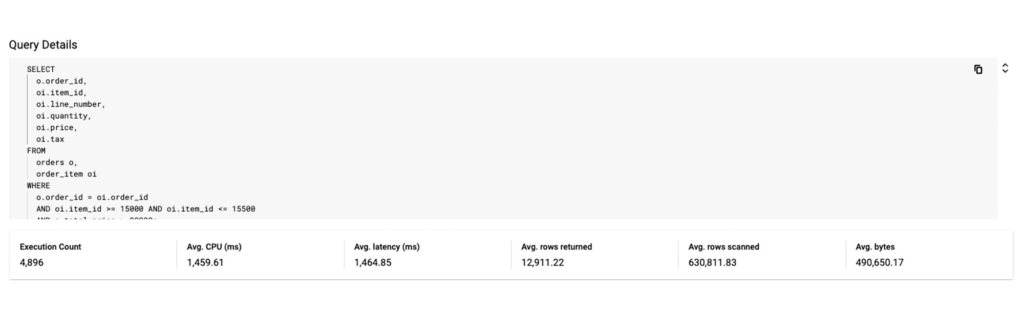
Optimized Query:
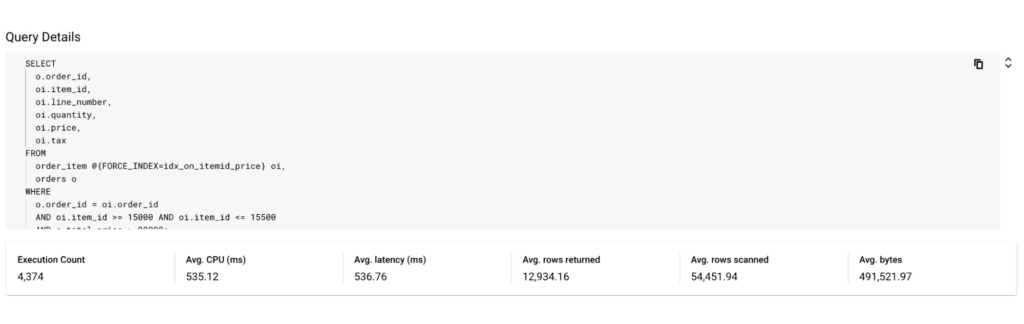
By following this simple visual journey, the user can easily detect, diagnose and debug inefficient queries on Spanner.
Get started with Query Insights today
To learn more about Query Insights, review the documentation here. Query Insights is enabled by default. In the Spanner console, you can click on Query Insights in the left navigation and start visualizing your query performance metrics!
New to Spanner? Get started in minutes with a new database.
Transforming Software Development Education with CourseMatix

1481
Of your peers have already read this article.
3:00 Minutes
The most insightful time you'll spend today!
As the world increasingly relies on software, businesses have struggled to find enough developer talent to build and maintain their applications. IDC estimates the global shortage of software developers reached 1.4 million in 2021 and expects that number to balloon to 4 million by 2025.
Higher education is a great starting point to solve the software development skills shortage. One institution — Spokane Community College — has made strides in enhancing student learning and serving more students with the right mix of software development and IT education while saving educators time.
Building a modern IT education platform
As a first step to improve computer science education and scale the number of students it could teach, Spokane Community College needed a platform that could help instructors more efficiently manage the teaching process. That’s where CourseMatix came in.
CourseMatix is an education platform that delivers the required tools, platforms, and frameworks such as automated grading, assignment tracking, and testing to save teachers time and enhance students’ learning.
CourseMatix is entirely made up of microservices, with significant compute demands because it creates and runs a unique dedicated environment for each student. The platform is complex by nature as it supports a range of technologies that computer science professors need to teach varying coursework. This led to issues with scalability, reliability, and uptime when running on legacy infrastructure.
“We really wanted to no longer manage our infrastructure, leaving us to focus entirely on our platform,” says Aleks Korn, chief executive officer of CourseMatix. “We engaged Google Cloud partner CDW to see how we could simplify and improve our IT environment. The decision was quickly made to migrate to Google Kubernetes Engine (GKE).”
GKE provides CourseMatix with automatic horizontal and vertical scaling to minimize costs and downtime, while removing management and maintenance requirements. This enables CourseMatix to expand the reach of its platform at the lowest possible price and maintain a lean team. CDW helped CourseMatix make this decision to migrate to GKE, managed the migration, and provided guidance on a storage solution.
Because CourseMatix has high data storage volume requirements (given the size of software development assignments) and needs to be fully reliable to ensure work is not lost, it also chose to work with NetApp. NetApp Cloud Volumes Service for Google Cloud perfectly complements GKE in its highly expandable, reliable, and user-friendly capabilities. The platform was now ready for its U.S. launch at Spokane Community College.
Transforming software development education
Spokane Community College needed a solution to address the challenges facing its professors, particularly with respect to time management.
“Each software development assignment can take an hour to grade,” says Bret Dickey, professor of software development at Spokane Community College. “When you have 100 students, you’re talking weeks of turnaround time to grade those projects. CourseMatix provides immediate feedback, which is a game changer for us as professors and our students.”
Students now complete and submit their assignments with real-world tools, using source control, creating branches to complete their work, and merging those branches to push up to the server where pipelines run the applications.
“It’s making our teaching better overall, including using real-world concepts to enhance teaching and outcomes,” says Dickey.
CourseMatix also provides the tooling to upskill on various programming languages and software packages required for coursework, helping Spokane Community College manage server-side frameworks and client-side languages that each have their own tools.
“Students can access their cloud-based coding environment and all the tools they may need for an assignment are ready to go,” says Karmen Blake, another software development professor at Spokane Community College. “Having a central system for tooling within CourseMatix has been a huge time saver, meaning more time for learning and practice that prepares students for careers as professional software developers.”
Karmen and Dickey have seen marked improvements in their ability to teach and in student learning by using CourseMatix. For example, the platform provides automated hints and varying error messages based on the number of attempts a student has made to solve a problem to help each student along without making the assignment too easy or too difficult.
As a cloud-based platform, CourseMatix also empowers students from a wide range of socioeconomic backgrounds to learn computer science.
“As long as students can access the internet on their laptops, they have everything to complete their assignments,” says Karmen. “The cloud-based CourseMatix offering improves efficiency and equity across all students in our computer science programs.”
With a more fluid experience for students and immense amounts of time saved on grading, Spokane Community College is in a better position to increase enrollment in software development classes.
“Now that we have automated our grading and optimized our assignment processes, I am beginning to take on more students and teach more classes,” says Dickey. “I could not have imagined this outcome only a couple of years ago, and it’s all possible thanks to CourseMatix.”
To learn more about how partners help organizations make the most of Google Cloud, you can visit our partner page.
Google Cloud’s Transfer Services Helps Move Nuro’s Petabytes of Data from Edge to the Cloud

5156
Of your peers have already read this article.
3:00 Minutes
The most insightful time you'll spend today!
Engineers that build last-mile delivery services belong to an elite order, a hallowed subcategory. Delivery customers are incredibly demanding when it comes to speed and convenience, and the services they use must take variables like increased traffic, road conditions, human error, and even driver availability into account every day.
Nuro is a company with a new approach to delivery services. Nuro has a fleet of autonomous vehicles designed to address many of the problems related to last-mile delivery. And every day, these vehicles — and their sensors — generate a lot of data before parking for the night. For Nuro engineers, that data can help them understand the impact of new on-road features, make improvements to their vehicles’ software, and ensure even better deliveries for their customers.
For Nuro, the key challenge is how to move petabytes of data as quickly, securely, and easily as possible from their edge environments, like vehicle depots, to Google’s Cloud Storage. For this delivery effort, Nuro selected Google’s Transfer Appliance with its new online transfer capability, now generally available.
Helping Nuro to speed up data delivery from the edge to the cloud
Like many Google Cloud customers, Nuro collects data from remote environments, like vehicle depots, that have different networking and storage capabilities when compared to a traditional data center. For a transfer solution to be effective moving unstructured data from these environments to the cloud, the solution needs to be easy to deploy and automate, while still providing similar performance as a more complicated alternative.
The Transfer Appliance was built for this use case. It arrives to customers as a physical appliance with a preconfigured version of Google’s Storage Transfer Service software already installed. Customers can move files to the appliance by using SFTP or SCP, or, alternately, can mount the appliance as an NFS share and copy target. Data can be stored locally on the appliance or transferred over the network, and secure encryption — at-rest and in-flight — is enabled by default.
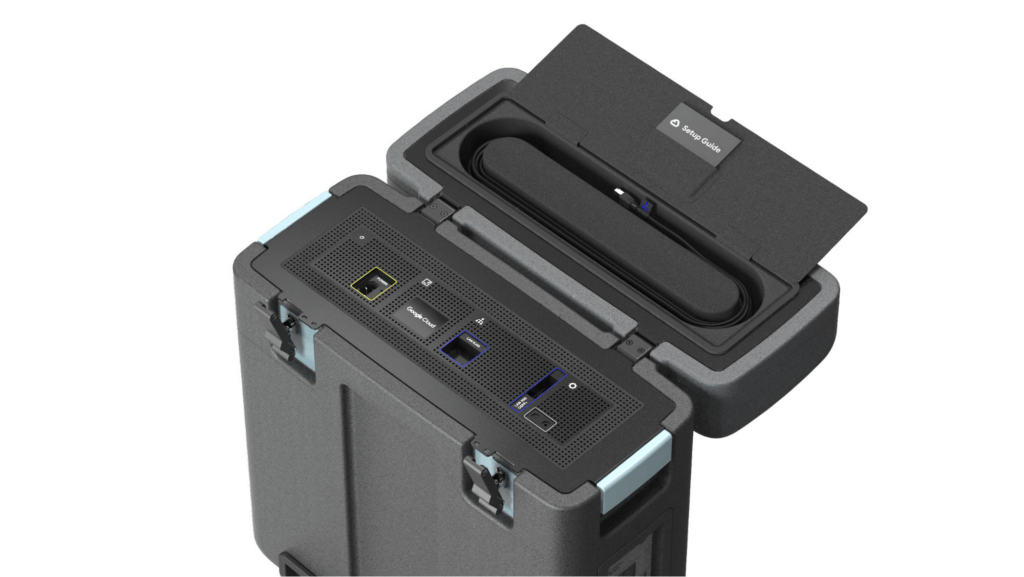
With these new appliances, Nuro will be able to automate much of their storage transfer needs. When their autonomous vehicles return to the depot, they can move data like software logs, LIDAR data, and sensor data — all ideal fits for Google’s Cloud Storage — from parked vehicles to the Transfer Appliance. Online transfers can then be performed throughout the day, ensuring a steady stream of valuable data in the cloud for developers to analyze and use in their nightly builds. All of this will help Nuro’s engineering leaders like Jie Pan to run more productive development teams with less operational overhead.
“Our autonomous vehicles generate a tremendous amount of useful data, and our goal is to get that data to our engineers as soon as possible,” said Jie Pan, Engineering Manager at Nuro. “When vehicles return to the depot, we can move data hourly into Cloud Storage over the network. We also have the flexibility to return the Transfer Appliance back to Google Cloud. Most importantly, this rapid transfer architecture gives a meaningful boost to engineering productivity and development velocity.”
Going the extra mile
Engineering and infrastructure leaders understand the value of delivering the right data to the right teams, as fast as possible. By adding preconfigured, over-the-network transfer into a turnkey Transfer Appliance, Google Cloud customers can more easily automate these data deliveries by scheduling regular migrations of on-premises files, objects, and other unstructured data to our Cloud Storage.
As Nuro continues to grow their manufacturing and testing footprint, they plan to use Transfer Appliances to further scale and simplify their data migration from on-premises to Google Cloud. Cutting the time to migrate their data by more than half will make for happier, more productive developers, and that will help Nuro bring us all the future of delivery a little faster.
If you’d like to learn more about Transfer Appliance and its new online transfer capability, click here or reach out to your Google Cloud account team.
5 Reasons Your Legacy Data Warehouse Won’t Cut It

4474
Of your peers have already read this article.
8:15 Minutes
The most insightful time you'll spend today!
As we engage with enterprises across the globe, one thing is becoming clear: Today’s businesses are solving complex business problems that are data-intensive.
But often, their data platform infrastructure is holding them back. Data platform architectures that were designed in the 1990s are not ready to solve business problems for 2020. We don’t have to tell you about the explosive data growth that’s going on for businesses around the world. If you’re managing data infrastructure today, you already know plenty about that data growth.
Ever faster and larger data streams, global business needs, and tech-savvy users are all putting the pressure on IT teams to move faster, with more agility.
Despite all these changes, it is often the legacy, traditional data warehouse where most of the data analytics tasks take place, and they’re underprepared for those demands.
When we talk to people working in IT today, we hear a lot about the constraints that come with operating legacy technology while trying to build a modern data strategy. Those legacy data warehouses likely aren’t cutting it anymore. Here’s why—and here’s what you can do about it.
1. Business agility is hard to achieve with legacy tools.
Business agility is the main goal as organizations move toward completely digital operations. Think of online banking, or retailers staying ahead of always-on e-commerce needs in a competitive environment. All these great, cutting-edge innovations reflect cultural and technical change, where flexibility is essential. A business has to be able to manage and analyze data quickly to understand how to better serve customers, and allow its internal teams to do their best work with the best data available.
We hear that lots of data warehouses running today are operating at 95% or 100%, maxing out what they can provide to the business.
Whether it’s on-premises or an existing data warehouse infrastructure moved wholesale to cloud, those warehouses aren’t keeping up with all the data requests users have. Managing and preventing these issues can take up a lot of IT time, and the problems often compound over time. Hitting capacity limits slows down users and ties up database administrators too.
From a data infrastructure perspective, separating the compute and storage layers is essential to achieve business agility. When a data warehouse can handle your scalability needs and self-manage performance, that’s when you can really start being proactive.
2. Legacy data warehouses require a disproportionate degree of management.
Most of the reports and queries your business runs are probably time-sensitive, and that sense of urgency is only increasing as users and teams see the possibilities of data analytics.
In our engagements with customers, we often observe that they are spending a majority of the time on systems engineering, so that only about 15% of the time is spent analyzing data. That’s a lot of time spent on maintenance work.
Because legacy infrastructure is complex, we often hear that businesses continue to invest in hiring people to manage those outdated systems, even though they’re not advancing data strategy or agility.
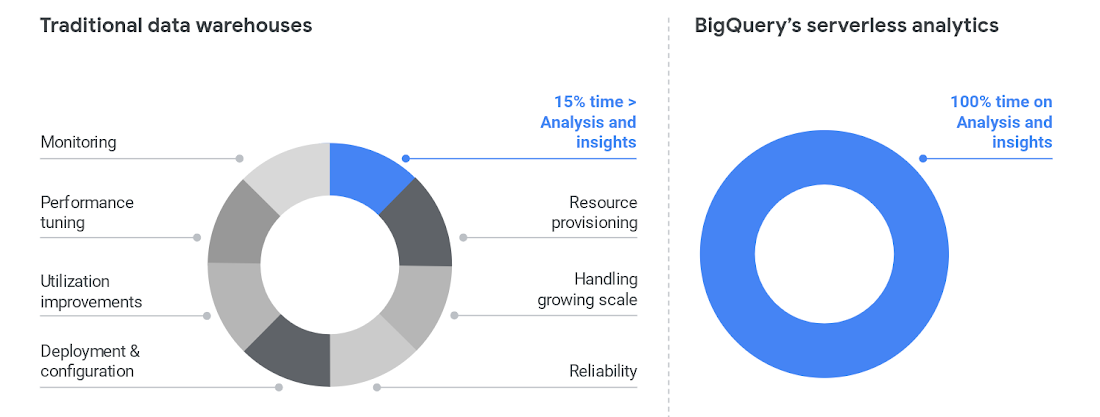
To cut time on managing a data warehouse, it helps to automate the system engineering work away from the analytics work, like BigQuery enables.
Once those functions are separated, the analytics work can take center stage and let users become less dependent on administrators. BigQuery also helps remove the user access issues that are common with legacy data warehouses. Once that happens, users can focus on building reports, exploring datasets, and sharing trusted results easily.
3. Legacy data warehouse costs make it harder to invest in strategy.
Like other on-prem systems, data warehouses adhere to the old-school model of paying for technology, with the associated hardware and licensing costs and ongoing systems engineering.
This kind of inefficient architecture drives more inefficiency. When the business is moving toward becoming data-driven, they’ll continue to ask your team for more data. But responding to those needs means you’ll run out of money pretty quickly.
Cloud offers much more cost flexibility, meaning you’re not paying for, or managing, the entire underlying infrastructure stack. Of course, it’s possible to simply port an inefficient legacy architecture into the public cloud.
To avoid that, we like to talk about total cost of ownership (TCO) for data warehouses, because it captures the full picture of how legacy technology costs and business agility aren’t matching up.
Moving to BigQuery isn’t just moving to cloud—it’s moving to a new cost model, where you’re cutting out that underlying infrastructure and systems engineering. You can get more detail on cloud data warehouse TCO comparisons from ESG.
4. A legacy data warehouse can’t flexibly meet business needs.
While overnight data operations used to be the norm, the global opportunities for businesses mean that a data warehouse now has to load streaming and batch data while also supporting simultaneous queries. Hardware is the main constraint for legacy systems as they struggle to keep up.
Moving your existing architecture into the cloud usually means moving your existing issues into the cloud, and we hear from businesses that doing so still doesn’t allow for real-time streaming.
That’s a key component for data analysts and users. Using a platform like BigQuery means you’re essentially moving your computational capabilities into the data warehouse itself, so it scales as more and more users are accessing analytics.
Unlimited compute is a pretty good way to help your business become digital. Instead of playing catch-up with user requests, you can focus on developing new features. Cloud brings added security, too, with cloud data warehouses able to do things like automatically replicate, restore and back up data, and offer ways to classify and redact sensitive data.
5. Legacy data warehouses lack built-in, mature predictive analytics solutions.
Legacy data warehouses are usually struggling to keep up with daily data needs, like providing reports to departments like finance or sales. It can be hard to imagine having the time and resources to start doing predictive analytics when provisioning and compute limits are holding your teams back.
We hear from customers that many of them are tasked with simplifying infrastructure and adding modern capabilities like AI, ML and self-service analytics for business users.
The best stories about digital transformation are those where the technology changes and business or cultural changes happen at the same time. One customer told us that because BigQuery uses a familiar SQL interface, they were actually able to shift the work of data analytics away from a small, overworked group of data scientists into the hands of many more workers.
Doing so also eliminated a lot of the siloed data lakes that had sprung up as data scientists extracted data one project at a time into various repositories to train ML models.
These large-scale computational possibilities save time and overhead, but also let businesses explore new avenues of growth. AI and ML are already changing the face of industries like retail, where predictive analytics can provide forecasting and other tasks to help the business make better decisions. BigQuery lets you take on sophisticated machine learning tasks without moving data or using a third-party tool.
We designed BigQuery so that our engineers deploy the resources needed for you to scale. It means your focus can change entirely toward meeting the needs the business has put forth, and bringing a lot more flexibility.
BigQuery is fully serverless and runs on underlying Google infrastructure, so it integrates with our ecosystem of data and analytics partner tools. This architecture means you’re continually getting the most up-to-date software stack—analytics that scale, real-time insights, and cutting-edge functionality that includes geospatial and machine learning right from the SQL interface.
Streamline your path to data warehouse modernization with BigQuery by learning about Google Cloud’s proven migration methodology and get started with your data warehouse by applying for our migration offer.
Qlik and Google Cloud Combo: Extending Integration of SAP Data on BigQuery
5475
Of your peers have already read this article.
2:00 Minutes
The most insightful time you'll spend today!
If your organization is one of the 52% of SAP customers whose top analytics pain point is data integration1, Google Cloud has got you covered. By working with partners like Qlik, we are expanding our integration options and bringing real-time replication capability for SAP to BigQuery.
Integrated data for accelerated insights
BigQuery—our fully managed, enterprise data warehouse that can scale up to petabytes on demand and execute queries in seconds—allows SAP customers to consolidate enterprise data silos and confidently derive more use and value from their data. Customers can accelerate and simplify the delivery of SAP data on BigQuery with the latest Qlik Data Integration platform offering for Google Cloud which allows data integration using an automated, near real-time data pipeline through Qlik Replicate, whether data originates from legacy SAP environments, SAP HANA, or SAP application servers. Additionally, Qlik Compose for Data Warehouses can be used to easily generate and automate logical data models from SAP directly in BigQuery freeing up more time for data analysts to leverage advanced built-in capabilities such as BigQuery ML to derive greater value and insights using standard SQL without the need for advanced programming expertise.
Delivering faster results with real-time
Traditional extract-transform-load (ETL) solutions operate on a batch basis, pulling data sets from SAP daily, hourly, or every minute. These tools often require manual mapping of multiple data fields so that data flows accurately. Given SAP’s highly complex table relationships, in which a single transaction can result in multiple changes, this can be a time consuming and tedious process. ETL can also increase the burden on your SAP systems.
Qlik Replicate simplifies this with its intuitive user interface where you can set up real-time data replication between SAP and BigQuery, eliminating the need for manual coding. And, to prevent system overhead, as soon as a new transaction is entered into SAP, the resulting data is replicated into BigQuery in a process known as change data capture (CDC) from SAP’s log layer. This means that data transfer can benefit from high performance with minimal impact on the source system’s resources. Read our latest white paper to learn how to extract SAP data into BigQuery leveraging Qlik Replicate.
Solution expertise for all core SAP workloads
It doesn’t matter what database your SAP system runs on, Qlik Replicate supports all core SAP systems. It automates real-time data replication and decodes SAP’s complex, application-specific data structures into formats that flow smoothly into BigQuery. This ensures that anyone who depends on data analytics has the most current and relevant SAP data they need. For its robust solution capabilities Qlik has received a new “SAP on Google Cloud Expertise” designation for supporting:
- Fast onboarding and accelerated replication of SAP data into Google Cloud
- Real-time and continuous data replication from SAP applications to BigQuery
- Support for all core SAP modules and a broad set of data sources
- Automated data integration, which cuts resource requirements for initial delivery and ongoing maintenance
Proven customer results
Many SAP customers have experienced the benefits of leveraging Qlik alongside BigQuery for data analytics and AI at scale, including German luxury department store chain Breuninger. In order to meet its customers’ growing and changing expectations,Breuninger needed to accelerate its time to insight from data sources across a highly dispersed landscape of on-premises databases and systems, including SAP. The company uses Qlik Replicate to feed corporate data from modules in its SAP system into BigQuery and integrate its varying on-premises databases with the Google Cloud environment. This has yielded game-changing, real-time customer insights for the retailer.
What could your business do with faster, more integrated insights? Learn more about BigQuery for SAP customers and also how Qlik and Google Cloud can help you modernize and automate data integration and analytics.
Carbon Health: Transforming outcomes with Connected Sheets for Looker

3118
Of your peers have already read this article.
2:30 Minutes
The most insightful time you'll spend today!
Everyone wants affordable, quality healthcare but not everyone has it. A 2021 report by the Commonwealth Fund ranked the U.S. in last place among 11 high-income countries in healthcare access.1 Carbon Health is working to change that. We are doing so by combining the best of virtual care, in-person visits, and technology to support patients with their everyday physical and mental health needs.
Rethinking how data and analytics are accessed at Carbon Health
Delivering premium healthcare for the masses that’s accessible and affordable is an ambitious undertaking. It requires a commitment to operating the business in an efficient and disciplined way. To meet our goals, our teams across the company require detailed, daily insights into operating results.
In the last year, we realized our existing BI platform was inaccessible to most of our employees outside of R&D. Creating the analytics, dashboards, and reports needed by our clinic leaders and executives required direct help from our data scientists.
However, this has all changed since deploying Looker as our new BI platform. We initially used Looker to build tables, charts, and graphs that improved how people could access and analyze data about our operating efficiency. As we continued to evaluate how our data and analytics should be experienced by our in-clinic staff, we learned about Connected Sheets for Looker, which has unlocked an entirely new way of sharing insights across the company.
A new way to deliver performance reporting and drive results
Connected Sheets for Looker gives Carbon Health employees who work in Google Sheets—practically everyone—a familiar tool for working with Looker data. For instance, one of our first outputs using the Connected Sheets integration has been a daily and weekly performance push-report for the clinic’s operating leaders, including providers.
Essentially a scorecard, the report tracks the most important KPIs for measuring clinics’ successes, including appointment volume, patient satisfaction such as net promoter score (NPS), reviews, phone call answer rates, and even metrics about billing and collections. To provide easy access, we built a workflow through Google App Script that takes our daily performance report and automatically emails a PDF to key clinic leaders each morning.
Within the first 30 days of the report’s creation, clinic leaders were able to drive noticeable improvements in operating results. For instance, actively tracking clinic volume has enabled us to manage our schedules more effectively, which in turn drives more visits and enables us to better communicate expectations with our patients. Other clinics have dramatically improved their call answer rates by tracking inbound call volume, which has also led to better patient satisfaction.
Greater accountability, greater collaboration
As you can imagine, a report that holds people accountable for outcomes in such a visible way can create some anxiety. We’ve eased those concerns by using the information constructively, with the goal to use reporting as a positive feedback mechanism to bolster open collaboration and identify operational processes that need improvement. For example, data about our call answer rates initiated an investigation that led to an operational redesign of how phones are deployed and managed at more than 120 clinics across the U.S.
Looker as a scalable solution with endless applications
We’re now rolling out Connected Sheets for Looker to deliver performance push-reporting across all teams at Carbon Health. Additionally, we continue to find new ways to leverage Connected Sheets for Looker to meet other needs of the business.
For instance, we’ve recently been able to better understand our software costs by analyzing vendor spend from our accounting systems directly in Google Sheets. Going forward, this will allow us to build a basic workflow to monitor subscription spend and employee application usage, which will lead to us saving money on unnecessary licenses and underutilized software.
We’ve come a long way in the last year. Between Looker and its integration with Google Sheets, we can meet the data needs of all our stakeholders at Carbon Health. Connected Sheets for Looker has been an impactful solution that’s going to help us drive measurable results in how we deliver premium healthcare to the masses.
1. Mirror, Mirror 2021: Reflecting Poorly
2. HEALTHCARE EDITORS’ PICK Meet The Immigrant Entrepreneurs Who Raised $350 Million To Rethink U.S. Primary Care
More Relevant Stories for Your Company

How TapClicks’ Google Cloud Migration Makes Life Easy for Marketers
Editor’s note: In this blog post we learn how TapClicks migrated to Google Cloud to offer their marketing customers a unified platform for data management, operations, insights, and analysis. TapClicks is a smart marketing cloud, powered by data, that unifies our customer’s marketing. By choosing to migrate our core applications last

Spot Slow MySQL Queries Fast with Stackdriver Monitoring
When you’re serving customers online, speed is essential for a good experience. As the amount of data in a database grows, queries that used to be fast can slow down. For example, if a query has to scan every row because a table is missing an index, response times that

Enhancing Data Governance through Automation with Dataplex and BigLake
Unlocking the full potential of data requires breaking down the silo between open-source data formats and data warehouses. At the same time, it is critical to enable data governance team to apply policies regardless of where the data happens, whether - on file or columnar storage. Today, data governance teams

Make Meaningful Analysis with Geo Boundary Public Datasets on BigQuery
Geospatial data is a critical component for a comprehensive analytics strategy. Whether you are trying to visualize data using geospatial parameters or do deeper analysis or modeling on customer distribution or proximity, most organizations have some type of geospatial data they would like to use - whether it be customer
