





Quantum Metric Increases Business 10-fold

9257
Of your peers have already read this article.
5:30 Minutes
The most insightful time you'll spend today!
At Quantum Metric, we’re in the business of bringing our customers business insights that are based on customer experience data and analytics for mid-market and Fortune 500 companies.
Our software, powered by big data, machine intelligence, and Google Cloud, helps our customers identify, quantify, prioritize and measure opportunities to improve digital experiences.
As companies move to a more agile product lifecycle, including continuous deployment and continuous integration, they’re finding that it’s critical to receive perpetual quantified feedback and insights from their data in real time to understand where the largest opportunities exist.
Each year, billions of customer interactions are captured through browsers or mobile apps on PCs, tablets, and mobile devices. This data, fed into the Quantum Metric platform, can show if a customer had a password problem they couldn’t solve or struggled when trying to purchase something and abandoned their cart.
It also can show if the customer tried in vain to complete an online change to their service provider’s subscription, to reach tech support, or couldn’t find the size or color they were looking for while shopping online.
Most importantly, the Quantum Metric platform quantifies the business value of the issue, helping organizations prioritize where they can make the largest impact to their business.
Success overwhelms our initial architecture
Initially, the Quantum Metric experience analytics software ran on a MySQL open source relational database management system (RDBMS). The MySQL RDBMS worked great for simple queries, when there was a specific question to ask of the data.
Soon, though, we knew we needed to offer more advanced data science capabilities. Our bigger customers wanted to ask questions across very large data sets—days, weeks, months, and years worth of data. They wanted to pose iterative questions using complex filters to answer their most challenging business questions.
With more complex queries across more data, response times from our RDBMS went from 100 to 500 milliseconds to as long as 20 minutes.
That delay was slowing down our ability and time to insights, which also reduced the value we could provide to our customers, since iterative exploration and analysis requires real-time query responses. Because of the need for real-time responses, there were certain questions that we just weren’t able to ask of the data. It became clear that we needed a much more robust data warehouse solution.
There were also operational challenges with MySQL and massive-scale data ingestion. We spent a lot of time into the wee hours of the night and morning handling errors and recovering databases.
We tried to address these challenges by sharding, partitioning, and indexing the data to optimize for the types of questions customers were asking. But the problems were escalating and happening more often, from once a month across the customer base to monthly for at least 20 different customers.
We could tune the platform for today and tomorrow’s workload, with good guesses at where indexes could be used, but we simply couldn’t continue to horizontally scale MySQL in a cost-efficient and operationally efficient manner.
Speed breeds innovation
Once we started exploring options that could better scale with our business, we looked at NoSQL technologies like Cassandra (a partitioned row-store database), MySQL’s Column Store (a columnar store database), and Vertica (a columnar store database)—each with unique ways of handling data storage and accessibility.
But with high volumes of complex queries across large data stores, all of these solutions began to fail, bogged down with multiple, simultaneous users. We could have solved the problems with more raw compute and storage, but it would have been prohibitively expensive to run and require a large team to operate.
We then decided to try BigQuery, and it was transformative.
We connected our front end to BigQuery via APIs. Once data is 15 minutes old, it is automatically extracted, loaded, and transformed (ETL) to BigQuery.
We continuously update the legacy MySQL RDBMS so its data is integrated with BigQuery data when queries require real-time data. Most query response times are within 100-200 milliseconds, matching what we initially experienced with MySQL.
When traffic from our customers scales up, we can now scale on-demand to accommodate it, thanks to BigQuery’s hundreds of thousands of CPUs. Our customers no longer run into slow response times, and we’ve gained confidence that we can offer them—and their users—advanced insights and better experiences without delay.
More importantly, with this scale of query power, we were able to build data science algorithms into the platform, which iteratively query BigQuery based on the results, and help quantify the impact of a specific issue to a specific segment of users. Adding these capabilities was possible because of the massive scale of BigQuery.
In addition to new insights and fast response times, we wanted our customers to be able to ask complex questions using very simple language.
For example: “Show me high-loyalty customers, located in specific geographic areas, who visited the web site at least five times, based on specific campaigns, and never booked a seat on a flight.”
This was exactly the kind of query that was used by a major U.S. airline to understand the multi-million dollar impact of a failure affecting their most valuable customers: their high-loyalty members.
And this was all done while maintaining the highest standard of care of customer data and privacy by default, using multiple layers of encryption of data in transit, at rest, and a unique military-grade encryption approach. This approach encrypts PII, including even session cookies, with a RSA-2048 key available only to a select few and used for use cases such as fraud analysis.
It’s no exaggeration to say that BigQuery has totally transformed our business. It provides the petabyte scale and speed we were missing, in addition to taking care of operational maintenance, a task that was burying our team with MySQL.
We’re now able to support some of the largest companies in the world that require real-time, petabyte-scale analytics. That lets them serve more customers faster with higher quality, and take advantage of BigQuery’s power and scale to innovate.
There are other cloud solutions that can address petabyte analytics, but the most unique value proposition of BigQuery was its on-demand scaling and operational management, with extremely cost-effective pay-as-you-go billing. While today we are at a scale where we have round-the-clock querying needs, our early days had very sporadic query loads where we needed instant scale, then a long lull of nothing. The unique business model of BigQuery’s pay-by-bytes-scanned allowed us to have access to a massive-scale querying platform without breaking the bank.
Using BigQuery powers better customer experience and reduces purchasing friction
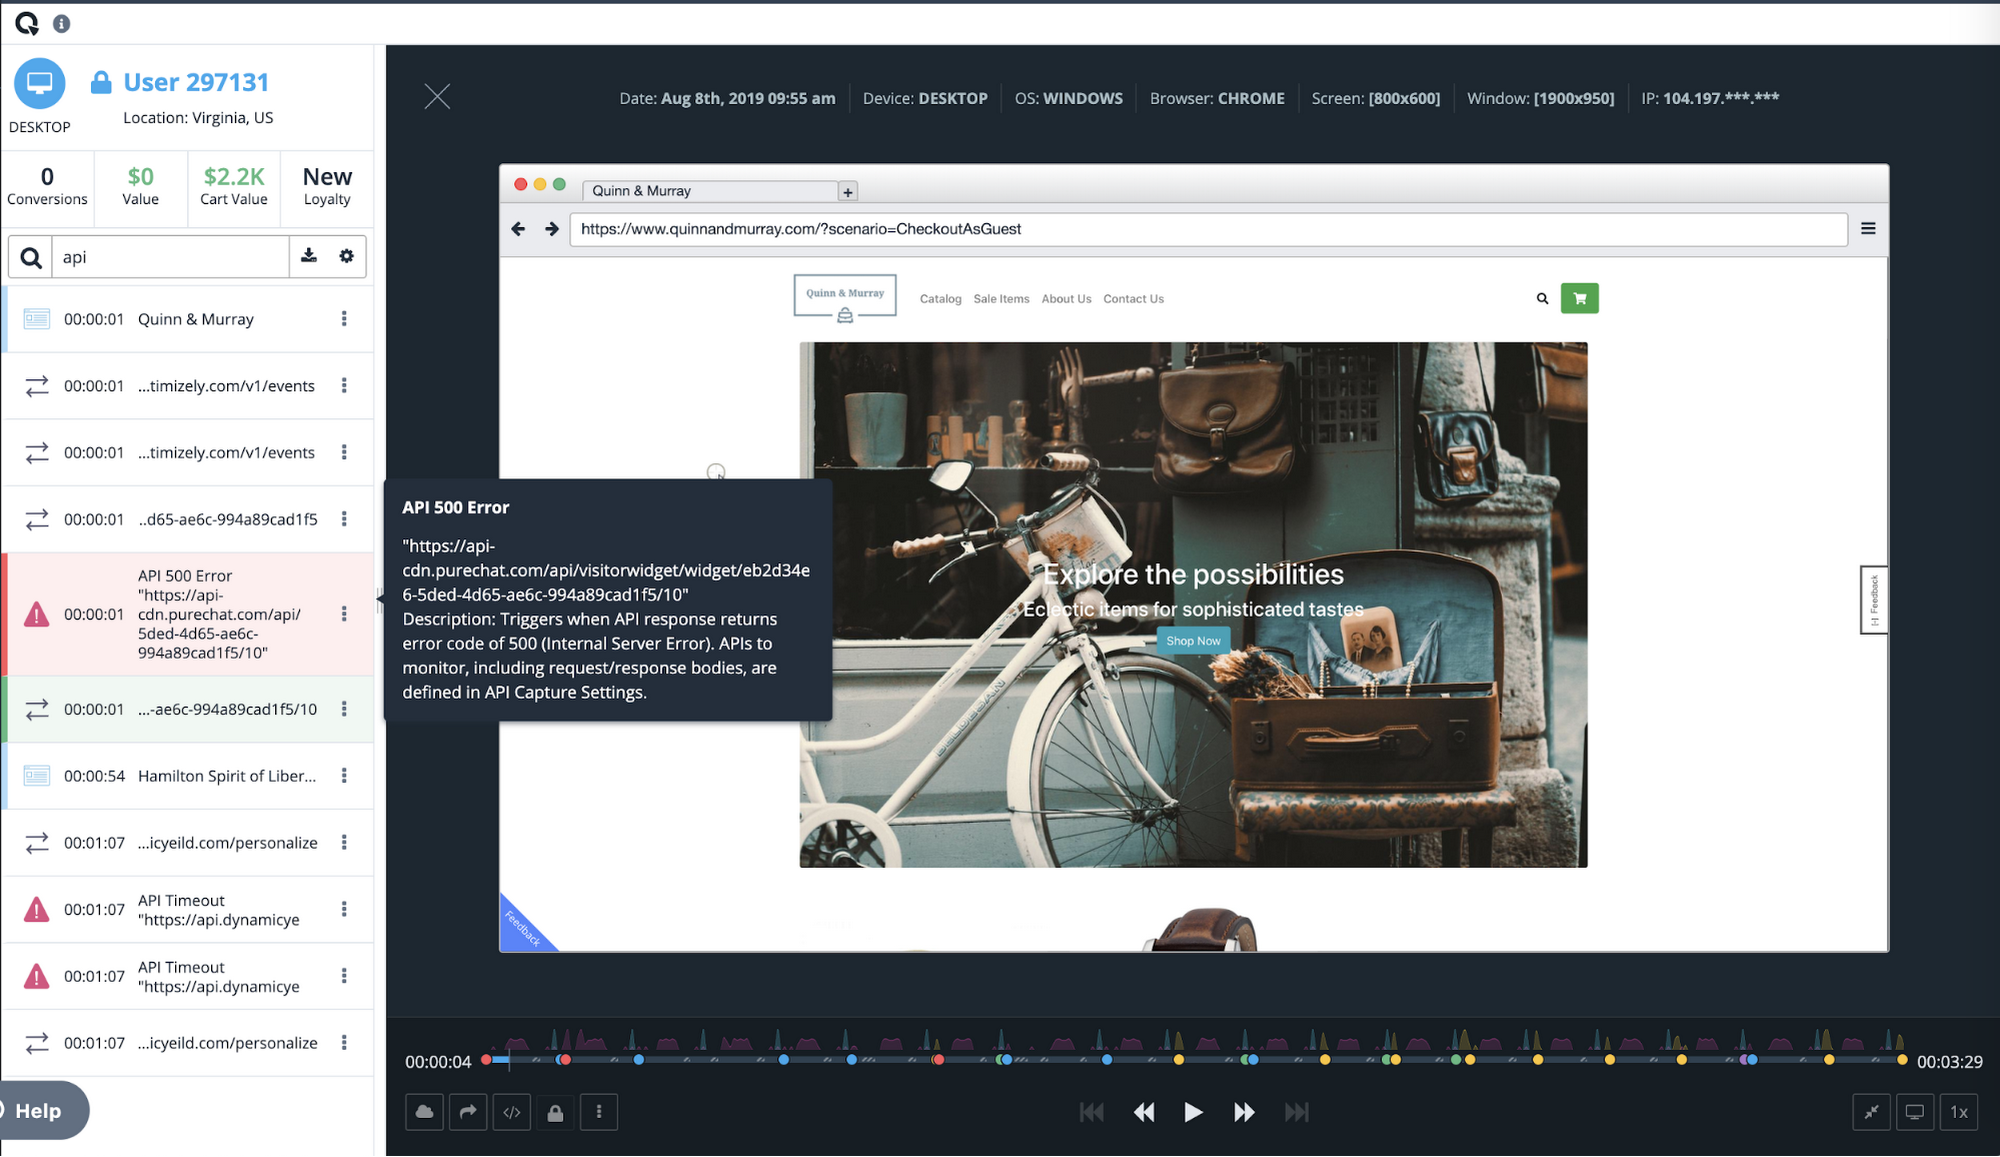
Among the many features of Quantum Metric is the ability to replay online customer sessions. In the example below from a mobile e-commerce site, each action is displayed chronologically. Why did this customer’s transaction fail?
Diving deeper, the session replay shows that the user tried to change the item quantity in the checkout cart, which resulted in a failed API call. Powered by BigQuery, Quantum Metric can then show how many other end users had this issue, with a simple click of “Show More Errors Like This.”
With BigQuery’s massive scale, Quantum Metric will then quantify the impact of that issue, so companies can prioritize which issues need attention immediately. If this is the issue that’s impacting the business the most, our customer can use a single click to open a Jira ticket, forwarding the discovery to their product and engineering teams. Those teams can then re-engineer the experience in near-real time, addressing the failed API call and cutting out the frustrating time it takes for engineers to reproduce the issue.
Once we had a powerful back end in BigQuery, we realized that Quantum Metric’s platform could be used to ask complex questions from vast datasets. We built some of the processes that data scientists use to formulate those queries right into our product.
For example, we added one series of processes to our platform to help customers understand whether a suspect issue is really impacting end-user experience. Is it something that should be prioritized and fixed? Does this really affect the user experience? Does it have financial impact? These and other questions can be pre-defined as a complex query in Quantum Metric to let our customer quickly gain insight on how an issue is impacting the business. Customers were blown away when they heard this was possible. It was the holy grail for what they were looking for in data science. It really sets us apart from our competition.
Today, with every company heavily dependent on data, those companies that can uncover and act on insights fastest are the ones that will succeed. BigQuery gives us the data warehouse platform we need to provide our customers with fast, reliable technology tools. It frees us from having to deal with the minutiae of technology infrastructure operations, so we can focus on finding and extracting the magic in customer data. With the power and scale of BigQuery, combined with the real-time capture of every user experience with 100% fidelity, we’re able to offer a self-service analytics platform that provides insights into digital journey friction points and acts as the indisputable arbitrator of truth.
Unlocking Data Value: Latest Data Platforms and Announcements at the Next 21

6415
Of your peers have already read this article.
3:30 Minutes
The most insightful time you'll spend today!
Today at Google Cloud Next we are announcing innovations that will enable data teams to simplify how they work with data and derive value from it faster. These new solutions will help organizations build modern data architectures with real-time analytics to power innovative, mission-critical, data-driven applications.
Too often, even the best minds in data are constrained by ineffective systems and technologies. A recent study showed that only 32% of companies surveyed gained value from their data investments. Previous approaches have resulted in difficult to access, slow, unreliable, complex, and fragmented systems.
At Google Cloud, we are committed to changing this reality by helping customers simplify their approach to data to build their data clouds. Google Cloud’s data platform is simply unmatched for speed, scale, security, and reliability for any size organization with built-in, industry-leading machine learning (ML) and artificial intelligence (AI), and an open standards-based approach.
Vertex AI and data platform services unlock rapid ML modeling
With the launch of Vertex AI in May 2021, we empowered data scientists and engineers to build reliable, standardized AI pipelines that take advantage of the power of Google Cloud’s data pipelines. Today, we are taking this a step further with the launch of Vertex AI Workbench, a unified user experience to build and deploy ML models faster, accelerating time-to-value for data scientists and their organizations. We’ve integrated data engineering capabilities directly into the data science environment, which lets you ingest and analyze data, and deploy and manage ML models, all from a single interface.
Data scientists can now build and train models 5X faster on Vertex AI than on traditional notebooks. This is primarily enabled by integrations across data services (like Dataproc, BigQuery, Dataplex, and Looker), which significantly reduce context switching. The unified experience of Vertex AI let’s data scientists coordinate, transform, secure and monitor Machine Learning Operations (MLOps) from within a single interface, for their long-running, self-improving, and safely-managed AI services.
“As per IDC’s AI StrategiesView 2021, model development duration, scalable deployment, and model management are three of the top five challenges in scaling AI initiatives,” said Ritu Jyoti, Group Vice President, AI and Automation Research Practice at IDC. “Vertex AI Workbench provides a collaborative development environment for the entire ML workflow – connecting data services such as BigQuery and Spark on Google Cloud, to Vertex AI and MLOps services. As such, data scientists and engineers will be able to deploy and manage more models, more easily and quickly, from within one interface.”
Ecommerce company, Wayfair, has transformed its merchandising capabilities with data and AI services. “At Wayfair, data is at the center of our business. With more than 22 million products from more than 16,000 suppliers, the process of helping customers find the exact right item for their needs across our vast ecosystem presents exciting challenges,” said Matt Ferrari, Head of Ad Tech, Customer Intelligence, and Machine Learning; Engineering and Product at Wayfair. “From managing our online catalog and inventory, to building a strong logistics network, to making it easier to share product data with suppliers, we rely on services including BigQuery to ensure that we are able to access high-performance, low-maintenance data at scale. Vertex AI Workbench and Vertex AI Training accelerate our adoption of highly scalable model development and training capabilities.”
BigQuery Omni: Breaking data silos with cross-cloud analytics and governance
Businesses across a variety of industries are choosing Google Cloud to develop their data cloud strategies and better predict business outcomes — BigQuery is a key part of that solution portfolio. To address complex data management across hybrid and multicloud environments, this month we are announcing the general availability of BigQuery Omni, which allows customers to analyze data across Google Cloud, AWS, and Azure. Healthcare provider, Johnson and Johnson was able to combine data in Google Cloud and AWS S3 with BigQuery Omni without needing data to migrate.
This flexible, fully-managed, cross-cloud analytics solution allows you to cost-effectively and securely answer questions and share results from a single pane of glass across your datasets, wherever you are. In addition to these multicloud capabilities, Dataplex will be generally available this quarter to provide an intelligent data fabric that enables you to keep your data distributed while making it securely accessible to all your analytics tools.
Spark on Google Cloud simplifies data engineering
To help make data engineering even easier, we are announcing the general availability of Spark on Google Cloud, the world’s first autoscaling and serverless Spark service for the Google Cloud data platform. This allows data engineers, data scientists, and data analysts to use Spark from their preferred interfaces without data replication or custom integrations. Using this capability, developers can write applications and pipelines that autoscale without any manual infrastructure provisioning or tuning. This new service makes Spark a first class citizen on Google Cloud, and enables customers to get started in seconds and scale infinitely, regardless if you start in BigQuery, Dataproc, Dataplex, or Vertex AI.
Spanner meets PostgreSQL: global, relational scale with a popular interface
We’re continuing to make Cloud Spanner, our fully managed, globally scalable, relational database, available to more customers now with a PostgreSQL interface, now in preview. With this new PostgreSQL interface, enterprises can take advantage of Spanner’s unmatched global scale, 99.999% availability, and strong consistency using skills and tools from the popular PostgreSQL ecosystem.
This interface supports Spanner’s rich feature set that uses the most popular PostgreSQL data types and SQL features to reduce the barrier to entry for building transformational applications. Using the tools and skills they already have, developer teams gain flexibility and peace of mind because the schemas and queries they build against the PostgreSQL interface can be easily ported to another Postgres environment. Complete this form to request access to the preview.
Our commitment to the PostgreSQL ecosystem has been long standing. Customers choose Cloud SQL for the flexibility to run PostgreSQL, MySQL and SQL Server workloads. Cloud SQL provides a rich extension collection, configuration flags, and open ecosystem, without the hassle of database provisioning, storage capacity management, or other time-consuming tasks.
Auto Trader has migrated approximately 65% of their Oracle footprint to Cloud SQL, which remains a strategic priority for the company. Using Cloud SQL, BigQuery, and Looker to facilitate access to data for their users, and with Cloud SQL’s fully managed services, Auto Trader’s release cadence has improved by over 140% (year-over-year), enabling an impressive peak of 458 releases to production in a single day.
Looker integrations make augmented analytics a reality
We are announcing a new integration between Tableau and Looker that will allow customers to operationalize analytics and more effectively scale their deployments with trusted, real-time data, and less maintenance for developers and administrators. Tableau customers will soon be able to leverage Looker’s semantic model, enabling new levels of data governance while democratizing access to data. They will also be able to pair their enterprise semantic layer with Tableau’s leading analytics platform. The future might be uncertain, but together with our partners we can help you plan for it.
We remain committed to developing new ways to help organizations go beyond traditional business intelligence with Looker. In addition to innovating within Looker, we’re continuing to integrate within other parts of Google Cloud. Today, we are sharing new ways to help customers deliver trusted data experiences and leverage augmented analytics to take intelligent action.
First, we’re enabling you to democratize access to trusted data in tools where you are already familiar. Connected Sheets already allows you to interactively explore BigQuery data in a familiar spreadsheet interface and will soon be able to leverage the governed data and business metrics in Looker’s semantic model. It will be available in preview by the end of this year.
Another integration we’re announcing is Looker’s Solution for Contact Center AI, which helps you gain a deeper understanding and appreciation of your customers’ full journey by unlocking insights from all of your company’s first-party data, such as contextualizing support calls to make sure your most valuable customers receive the best service.
We’re also sharing the new Looker Block for Healthcare NLP API, which provides simplified access to intelligent insights from unstructured medical text. Compatible with Fast Healthcare Interoperability Resources (FHIR), healthcare providers, payers, and pharma companies can quickly understand the context and relationships of medical concepts within the text, and in turn, can begin to link this to other clinical data sources for additional AI and ML actions.
Bringing the best of Google together with Google Earth Engine and Google Cloud
We are thrilled to announce the preview of Google Earth Engine on Google Cloud. This launch makes Google Earth Engine’s 50+ petabyte catalog of satellite imagery and geospatial data sets available for planetary-scale analysis. Google Cloud customers will be able to integrate Earth Engine with BigQuery, Google Cloud’s ML technologies, and Google Maps Platform. This gives data teams a way to better understand how the world is changing and what actions they can take — from sustainable sourcing, to saving energy and materials costs, to understanding business risks, to serving new customer needs.
For over a decade, Earth Engine has supported the work of researchers and NGOs from around the world, and this new integration brings the best of Google and Google Cloud together to empower enterprises to create a sustainable future for our planet and for your business.
At Google Cloud, we are deeply grateful to work with companies of all sizes, and across industries, to build their data clouds. Join my keynote session to hear how organizations are leveraging the full power of data, from databases to analytics that support decision making to AI and ML that predict and automate the future. We’ll also highlight our latest product innovations for BigQuery, Spanner, Looker, and Vertex AI.
I can’t wait to hear how you will turn data into intelligence and look forward to connecting with you.

7992
Of your peers have already downloaded this article
20:30 Minutes
The most insightful time you'll spend today!
These business and technology innovators are leveraging cloud computing, machine learning, APIs, collaborative platforms, among others to advance healthcare, financial services, retail, media and entertainment, manufacturing, and government.
They include some of the biggest brands in the world, as well as some you’ve probably never heard of. But they all have one thing in common: They are astounding in their idea, scope and execution.
Every story has a short–and a longer–version. Scan through them and choose to dive deeper into stories that reflect challenges that your company or your industry is facing. You’ll find solutions to problems you previously thought impossible to solve.

6793
Of your peers have already downloaded this article
3:08 Minutes
The most insightful time you'll spend today!
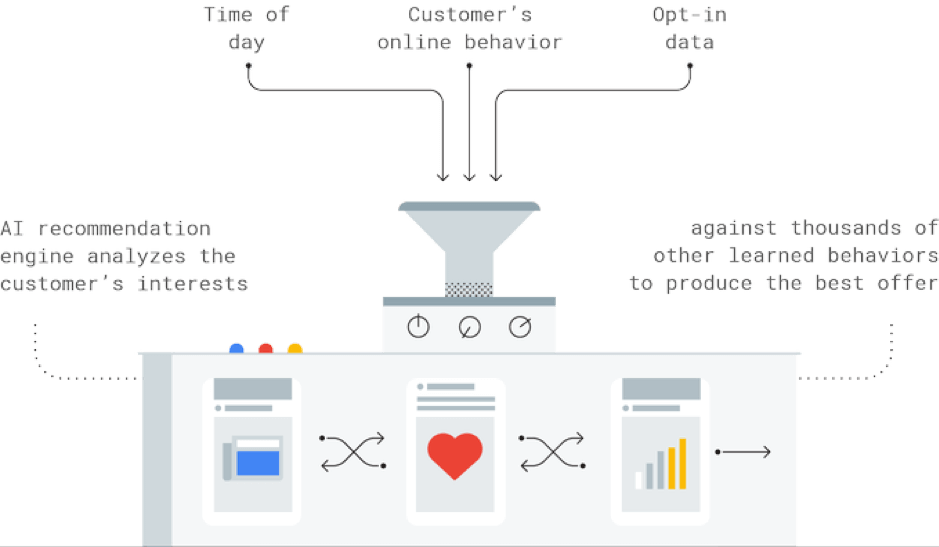
Reach the Right Customers
How can AI help you target customers who are looking for products like yours?
The challenge: This customer wants to buy the best cat food for her pets.

How AI Works
The Result
A targeted offer for a discount on luxury cat food is shown to the customer.

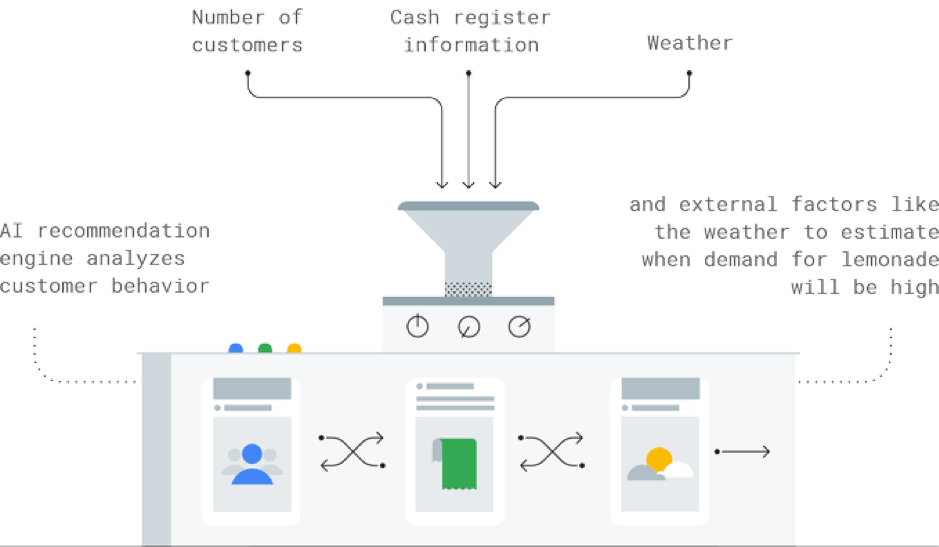
Predict What Customers Want
How can AI help you stay one step ahead when customer demand is uncertain?
The challenge: This lemonade seller isn’t sure how much lemonade he’ll need in the week ahead.

How AI Works
The Result
The seller makes just the right amount of lemonade to satisfy his customers and earn a juicy profit.

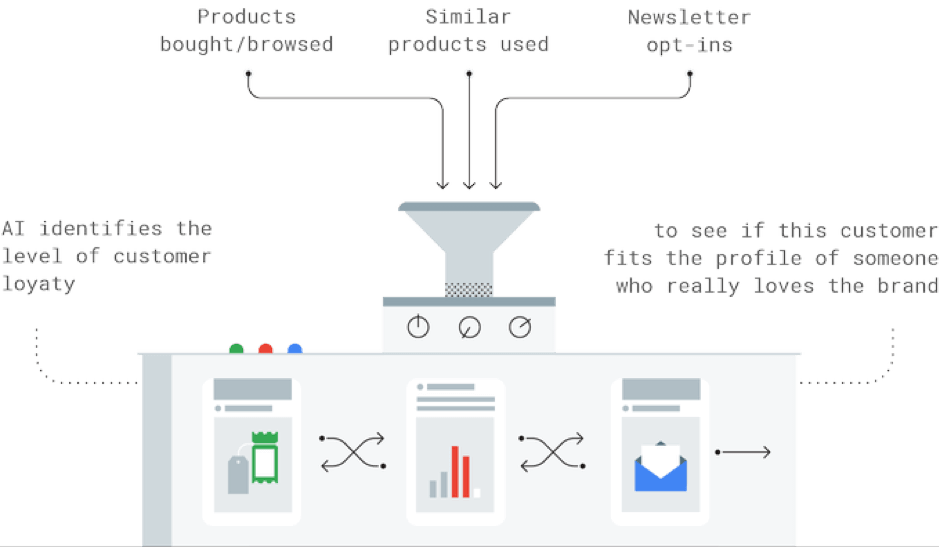
Keep Your Customers
Your next job is retaining your customers. How can AI deliver campaigns that drive loyalty?
The challenge: This customer has bought products from a fitness brand. But can that brand ensure she becomes a loyal fan?

How AI Works
The Result
The brand delivers personalized offers that entice the customer to add to her sportswear collection — at exclusive discounts, too.

Principles to Make Organizations Data Engineering Driven

4842
Of your peers have already read this article.
4:00 Minutes
The most insightful time you'll spend today!
In the “What type of data processing organisation” paper, we examined that you can build a data culture whether your organization consists mostly of data analysts, or data engineers, or data scientists. However, the path and technologies to become a data-driven innovator are different and success comes from implementing the right tech in a way that matches a company’s culture. In this blog we will expand the data engineering driven organizations and provide how it can be built from the first principles.
Not all organizations are alike. All companies have similar functions (sales, engineering, marketing), but not all functions have the same influence on the overall business decisions. Some companies are more engineering-driven, others are sales-driven, others are marketing-driven. In practice, all companies are a mixture of all these functions. In the same way, the data strategy can be more focused on data analysts, and others on data engineering. Culture is a combination of several factors, business requirements, organizational culture, and skills within the organization.
Traditionally organizations that focused on engineering mainly came from technology driven digital backgrounds. They built their own frameworks or used programming frameworks to build repeatable data pipelines. Some of this is due to the way the data is received, the shape the data is received and the speed of the data arrival as well. If your data allows it, your organization can be more focused on data analysis, and not so much on data engineering. If you can apply an Extract-Load-Transform approach (ELT) rather than the classic Extract-Transform-Load (ETL), then you can focus on data analysis and might not need extensive data engineering capability. For example, data that can be loaded directly into the data warehouse allows data analysts to also do data engineering work and apply transformations to the data.
This does not happen so often though. Sometimes your data is messy, inconsistent, bulky, and encoded in legacy file formats or as part of legacy databases or systems, with a little potential to be actionable by data analysts.
Or maybe you need to process data in streaming, applying complex event processing to obtain competitive insights in near real time. The value of data decays exponentially with time. Most companies can process data by the next day in batch mode. However, not so many are probably obtaining such knowledge the next second data is produced.
In these situations, you need the talent to unveil the insights hidden in that amalgam of data, either messy or fast changing (or both!). And almost as importantly, you need the right tools and systems to enable that talent too.
What are those right tools? Cloud provides the scalability and flexibility for data workloads that are required in such complex situations. Long gone are the times when data teams had to beg for the resources that were required to have an impact in the business. Data processing systems are no longer scarce, so your data strategy should not generate that scarcity artificially.
In this article, we explain how to leverage Google Cloud to enable data teams to do complex processing of data, in batch and streaming. By doing so, your data engineering and science teams can have an impact when (in seconds) after the input data is generated.
Data engineering driven organizations
When the complexity of your data transformation needs is high, data engineers have a central role in the data strategy of your company, leading to data engineering driven organization. In this type of organization, data architectures are organized in three layers: business data owners, data engineers, and data consumers.
Data engineers are at the crossroads between data owners and data consumers, with clear responsibilities:
- Transporting data, enriching data whilst building integrations between analytical systems and operational systems ( as in the real time use cases)
- Parsing and transforming messy data coming from business units into meaningful and clean data, with documented metadata
- Applying DataOps, that is, functional knowledge of the business plus software engineering methodologies applied to the data lifecycle
- Deployment of models and other artifacts analyzing or consuming data
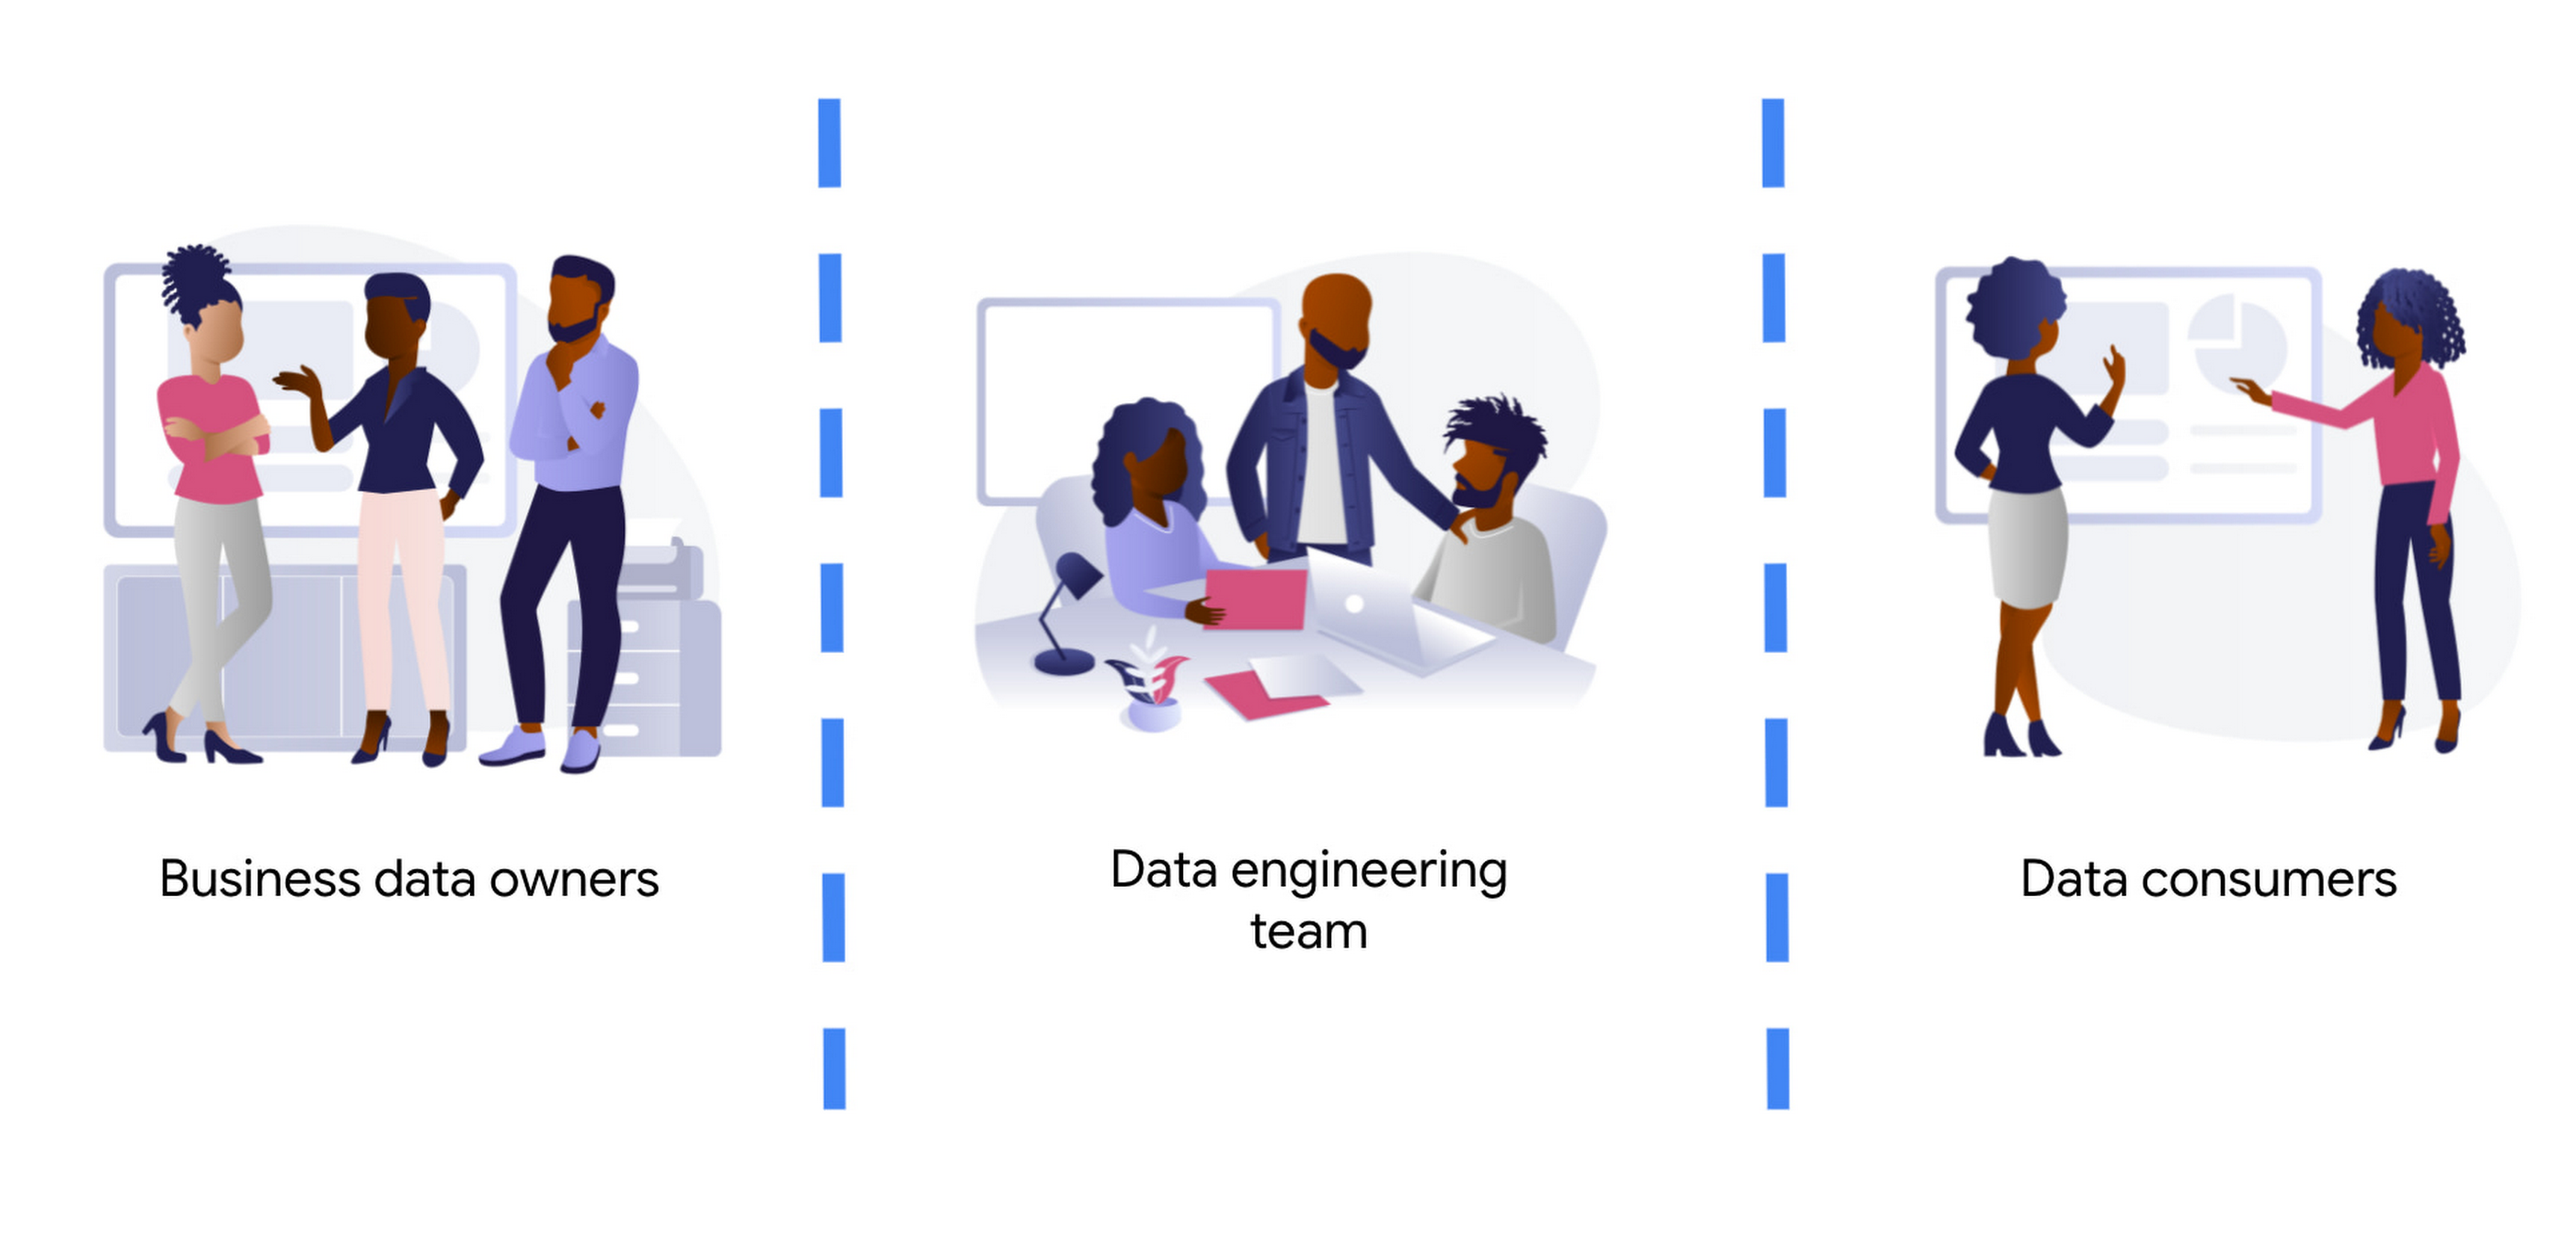
Business data owners are cross-functional domain-oriented teams. These teams know the business in detail, and are the source of data that feeds the data architecture. Sometimes these business units may also have some data-specific roles, such as data analysts, data engineers, or data scientists, to work as interfaces with the rest of the layers. For instance, these teams may design a business data owner, that is the point of contact of a business unit in everything that is related to the data produced by the unit.
At the other end of the architecture, we find the data consumers. Again, also cross-functional, but more focused on extracting insights from the different data available in the architecture. Here we typically find data science teams, data analysts, business intelligence teams, etc. These groups sometimes combine data from different business units, and produce artifacts (machine learning models, interactive dashboards, reports, and so on). For deployment, they require the help of the data engineering team so that data is consistent and trusted.
At the center of these crossroads, we find the data engineering team. Data engineers are responsible for making sure that the data generated and needed by different business units gets ingested into the architecture. This job requires two disparate skills: functional knowledge and data engineering/software development skills. This is often coined under the term DataOps (which evolved from DevOps methodologies developed within the past decades but applied to data engineering practices).
Data engineers have another responsibility too. They must help in the deployment of artifacts produced by the data consumers. Typically, the data consumers do not have the deep technical skills and knowledge to take the sole responsibility for deployment of their artifacts.This is also true for highly sophisticated data science teams. So data engineers must add other skills under their belt: machine learning and business intelligence platform knowledge. Let’s clarify this point, we don’t expect data engineers to become machine learning engineers. Data engineers need to understand ML to ensure that the data delivered to the first layer of a model ( the input ) is correct. They will also become key when delivering that first layer of data in the inference path, as here the data engineering skills around scale / HA etc really need to shine.
By taking the responsibility of parsing and transforming messy data from various business units, or for ingesting in real time, data engineers allow the data consumers to focus on creating value. Data science and other types of data consumers are abstracted away from data encodings, large files, legacy systems, complex message queue configurations for streaming. The benefits of concentrating that knowledge in a highly skilled data engineering team are clear, notwithstanding that other teams (business units and consumers) may also have their data engineers to work as interfaces with other teams. More recently, we even see squads created with members of the business units (data product owners), data engineers, data scientists, and other roles. Effectively creating complete teams with autonomy and full responsibility over a data stream, from the incoming data down to the data driven decision with impact in the business.
Reference architecture – Serverless
The number of skills required for the data engineering team is vast and diverse. We should not make it harder by expecting the team to maintain the infrastructure where they run data pipelines. They should be focusing on how to cleanse, transform, enrich, and prepare the data rather than how much memory or how many cores their solution may require.
The reference architectures presented here are based on the following principles:
- Serverless no-ops technologies
- Streaming-enabled for low time-to-insight
We present different alternatives, based on different products available in Google Cloud:
- Dataflow, the built-in streaming analytics platform in Google Cloud
- Dataproc, the Google Cloud’s managed platform for Hadoop and Spark.
- Data Fusion, a codeless environment for creating and running data pipelines
Let’s dig into these principles.
By using serverless technology we eliminate the maintenance burden from the data engineering team, and we provide the necessary flexibility and scalability for executing complex and/or large jobs. For example, scalability is essential when planning for traffic spikes during mega Friday for retailers. Using serverless solutions allows retailers to look into how they are performing during the day. They no longer need to worry about resources needed to process massive data generated during the day.
The team needs to have full control and write their own code for the data pipelines because of the type of pipelines that the team develops. This is true either for batch or streaming pipelines. In batch, the parsing requirements can be complex and no off the shelf solution works. In streaming, if the team wants to fully leverage the capabilities of the platform, they should implement all the complex business logic that is required, without artificially simplifying the complexity in exchange for some better latency. They can develop a pipeline that achieves a low latency with highly complex business logic. This again requires the team to start writing code from first principles.
However, that the team needs to write code should not imply that they need to rewrite any existing piece of code. For many input/output systems, we can probably reuse code from patterns, snippets, and similar examples. Moreover, a logical pipeline developed by a data engineering team does not necessarily need to map to a physical pipeline. Some parts of the logic can be easily reused by using technologies like Dataflow templates, and use those templates in orchestration with other custom developed pipelines. This brings the best of both worlds (reuse and rewrite), while saving precious time that can be dedicated to higher impact code rather than common I/O tasks. The reference architecture presented has another important feature: the possibility to transform existing batch pipelines to streaming.
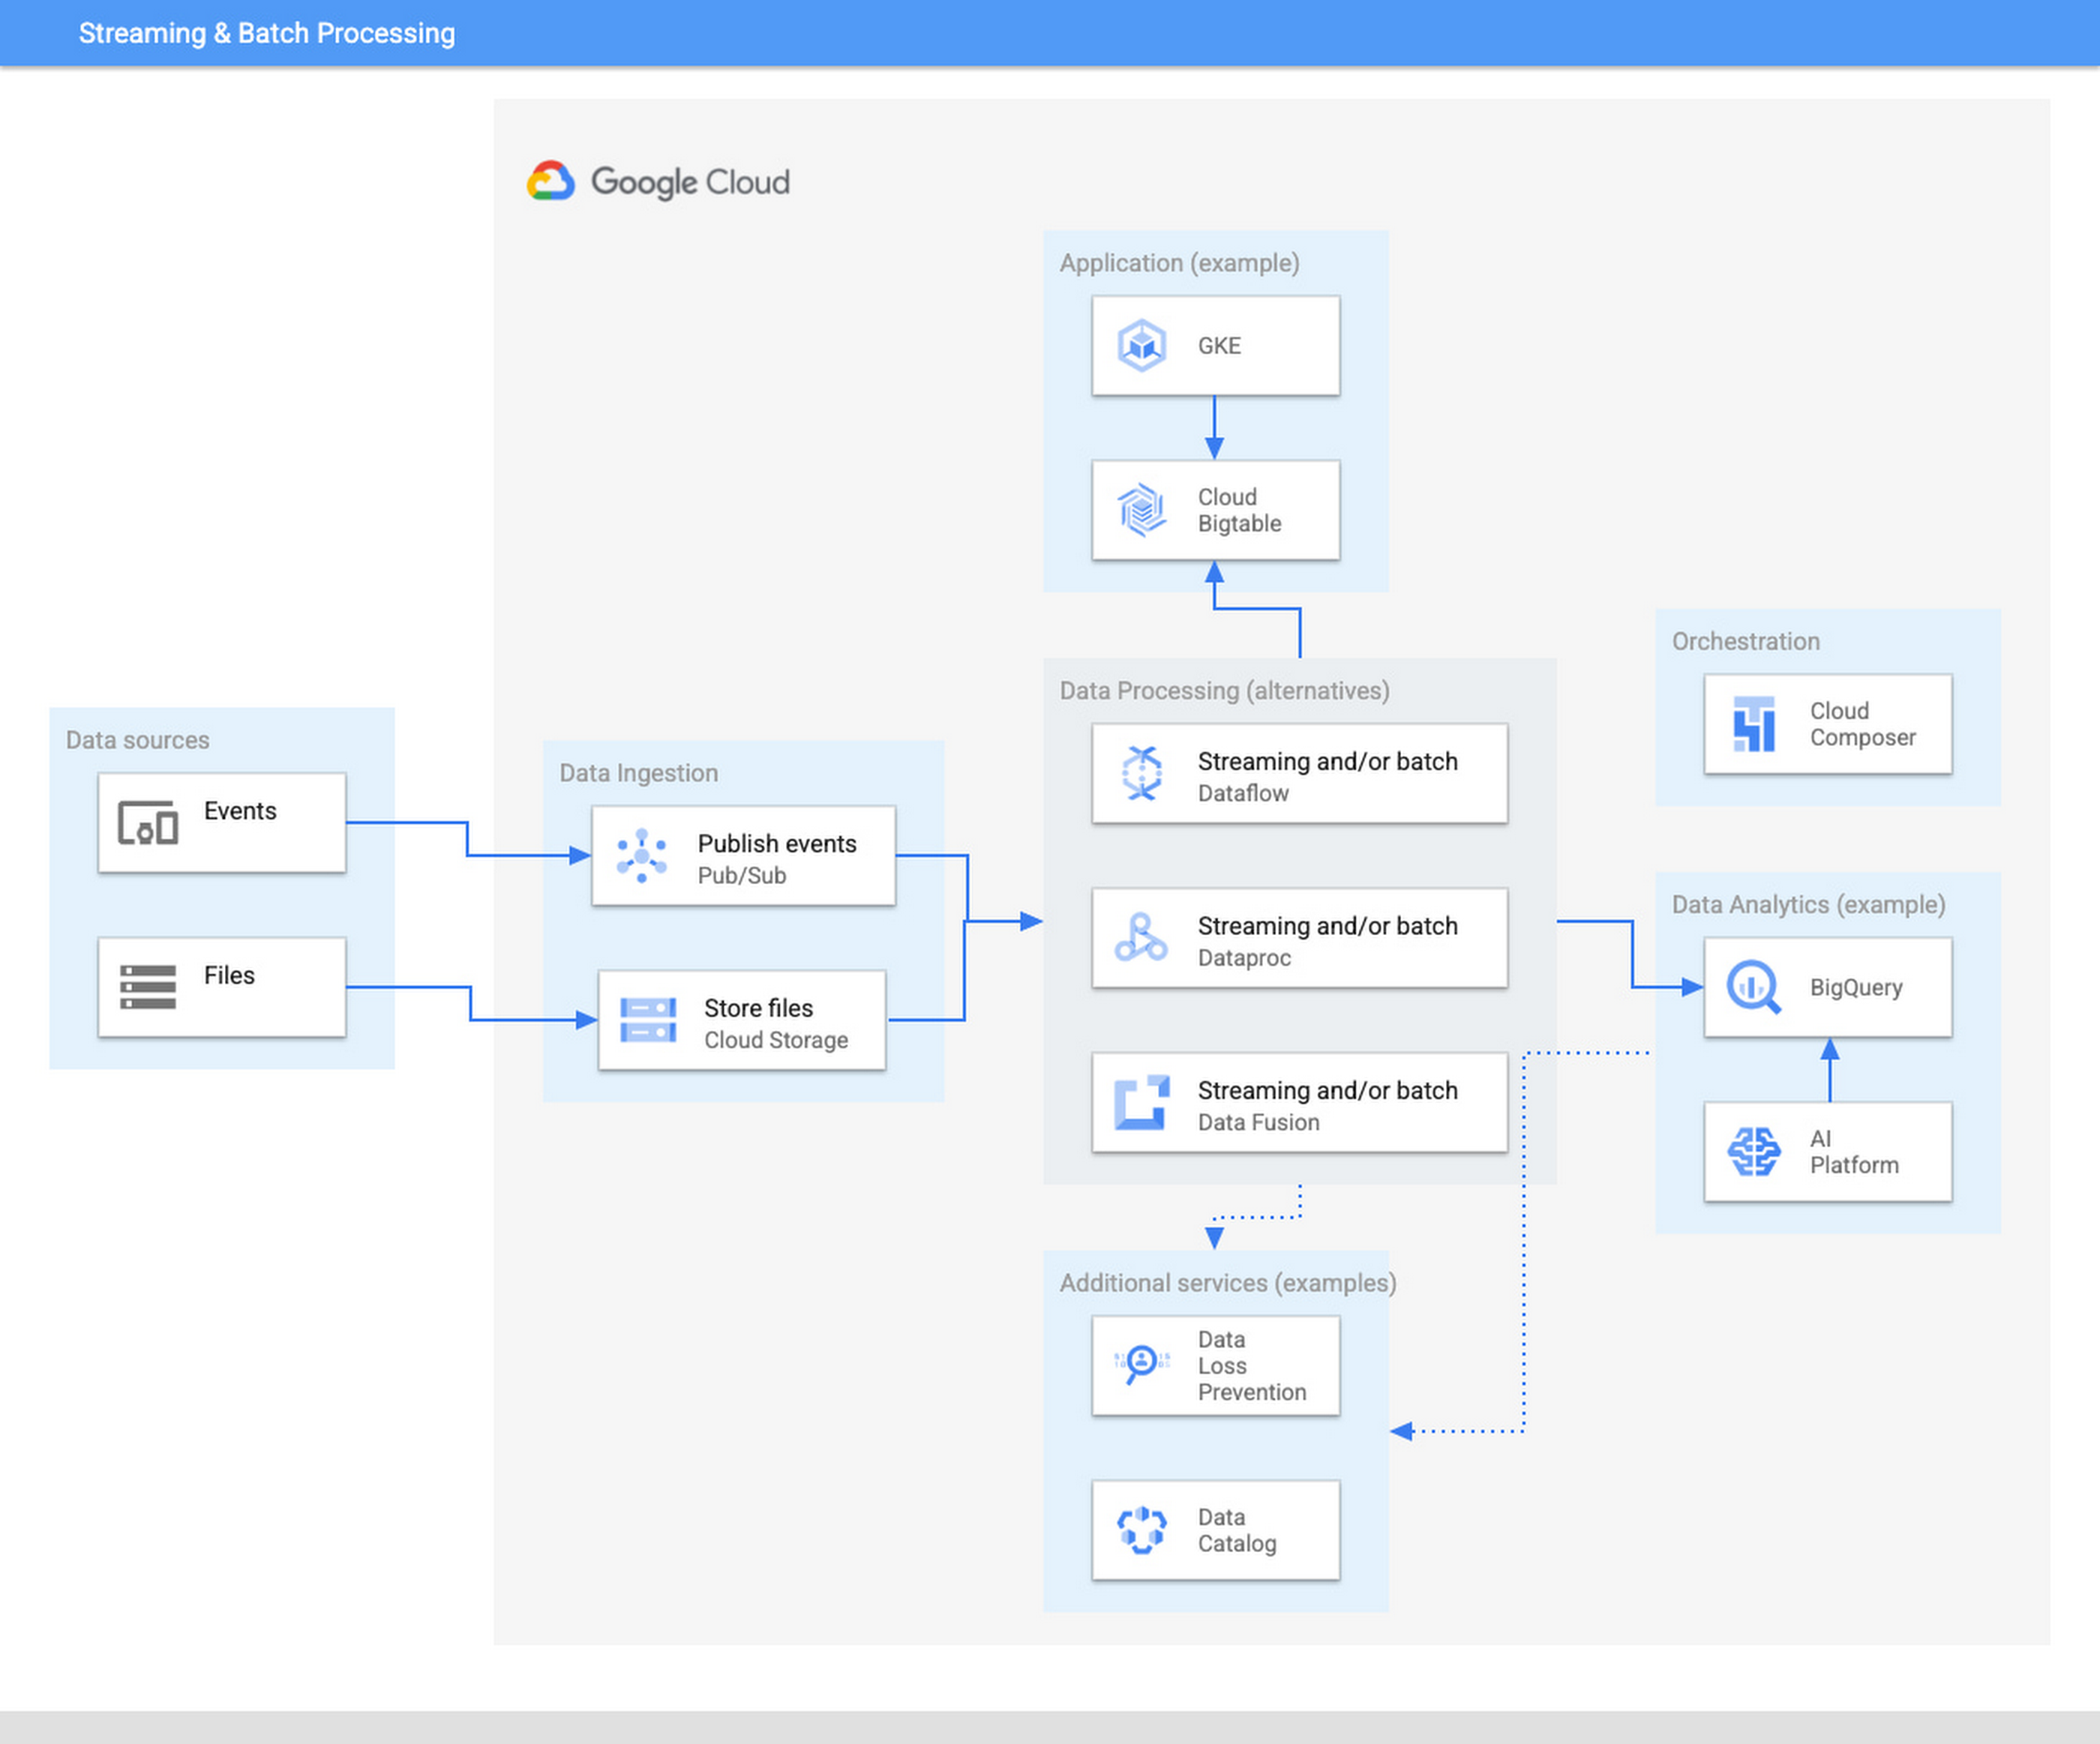
The ingestion layer consists of Pub/Sub for real time and Cloud Storage for batch and does not require any preallocated infrastructure. Both Pub/Sub and Cloud Storage can be used for a range of cases as it can automatically scale up with the input workload.
Once the data has been ingested, our proposed architecture follows the classical division in three stages: Extract, Transform, and Load (ETL). For some types of files, direct ingestion into BigQuery (following an ELT approach) is also possible.
In the transform layer, we primarily recommend Dataflow as the data process component. Dataflow uses Apache Beam as SDK. The main advantage of Apache Beam is the unified model for batch and streaming processing. As mentioned before, the same code can be adapted to run in batch or streaming by adapting input and output. For instance, switching the input from files in Cloud Storage to messages published in a topic in Pub/Sub.
One of the alternatives to Dataflow in this architecture is Dataproc, Google Cloud’s solution for managed Hadoop and Spark clusters. The main use case is for those teams that are migrating to Google Cloud but have large amounts of inherited code in Spark or Hadoop. Dataproc enables a direct path to the cloud, without having to review all those pipelines.
Finally, we also present the alternative of Data Fusion, a codeless environment for creating data pipelines using a drag-and-drop interface. Data Fusion actually uses Dataproc as its Compute Engine, so everything we have mentioned earlier applies also to the case of Data Fusion. If your team prefers to create data pipelines without having to write any code, Data Fusion is the right tool.
So in summary, these are the three recommended components for the transform layer:
- Dataflow, powerful and versatile with a unified model for batch and streaming processing. Straightforward path to move from batch processing to streaming
- Dataproc, for those teams that want to reuse existing code from Hadoop or Spark environments.
- Data Fusion, if your team does not want to write any code.
Challenges and opportunities
Data platforms are complex. Having on top of that data responsibility the duty to maintain infrastructure is a wasteful use of valuable skills and talent. Often data teams end up managing infrastructure rather than focusing on analyzing the data. The architecture presented in this article liberates the data engineering team from having to allocate infrastructure and tweak clusters but instead to focus on providing value through data processing pipelines.
For data engineers to focus on what they do best, you need to fully leverage the cloud. A lift & shift approach from any on-premise installation is not going to provide that flexibility and liberation. You need to leverage serverless technologies. As an added advantage, serverless lets you also scale your data processing capabilities with your needs, and be able to respond to peaks of activity, however large these are.
Serverless technologies sometimes face the doubts of practitioners: will I be locked in with my provider if I fully leverage serverless? This is actually a question that you should be asking when deciding whether to set up your architecture on top of a provider.
The components presented here for data processing are based on open source technologies, and fully interoperable with other open source equivalent components. Dataflow uses Apache Beam, which not only unifies batch and streaming, but also offers a widely compatible runner. You can take your code elsewhere to any other runner. For instance, Apache Flink or Apache Spark. Dataproc is a fully managed Hadoop and Spark based on the vanilla open source components of this ecosystem. Data Fusion is actually the Google Cloud version of CDAP, an open source project.
On the other hand, for the serving layer, BigQuery is based on standard Ansi SQL. Whereas in the case of Bigtable and Google Kubernetes Engine, Bigtable is compatible at API level with HBase, and Kubernetes is an open source component.
In summary, when your components are based on open source, like the ones included in this architecture, serverless does not lock you in. The skills required to encode business logic in the form of data processing pipelines are based on engineering principles that remain stable across time. The same principles apply if you are using Hadoop, Spark, or Dataflow or UI driven ETL tooling. In addition, there are now new capabilities, such as low-latency streaming, that were not available before. A team of data engineers that learn the fundamental principles of data engineering will be able to quickly leverage those additional capabilities.
Our recommended architecture separates the logical level, the code of your applications, from the infrastructure where they run. This enables data engineers to focus on what they do best and on where they provide the highest added value. Let your Dataflow and your engineers impact your business, by adopting the technologies that liberate them and allow them to focus on adding business value. To learn more about building an unified data analytics platform, take a look at our recently published Unified Data Analytics Platform paper and Converging Architectures paper.
5769
Of your peers have already watched this video.
4:50 Minutes
The most insightful time you'll spend today!
Google had Enough of Flooding in India. Here’s What It Did About It
Over the last century, floods have become the most common and deadly natural disaster on the planet.
Many countries currently lack effective early warning systems and alerts. Today, 20 percent of flood fatalities occur in India.
To help, Google sent a team to study the Ghaghara River, near Patna.
“In India, where we’re running our first pilot program, the government has thousands of people who measure water levels, every hour, in rivers across India, with what is effectively very long measuring sticks. They are called stream gauges. This allows them to know whether the river will overflow and flood. But it doesn’t yet allow them to understand exactly what areas are going to be affected, what neighborhoods, or even what villages,” says Sella Nevo, Tech Lead, Google Flood Forecasting.
“The big technical question was: Do we have enough information to try to do forecasting that would be accurate enough to make a difference?” says Yossi Matias, VP of Engineering and Crisis Response Lead, Google.
This is their incredible story. It includes collecting thousands of satellite images and generating hundreds of thousands of simulations of how a river could possibly behave.
More Relevant Stories for Your Company

Accelerating Insights with the Health Analytics Platform
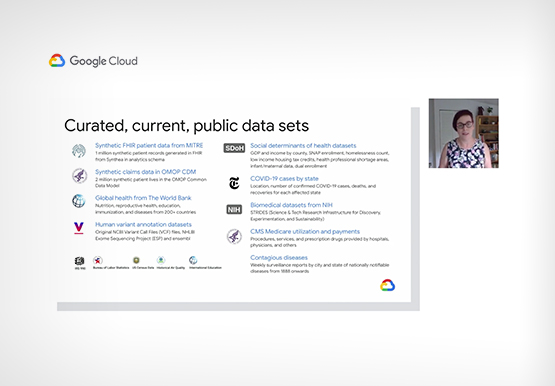
The healthcare industry is beset with a data challenge, specifically clinical data, and challenges around the proliferation of EHR instances and ancillary clinical systems. In this video, Vivian Neilley, Solution Architect, Google Cloud and Marianne Slight, Product Manager, Google Cloud discuss how some of these challenges can be overcome with

Data to Business Outcomes with Google’s Data Analytics Design Pattern
Companies today are inundated with vast amounts of data from various sources. This overwhelming amount of data is meant to benefit the company, but often leaves data teams feeling overwhelmed, which can create data bottlenecks and result in a slow time to value. In fact, only twenty seven percent of

BigQuery Helps Insurance Firms Leverage Previous Storm Data for Better Pricing Insights
It may be surprising to know that U.S. natural catastrophe economic losses totaled $119 billion in 2020, and 75% (or $89.4B) of those economic losses were caused by severe storms and cyclones. In the insurance industry, data is everything. Insurers use data to influence underwriting, rating, pricing, forms, marketing, and

How to Predict the Cost of a Managed Streaming and Batch Analytics Service
The value of streaming analytics comes from the insights a business draws from instantaneous data processing, and the timely responses it can implement to adapt its product or service for a better customer experience. “Instantaneous data insights,” however, is a concept that varies with each use case. Some businesses optimize
