





ML Workflow Made Simple: How to Automate ML Experiment Tracking with Vertex AI Experiments Autologging

1269
Of your peers have already read this article.
3:30 Minutes
The most insightful time you'll spend today!
Practical machine learning (ML) is a trial and error process. ML practitioners compare different performance metrics by running ML experiments till you find the best model with a given set of parameters. Because of the experimental nature of ML, there are many reasons for tracking ML experiments and making them reproducible including debugging and compliance.
But tracking experiments is challenging: you need to organize experiments so that other team members can quickly understand, reproduce and compare them. That adds overhead that you don’t need.
We are happy to announce Vertex AI Experiments autologging, a solution which provides automated experiment tracking for your models, which streamlines your ML experimentation
With Vertex AI Experiments autologging, you can now log parameters, performance metrics and lineage artifacts by adding one line of code to your training script without needing to explicitly call any other logging methods.
How to use Vertex AI autologging
As a data scientist or ML practitioner, you conduct your experiment in a notebook environment such as Colab or Vertex AI Workbench. To enable Vertex AI Experiments autologging, you call aiplatform.autolog() in your Vertex AI Experiment session. After that call, any parameters, metrics and artifacts associated with model training are automatically logged and then accessible within the Vertex AI Experiment console.
Here’s how to enable autologging in your training session with a Scikit-learn model.
# Enable autologging
aiplatform.autolog()

# Build training pipeline
ml_pipeline = Pipeline(...)

# Train model
ml_pipeline.fit(x_train, y_train)
This video shows parameters and training/post-training metrics in the Vertex AI Experiment console.
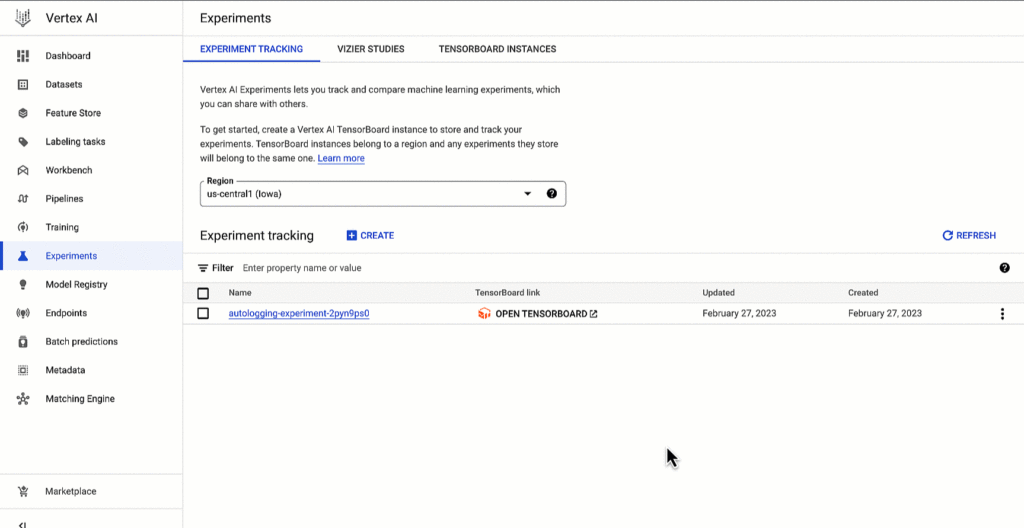
Vertex AI SDK autologging uses MLFlow’s autologging in its implementation and it supports several frameworks including XGBoost, Keras and Pytorch Lighting. See documentation for all supported frameworks.
Vertex AI Experiments autologging automatically logs model time series metrics when you train models along multiple epochs. That’s because of the integration between Vertex AI Experiments autologging and Vertex AI Tensorboard.
Furthermore, you can adapt Vertex AI Experiments autologging to your needs. For example, let’s say your team has a specific experiment naming convention. By default, Vertex AI Experiments autologging automatically creates Experiment Runs for you without requiring you to call `aiplatform.start_run()` or `aiplatform.end_run()`. If you’d like to specify your own Experiment Run names for autologging, you can manually initialize a specific run within the experiment using aiplatform.start_run() and aiplatform.end_run() after autologging has been enabled.
What’s next
You can access Vertex AI Experiments autologging with the latest version of Vertex AI SDK for Python. To learn more, check out these resources :
- Documentation: Autolog data to an experiment run
- Github: Get started with Vertex AI Experiments autologging
While I’m thinking about the next blog post, let me know if there is Vertex AI content you’d like to see on Linkedin or Twitter.
10185
Of your peers have already watched this video.
1:00 Minutes
The most insightful time you'll spend today!
Predict User Churn on Gaming Apps with Google Analytics Data using BigQuery ML
User retention can be a major challenge for mobile game developers. According to the Mobile Gaming Industry Analysis in 2019, most mobile games only see a 25% retention rate for users after the first day. To retain a larger percentage of users after their first use of an app, developers can take steps to motivate and incentivize certain users to return. But to do so, developers need to identify the propensity of any specific user returning after the first 24 hours.
In this blog post, we will discuss how you can use BigQuery ML to run propensity models on Google Analytics 4 data from your gaming app to determine the likelihood of specific users returning to your app.
You can also use the same end-to-end solution approach in other types of apps using Google Analytics for Firebase as well as apps and websites using Google Analytics 4. To try out the steps in this blogpost or to implement the solution for your own data, you can use this Jupyter Notebook.
Using this blog post and the accompanying Jupyter Notebook, you’ll learn how to:
- Explore the BigQuery export dataset for Google Analytics 4
- Prepare the training data using demographic and behavioural attributes
- Train propensity models using BigQuery ML
- Evaluate BigQuery ML models
- Make predictions using the BigQuery ML models
- Implement model insights in practical implementations
Google Analytics 4 (GA4) properties unify app and website measurement on a single platform and are now default in Google Analytics. Any business that wants to measure their website, app, or both, can use GA4 for a more complete view of how customers engage with their business. With the launch of Google Analytics 4, BigQuery export of Google Analytics data is now available to all users. If you are already using a Google Analytics 4 property, you can follow this guide to set up exporting your GA data to BigQuery.
Once you have set up the BigQuery export, you can explore the data in BigQuery. Google Analytics 4 uses an event-based measurement model. Each row in the data is an event with additional parameters and properties. The Schema for BigQuery Export can help you to understand the structure of the data.
In this blogpost, we use the public sample export data from an actual mobile game app called “Flood It!” (Android, iOS) to build a churn prediction model. But you can use data from your own app or website.
Here’s what the data looks like. Each row in the dataset is a unique event, which can contain nested fields for event parameters.
SELECT *FROM `firebase-public-project.analytics_153293282.events_*`TABLESAMPLE SYSTEM (1 PERCENT)

This dataset contains 5.7M events from over 15k users.
SELECTCOUNT(DISTINCT user_pseudo_id) as count_distinct_users,COUNT(event_timestamp) as count_eventsFROM`firebase-public-project.analytics_153293282.events_*

Our goal is to use BigQuery ML on the sample app dataset to predict propensity to user churn or not churn based on users’ demographics and activities within the first 24 hours of app installation.

In the following sections, we’ll cover how to:
- Pre-process the raw event data from GA4
- Identify users & the label feature
- Process demographic features
- Process behavioral features
- Train classification model using BigQuery ML
- Evaluate the model using BigQueryML
- Make predictions using BigQuery ML
- Utilize predictions for activation
Pre-process the raw event data
You cannot simply use raw event data to train a machine learning model as it would not be in the right shape and format to use as training data. So in this section, we’ll go through how to pre-process the raw data into an appropriate format to use as training data for classification models.
This is what the training data should look like for our use case at the end of this section:

Notice that in this training data, each row represents a unique user with a distinct user ID (user_pseudo_id).
Identify users & the label feature
We first filtered the dataset to remove users who were unlikely to return the app anyway. We defined these ‘bounced’ users as ones who spent less than 10 mins with the app. Then we labeled all remaining users:
- churned: No event data for the user after 24 hours of first engaging with the app.
- returned: The user has at least one event record after 24 hours of first engaging with the app.
For your use case, you can have a different definition of bounce and churning. Also you can even try to predict something else other than churning, e.g.:
- whether a user is likely to spend money on in-game currency
- likelihood of completing n-number of game levels
- likelihood of spending n amount of time in-game etc.
In such cases, label each record accordingly so that whatever you are trying to predict can be identified from the label column.
From our dataset, we found that ~41% users (5,557) bounced. However, from the remaining users (8,031), ~23% (1,883) churned after 24 hours:
SELECTbounced,churned,COUNT(churned) as count_usersFROMbqmlga4.returningusersGROUP BY 1,2ORDER BY bounced

To create these bounced and churned columns, we used the following snippet of SQL code.
...#churned = 1 if last_touch within 24 hr of app installation, else 0IF (user_last_engagement < TIMESTAMP_ADD(user_first_engagement,INTERVAL 24 HOUR),1,0 ) AS churned,#bounced = 1 if last_touch within 10 min, else 0IF (user_last_engagement <= TIMESTAMP_ADD(user_first_engagement,INTERVAL 10 MINUTE),1,0 ) AS bounced,...
You can view the Jupyter Notebook for the full query used for materializing the bounced and churned labels.
Process demographic features
Next, we added features both for demographic data and for behavioral data spanning across multiple columns. Having a combination of both demographic data and behavioral data helps to create a more predictive model.
We used the following fields for each user as demographic features:
geo.countrydevice.operating_systemdevice.language
A user might have multiple unique values in these fields — for example if a user uses the app from two different devices. To simplify, we used the values from the very first user engagement event.
CREATE OR REPLACE VIEW bqmlga4.user_demographics AS (WITH first_values AS (SELECTuser_pseudo_id,geo.country as country,device.operating_system as operating_system,device.language as language,ROW_NUMBER() OVER (PARTITION BY user_pseudo_id ORDER BY event_timestamp DESC) AS row_numFROM `firebase-public-project.analytics_153293282.events_*`WHERE event_name="user_engagement")SELECT * EXCEPT (row_num)FROM first_valuesWHERE row_num = 1 #first engagement);
Process behavioral features
There is additional demographic information present in the GA4 export dataset, e.g. app_info, device, event_params, geo etc. You may also send demographic information to Google Analytics through each hit via user_properties. Furthermore, if you have first-party data on your own system, you can join that with the GA4 export data based on user_ids.
To extract user behavior from the data, we looked into the user’s activities within the first 24 hours of first user engagement. In addition to the events automatically collected by Google Analytics, there are also the recommended events for games that can be explored to analyze user behavior. For our use case, to predict user churn, we counted the number of times the follow events were collected for a user within 24 hours of first user engagement:
user_engagementlevel_start_quickplaylevel_end_quickplaylevel_complete_quickplaylevel_reset_quickplaypost_scorespend_virtual_currencyad_rewardchallenge_a_friendcompleted_5_levelsuse_extra_steps
The following query shows how these features were calculated:
WITHevents_first24hr AS (SELECTe.*FROM`firebase-public-project.analytics_153293282.events_*` eJOINbqmlga4.returningusers rONe.user_pseudo_id = r.user_pseudo_idWHERETIMESTAMP_MICROS(e.event_timestamp) <= r.ts_24hr_after_first_engagement)SELECTuser_pseudo_id,SUM(IF(event_name = 'user_engagement', 1, 0)) AS cnt_user_engagement,# ... repeated for all behavior data ...SUM(IF(event_name = 'use_extra_steps', 1, 0)) AS cnt_use_extra_steps,FROMevents_first24hrGROUP BY1
View the notebook for the query used to aggregate and extract the behavioral data. You can use different sets of events for your use case. To view the complete list of events, use the following query:
SELECTevent_name,COUNT(event_name) as event_countFROM`firebase-public-project.analytics_153293282.events_*`GROUP BY 1ORDER BYevent_count DESC
After this we combined the features to ensure our training dataset reflects the intended structure. We had the following columns in our table:
- User ID:
user_pseudo_id
- Label:
churned
- Demographic features
countrydevice_osdevice_language
- Behavioral features
cnt_user_engagementcnt_level_start_quickplaycnt_level_end_quickplaycnt_level_complete_quickplaycnt_level_reset_quickplaycnt_post_scorecnt_spend_virtual_currencycnt_ad_rewardcnt_challenge_a_friendcnt_completed_5_levelscnt_use_extra_stepsuser_first_engagement
At this point, the dataset was ready to train the classification machine learning model in BigQuery ML. Once trained, the model will output a propensity score between churn (churned=1) or return (churned=0) indicating the probability of a user churning based on the training data.
Train classification model
When using the CREATE MODEL statement, BigQuery ML automatically splits the data between training and test. Thus the model can be evaluated immediately after training (see the documentation for more information).
For the ML model, we can choose among the following classification algorithms where each type has its own pros and cons:

Often logistic regression is used as a starting point because it is the fastest to train. The query below shows how we trained the logistic regression classification models in BigQuery ML.
CREATE OR REPLACE MODEL bqmlga4.churn_logregTRANSFORM(EXTRACT(MONTH from user_first_engagement) as month,EXTRACT(DAYOFYEAR from user_first_engagement) as julianday,EXTRACT(DAYOFWEEK from user_first_engagement) as dayofweek,EXTRACT(HOUR from user_first_engagement) as hour,* EXCEPT(user_first_engagement, user_pseudo_id))OPTIONS(MODEL_TYPE="LOGISTIC_REG",INPUT_LABEL_COLS=["churned"]) ASSELECT*FROMbqmlga4.train
We extracted month, julianday, and dayofweek from datetimes/timestamps as one simple example of additional feature preprocessing before training. Using TRANSFORM() in your CREATE MODEL query allows the model to remember the extracted values. Thus, when making predictions using the model later on, these values won’t have to be extracted again. View the notebook for the example queries to train other types of models (XGBoost, deep neural network, AutoML Tables).
Evaluate model
Once the model finished training, we ran ML.EVALUATE to generate precision, recall, accuracy and f1_score for the model:
SELECT*FROMML.EVALUATE(MODEL bqmlga4.churn_logreg)

The optional THRESHOLD parameter can be used to modify the default classification threshold of 0.5. For more information on these metrics, you can read through the definitions on precision and recall, accuracy, f1-score, log_loss and roc_auc. Comparing the resulting evaluation metrics can help to decide among multiple models.Furthermore, we used a confusion matrix to inspect how well the model predicted the labels, compared to the actual labels. The confusion matrix is created using the default threshold of 0.5, which you may want to adjust to optimize for recall, precision, or a balance (more information here).
SELECTexpected_label,_0 AS predicted_0,_1 AS predicted_1FROMML.CONFUSION_MATRIX(MODEL bqmlga4.churn_logreg)

This table can be interpreted in the following way:

Make predictions using BigQuery ML
Once the ideal model was available, we ran ML.PREDICT to make predictions. For propensity modeling, the most important output is the probability of a behavior occurring. The following query returns the probability that the user will return after 24 hrs. The higher the probability and closer it is to 1, the more likely the user is predicted to return, and the closer it is to 0, the more likely the user is predicted to churn.
SELECTuser_pseudo_id,returned,predicted_returned,predicted_returned_probs[OFFSET(0)].prob as probability_returnedFROMML.PREDICT(MODEL bqmlga4.churn_logreg,(SELECT * FROM bqmlga4.train)) #can be replaced with a proper test dataset
Utilize predictions for activation
Once the model predictions are available for your users, you can activate this insight in different ways. In our analysis, we used user_pseudo_id as the user identifier. However, ideally, your app should send back the user_id from your app to Google Analytics. In addition to using first-party data for model predictions, this will also let you join back the predictions from the model into your own data.
- You can import the model predictions back into Google Analytics as a user attribute. This can be done using the Data Import feature for Google Analytics 4. Based on the prediction values you can Create and edit audiences and also do Audience targeting. For example, an audience can be users with prediction probability between 0.4 and 0.7, to represent users who are predicted to be “on the fence” between churning and returning.
- For Firebase Apps, you can use the Import segments feature. You can tailor user experience by targeting your identified users through Firebase services such as Remote Config, Cloud Messaging, and In-App Messaging. This will involve importing the segment data from BigQuery into Firebase. After that you can send notifications to the users, configure the app for them, or follow the user journeys across devices.
- Run targeted marketing campaigns via CRMs like Salesforce, e.g. send out reminder emails.
You can find all of the code used in this blogpost in the Github repository:
What’s next?
Continuous model evaluation and re-training
As you collect more data from your users, you may want to regularly evaluate your model on fresh data and re-train the model if you notice that the model quality is decaying.
Continuous evaluation—the process of ensuring a production machine learning model is still performing well on new data—is an essential part in any ML workflow. Performing continuous evaluation can help you catch model drift, a phenomenon that occurs when the data used to train your model no longer reflects the current environment.
To learn more about how to do continuous model evaluation and re-train models, you can read the blogpost: Continuous model evaluation with BigQuery ML, Stored Procedures, and Cloud Scheduler
More resources
If you’d like to learn more about any of the topics covered in this post, check out these resources:
- BigQuery export of Google Analytics data
- BigQuery ML quickstart
- Events automatically collected by Google Analytics 4
- Qwiklabs: Create ML models with BigQuery ML
Or learn more about how you can use BigQuery ML to easily build other machine learning solutions:
- How to build demand forecasting models with BigQuery ML
- How to build a recommendation system on e-commerce data using BigQuery ML
Let us know what you thought of this post, and if you have topics you’d like to see covered in the future! You can find us on Twitter at @polonglin and @_mkazi_.Thanks to reviewers: Abhishek Kashyap, Breen Baker, David Sabater Dinter.
Google is a Leader in the 2019 Gartner Magic Quadrant for Data Management Solutions for Analytics

5995
Of your peers have already read this article.
2:10 Minutes
The most insightful time you'll spend today!
As organizations continue to produce vast quantities of data, they increasingly need platforms that allow them to analyze, store, and extract meaningful insights from that data. And research from analyst firms like Gartner offer an important way for organizations to evaluate and compare cloud data warehouse providers.
Earlier this year, Gartner named Google a Leader in the 2019 Gartner Magic Quadrant for Data Management Solutions for Analytics (DMSA) (report available here). This evaluation covers Google Cloud’s core data analytics offerings, including BigQuery, a serverless, managed data warehouse, Cloud Dataproc, a managed Spark and Hadoop service, and Cloud Dataflow, which enables you to stream and batch-process your data. Here are a few takeaways:
Simplicity and speed
BigQuery’s performance permits complex queries on large-scale data sets to return in seconds, and a substantial number of BigQuery customers maintain data warehouses that store more than 50 terabytes (and a few customers now use more than 100 petabytes). More than half of these customers are loading data either continuously or many times per day. These customers value the ability to extract, transform, load, and analyze their data on a serverless platform, all without maintaining any underlying infrastructure.
A versatile serverless data warehouse
One of BigQuery’s major advantages is its ability to allow customers to address a wide variety of use cases—from a traditional data warehouse to data science. Over the past year, we’ve worked hard to introduce new features in BigQuery like data types for financial and monetary uses, BigQuery GIS for geospatial data, and machine learning capabilities through BigQuery ML. BigQuery’s continuous ingest capabilities make it suitable for an operational—or a real-time—serverless data warehouse.
An expanding ecosystem
With overall increased market adoption, our analytics offerings continue to benefit from a fast-growing partner ecosystem of service providers, and business intelligence (BI) and data integration vendors. In particular, in 2018 we expanded our partnerships with established industry providers, including Confluent, Dell Boomi, Informatica, Looker, Reltio, Tableau, and ThoughtSpot.
More and more organizations are finding value in Google Cloud’s serverless data warehouse and analytics offerings. If you’d like to learn more, you can download a complimentary copy of the Gartner Magic Quadrant for Data Management Solutions for Analytics on the Google site (requires an email address).
Gartner does not endorse any vendor, product or service depicted in its research publications, and does not advise technology users to select only those vendors with the highest ratings or other designation. Gartner research publications consist of the opinions of Gartner’s research organization and should not be construed as statements of fact. Gartner disclaims all warranties, expressed or implied, with respect to this research, including any warranties of merchantability or fitness for a particular purpose.
Cloud TPU v4: powerful and efficient ML infrastructure anywhere

2841
Of your peers have already read this article.
3:30 Minutes
The most insightful time you'll spend today!
Today, ML-driven innovation is fundamentally transforming computing, enabling entirely new classes of internet services. For example, recent state-of-the-art lage models such as PaLM and Chinchilla herald a coming paradigm shift where ML services will augment human creativity. All indications are that we are still in the early stages of what will be the next qualitative step function in computing. Realizing this transformation will require democratized and affordable access through cloud computing where the best of compute, networking, storage, and ML can be brought to bear seamlessly on ever larger-scale problem domains.
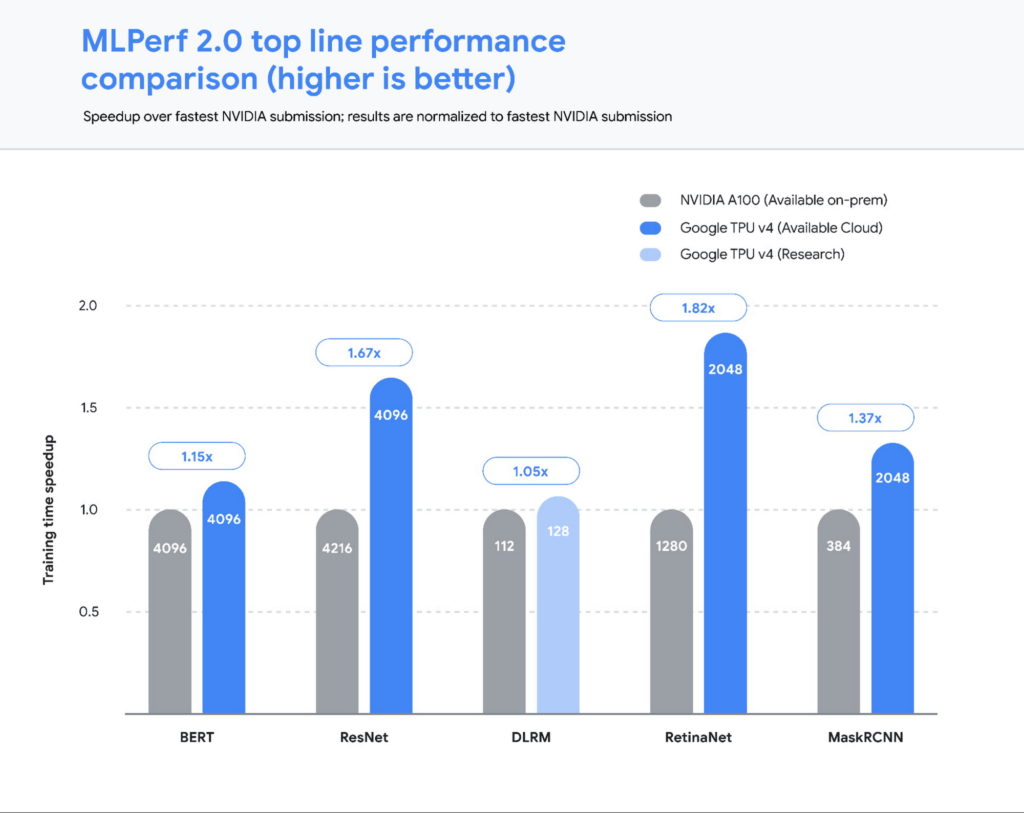
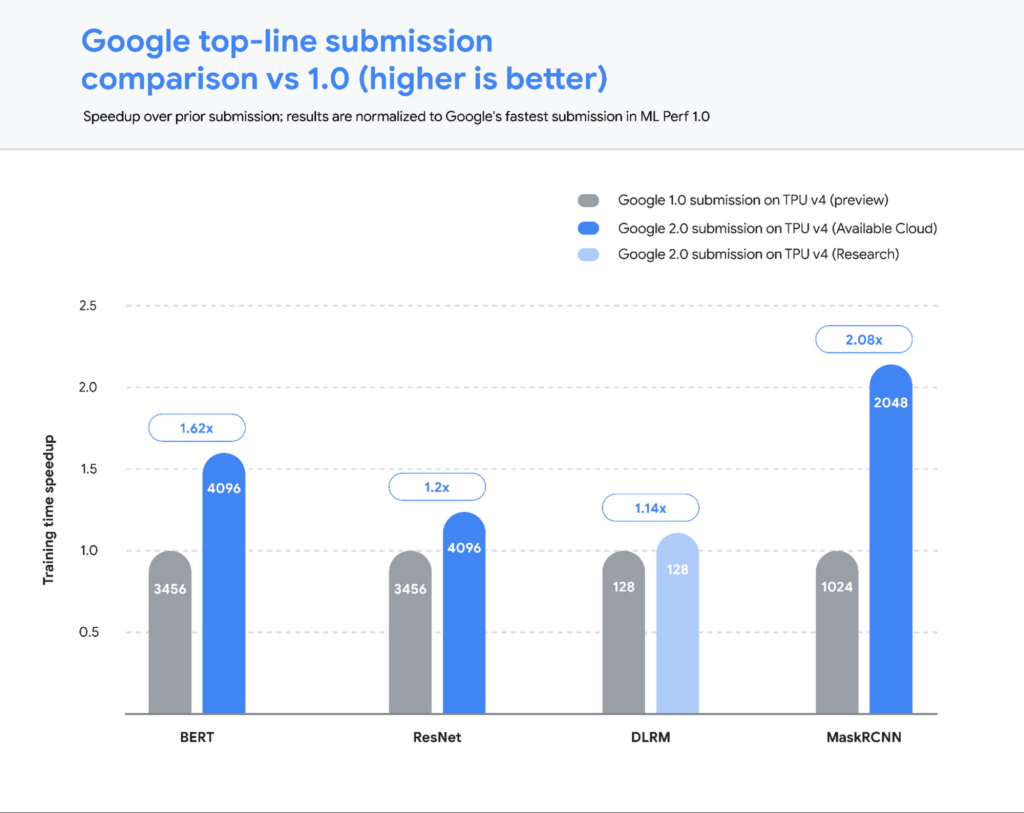
Today’s release of MLPerf™ 2.0 results from the MLCommons® Association highlights the public availability of the most powerful and efficient ML infrastructure anywhere. Google’s TPU v4 ML supercomputers set performance records on five benchmarks, with an average speedup of 1.42x over the next fastest non-Google submission, and 1.5x vs our MLPerf 1.0 submission. Even more compelling — four of these record runs were conducted on the publicly available Google Cloud ML hub that we announced at Google I/O. ML Hub runs out of our Oklahoma data center, which uses over 90% carbon-free energy.
Let’s take a closer look at the results.
Performance at scale…and in the public cloud
Our 2.0 submissions1, all running on TensorFlow, demonstrated leading performance across all five benchmarks. We scaled two of our submissions to run on full TPU v4 Pods. Each Cloud TPU v4 Pod consists of 4096 chips connected together via an ultra-fast interconnect network with an industry-leading 6 terabits per second (Tbps) of bandwidth per host, enabling rapid training for the largest models.
Hardware aside, these benchmark results were made possible in no small part by our work to improve the TPU software stack. Scalability and performance optimizations in the TPU compiler and runtime, including faster embedding lookups and improved model weight distribution across the TPU pod, enabled much of these improvements, and are now widely available to TPU users. For example, we made a number of performance improvements to the virtualization stack to fully utilize the compute power of both CPU hosts and TPU chips to achieve peak performance on image and recommendation models. These optimizations reflect lessons from Google’s cutting-edge internal ML use cases across Search, YouTube, and more. We are excited to bring the benefits of this work to all Google Cloud users as well.
Translating MLPerf wins to customer wins
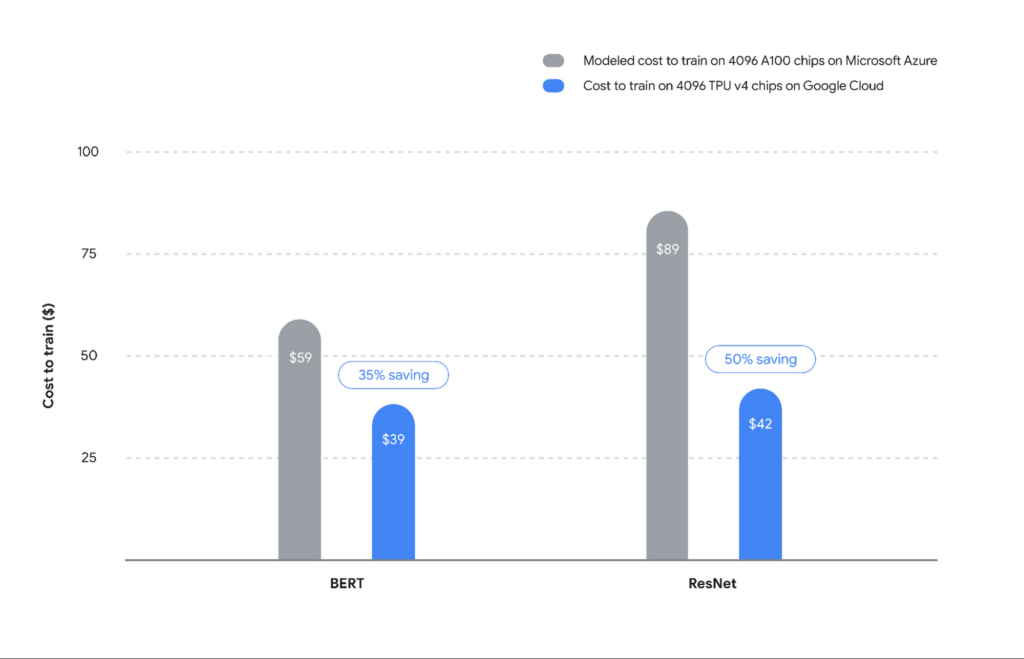
Cloud TPU’s industry-leading performance at scale also translates to cost savings for customers. Based on our analysis summarized in Figure 3, Cloud TPUs on Google Cloud provide ~35-50% savings vs A100 on Microsoft Azure (see Figure 3). We employed the following methodology to calculate this result:2
We compared the end-to-end times of the largest-scale MLPerf submissions, namely ResNet and BERT, from Google and NVIDIA. These submissions make use of a similar number of chips — upwards of 4000 TPU and GPU chips. Since performance does not scale linearly with chip count, we compared two submissions with roughly the same number of chips.
To simplify the 4216-chip A100 comparison for ResNet vs our 4096-chip TPU submission, we made an assumption in favor of GPUs that 4096 A100 chips would deliver the same performance as 4216 chips.
For pricing, we compared our publicly available Cloud TPU v4 on-demand prices ($3.22 per chip-hour) to Azure’s on-demand prices for A1003 ($4.1 per chip-hour). This once again favors the A100s since we assume zero virtualization overhead in moving from on-prem (NVIDIA’s results) to Azure Cloud.
The savings are especially meaningful given that real-world models such as GPT-3 and PaLM are much larger than the BERT and ResNet models used in the MLPerf benchmark: PaLM is a 540 billion parameter model, while the BERT model used in the MLPerf benchmark has only 340 million parameters — a 1000x difference in scale. Based on our experience, the benefits of TPUs will grow significantly with scale and make the case all the more compelling for training on Cloud TPU v4.
Have your cake and eat it too — a continued focus on sustainability
Performance at scale must take environmental concerns as a primary constraint and optimization target. The Cloud TPU v4 pods powering our MLPerf results run with 90% carbon-free energy and a Power Usage Efficiency of 1.10, meaning that less than 10% of the power delivered to the data center is lost through conversion, heat, or other sources of inefficiency. The TPU v4 chip delivers 3x the peak FLOPs per watt relative to the v3 generation. This combination of carbon-free energy and extraordinary power delivery and computation efficiency makes Cloud TPUs among the most efficient in the world.4
Making the switch to Cloud TPUs
There has never been a better time for customers to adopt Cloud TPUs. Significant performance and cost savings at scale as well as a deep-rooted focus on sustainability are why customers such as Cohere, LG AI Research, Innersight Labs, and Allen Institute have made the switch. If you are ready to begin using Cloud TPUs for your workloads, please fill out this form. We are excited to partner with ML practitioners around the world to further accelerate the incredible rate of ML breakthroughs and innovation with Google Cloud’s TPU offerings.
1. MLPerf™ v2.0 Training Closed. Retrieved from https://mlcommons.org/en/training-normal-20/ 29 June 2022, results 2.0-2010, 2.0-2012, 2.0-2098, 2.0-2099, 2.0-2103, 2.0-2106, 2.0-2107, 2.0-2120. The MLPerf name and logo are trademarks of MLCommons Association in the United States and other countries. All rights reserved. Unauthorized use is strictly prohibited. See www.mlcommons.org for more information.
2. MLPerf v1.0 and v2.0 Training Closed. Retrieved from https://mlcommons.org/en/training-normal-20/ 29 June 2022, results 1.0-1088, 1.0-1090, 1.0-1092, 2.0-2010, 2.0-2012, 2.0-2120.
3. ND96amsr A100 v4 Azure VMs, powered by eight 80 GB NVIDIA Ampere A100 GPUs (Azure’s flagship Deep Learning and Tightly Coupled HPC GPU offering with CentOS or Ubuntu Linux) is used for this benchmarking
4. Cost to train is not an official MLPerf metric and is not verified by MLCommons Association. Azure performance is a favorable estimate as described in the text, not an MLPerf result. Computations are based on results from MLPerf v2.0 Training Closed. Retrieved from https://mlcommons.org/en/training-normal-20/ 29 June 2022, results 2.0-2012, 2.0-2106, 2.0-2107.
SEED: The 4 Areas of a Well-functioning and Responsible AI

4339
Of your peers have already read this article.
2:00 Minutes
The most insightful time you'll spend today!
The future of AI is better AI—designed with ethics and responsibility built in from the start. This means putting the brakes on AI-driven transformation until you have a well-functioning strategy and process in place to ensure your models deliver fair outcomes. Failing to recognize this imperative is a threat to your bottom line. The following post provides a simple framework to follow to keep your business on the right track as you place more trust in algorithms.
AI is inherently sociotechnical. AI systems represent the interconnectedness of humans and technology. They are designed to be used by and to inform humans within specific contexts, and the speed and scale of AI means that any lack of responsibility—such as bias, safety, privacy, scientific excellence etc—will also replicate at that same speed and scale. Without ethics and responsibility built in by design, AI systems lack the critical “inputs” or societal context that enable long term success.
Lawsuits stemming from AI systems that are biased towards certain groups are stacking up. In August 2020, IBM was forced to settle a lawsuit with the city of Los Angeles for misappropriating data it collected for its weather channel app. Health services company, Optum, is being investigated by regulators for creating an algorithm that allegedly recommended that doctors and nurses pay more attention to white patients than to sicker black patients. And Facebook, which granted Cambridge Analytica, a political firm, access to the personal data of more than 50 million people, is buried in legal work. Google has also run into its share of issues with algorithms making egregious mistakes.
While lawsuits are real, the foundational reason ethical AI is critical to your bottom line is trust. Without it, increasingly, consumers will ignore you and choose a brand they do trust. Research from Kantar, which runs one of the largest global brand equity studies (4 million consumers, 18,000 brands, across 50 markets), revealed that almost 9% of a brand’s equity is driven by corporate reputation, of which responsibility is a key attribute. Over the last decade, the importance of responsibility to consumers in relation to making brand choices has tripled.
The study stated brands perceived to be among the world’s most trusted and responsible shared three crucial factors that proved particularly important for building consumer trust and confidence, even when a brand might be new to a market. These are:
- Honesty and openness
- Respect and inclusion
- Identifying with and caring for customers
Brands that develop these associations more strongly tend to outperform their competitors in defending and growing their brand value.
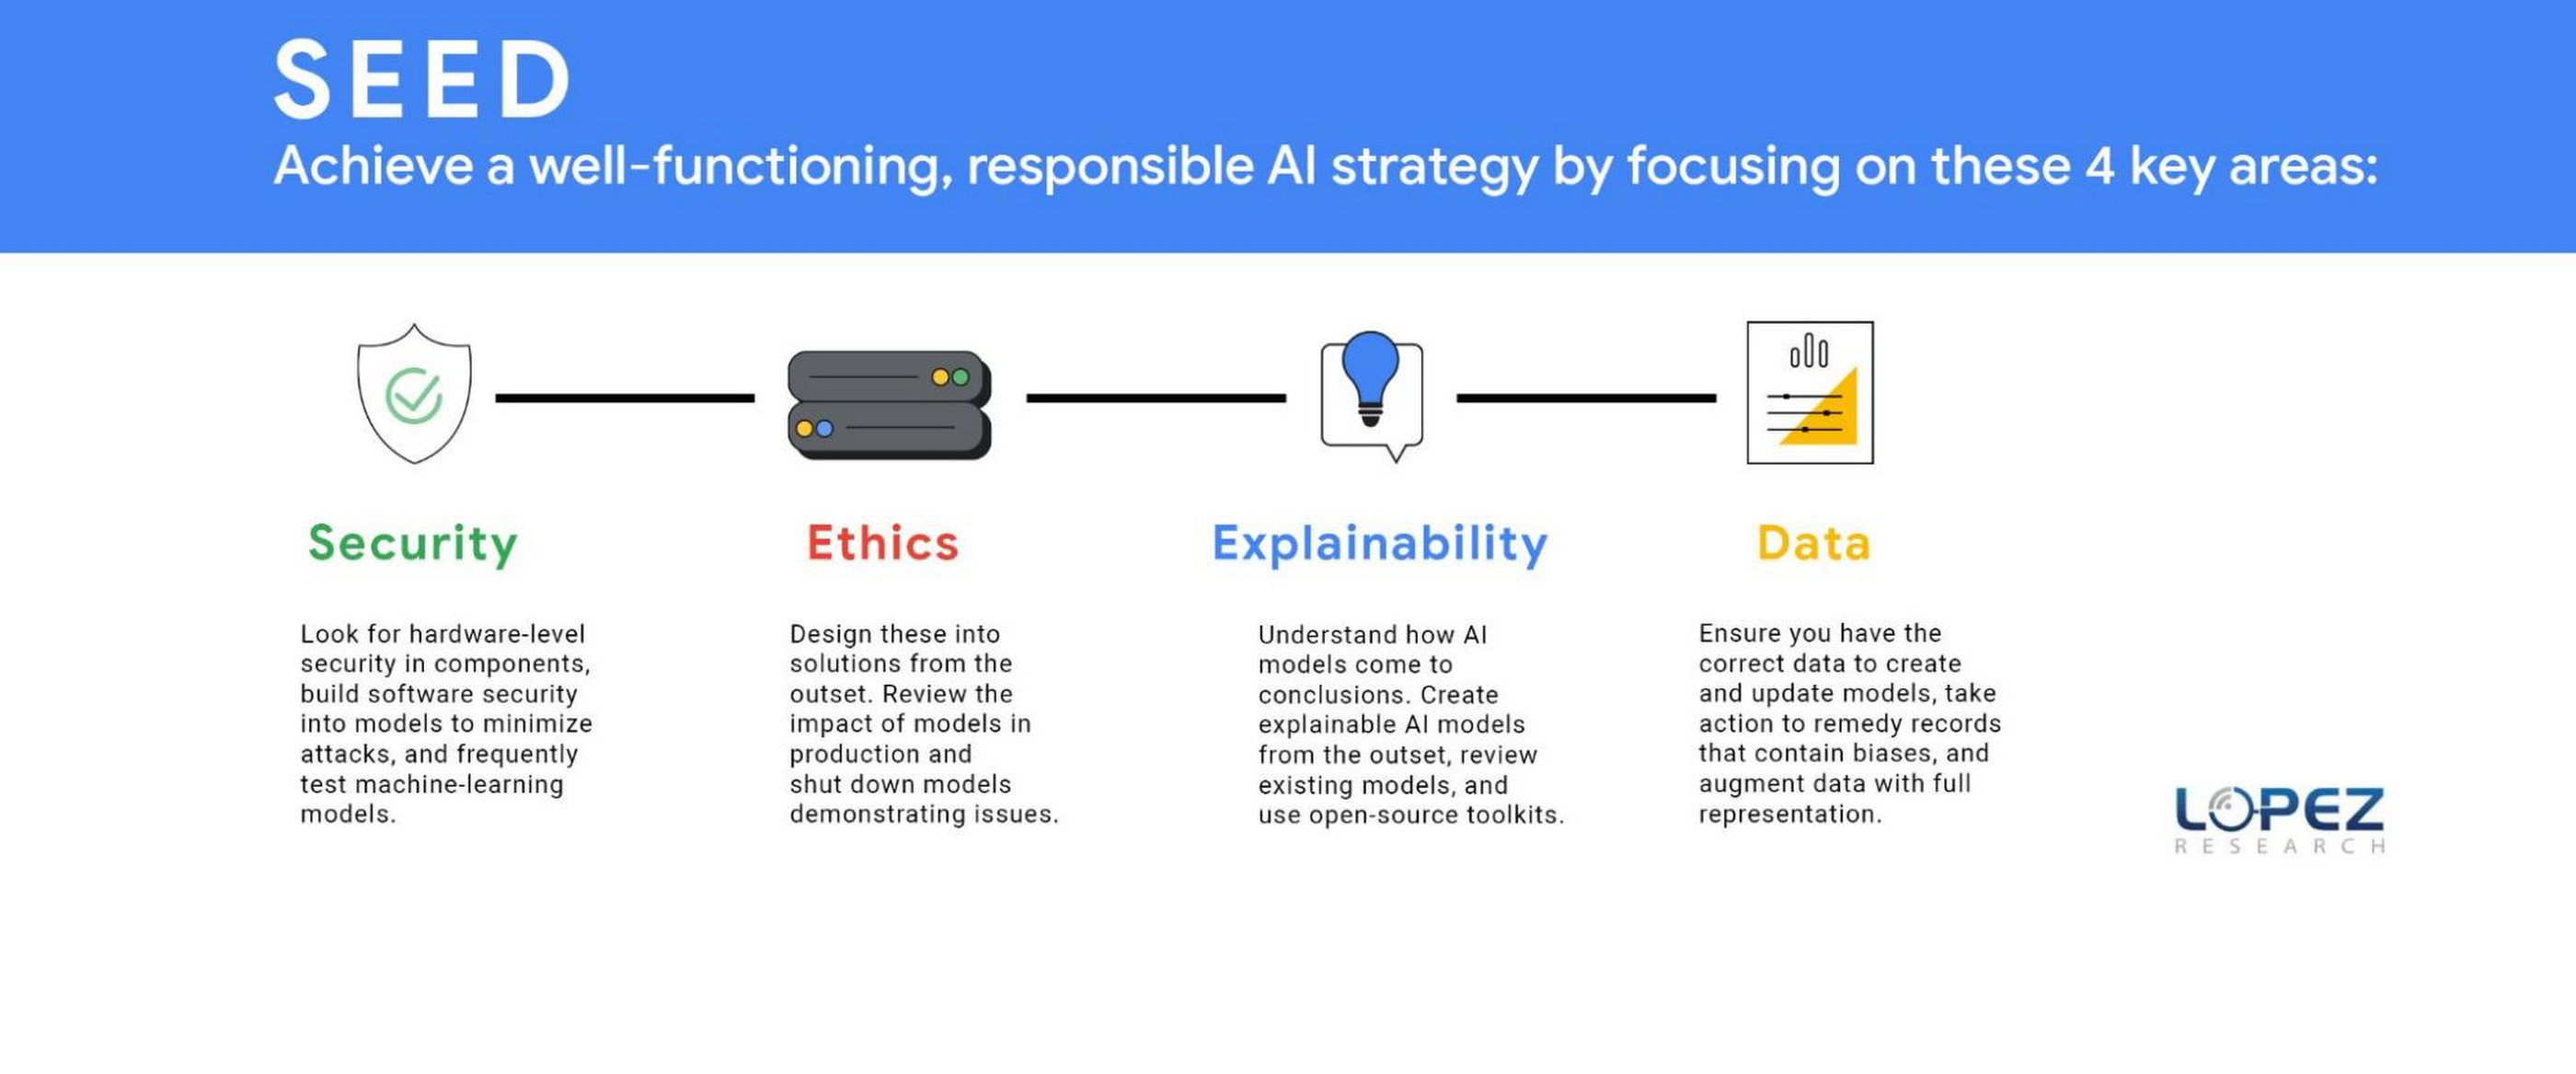
Technology and business leaders need to focus on four areas to accomplish a well-functioning ethical AI strategy. Lopez Research refers to this group of tasks as SEED, which stands for security, ethics, explainability, and data (SEED). Each of these topics could be an article in itself, but this post will define several essential components.
SECURITY (S)
It might not seem obvious, but a robust AI strategy requires an embedded security strategy. Companies should look for hardware-level security in components such as GPUs and CPUs. IT leaders should build software security into models to minimize attacks such as poisoning, evasion, deepfakes, backdoors, and model extraction. The threat of adversarial data poisoning attacks machine learning models by maliciously introducing inaccurate data designed to corrupt the model’s ability to be accurate. Another security threat is model extraction, also known as model cloning, where a hacker finds a way to either reconstruct a black-box machine learning model or extract the training data. The first line of defense against all security attacks is to design security at the outset, but the next best step is to frequently test models to ensure they are operating as planned. Business leaders, data science experts, and IT leaders must work together to regularly review the outcomes of AI models.
ETHICS (E)
Today, organizations must understand that ethics should be designed into the solution at its outset. The ethics process starts with defining the potential positive and negative outcomes of the model that your business is creating. Once the team has evaluated potential harmful effects, which means unpacking the systems, beliefs, power hierarchies and dynamics that interconnect with the technology, it’s your responsibility to eliminate or minimize the impact of these outcomes. It’s also critically important to review the impact of models in production and shut down models demonstrating issues. An example of this was the public beta release of the Tay chatbot that Microsoft deployed and rapidly shut down because it propagated negative biases.
Yet, many organizations aren’t taking this action. The FICO study revealed that 93% of companies said responsible AI was critical for success but only 33% of these companies were measuring AI model outputs to ensure these models were operating as expected (measuring for model drift). Another survey by Pew Research revealed that 68% believe that ethical principles focused primarily on the public good will not be employed in most AI systems by 2030.
Regulations may turn this tide, regardless of whether organizations plan to adopt an ethical AI framework. Laws governing the ethical use of data in AI are expected to be finalized as soon as 2022, such as the European Commission’s proposed legal framework for AI. Organizations that start with ethical use of AI in mind will be better positioned to deal with customer privacy concerns and regulatory compliance.
EXPLAINABILITY(E)
As models have become more sophisticated, it’s also become increasingly difficult to explain why a model created a specific outcome. In the FICO Responsible AI report, 65% of respondents could not explain how specific AI model decisions or predictions are made, and only 35% said their organization made an effort to use AI in a way that was transparent and accountable. However, it’s never been more important to clarify how AI models came to conclusions such as why a loan was denied, why a particular strategy should be implemented, and how AI selected a set of resumes to review for a position. The goal is to create an explainable AI model from the outset but many of today’s models lack this capability. Every business should review its existing models and use open-source toolkits that can be found on Github.com that support the interpretability and explainability of machine learning models.
Keep in mind that explainability isn’t one-size-fits-all. Different stakeholders need different types of information. Much of explainability to date has focused on “opening the black box” which gets equated to information that is only useful for other data scientists. That’s important, but it doesn’t help the line of business users whose workflows AI is integrated into, or end users who deserve information about how decisions are made; or policymakers who don’t have data science backgrounds, and so on.
DATA (D)
An equally important item in ethics is data. Ethics starts with ensuring you have the correct data to create and update models. Three main issues include representative data, inherent biases within existing data, and inaccurate data. A critical issue that most companies miss in creating models is that current data sets frequently lack full market representation. A recent Capgemini Research Institute report revealed that 65% of executives “were aware of the issue of discriminatory bias” with these systems.
Awareness is the first step, but organizations must take action to remedy this issue. Historical data may no longer serve a company’s current needs for model creation. Historical records may contain biases against certain groups. For example, historical criminal data records show an imbalance in ethnic groups’ incarceration, which would lead to model biases. Additionally, laws and societal norms also change. Certain groups were prosecuted for sexual preference in the past, but today this information would create an inaccurate model.
Companies have also discovered that using demographic data, a common practice in marketing, can also lead to model bias. For example, individuals that primarily used cash for transactions and others that lived in specific zip codes were at a disadvantage in banking models to determine creditworthiness. To minimize these issues, a company needs to augment its data with full representation in areas such as ethnicity, gender, age, behavioral and economic profiles.

Design AI models with a continuous feedback loop
Another, more prominent, yet tricky issue is data accuracy. As the adage says, garbage in, equals garbage out. The least appreciated but arguably the most essential component of the AI model lifecycle is ensuring the model has accurate data at all times. Inaccurate data from either poor data hygiene or data that was tampered with for security purposes can cause model failures. Organizations need to invest the time and resources to ensure they have the correct data. Data privacy is another key element that businesses must address, but the concepts of data privacy, sovereignty, and security are significant enough that we will come back to this in a separate article.
Overall, it’s clear that while we may have an abundance of data, it most likely doesn’t represent what we want to model for the future. A successful AI strategy is an ethical AI strategy that requires the organization to be thoughtful in its model creation by ensuring it has a broad representation of accurate data and testing the outcomes to ensure the models are secure and operating as expected.
Organizations that define an AI model lifecycle with a continuous feedback loop will reap the benefits of better intelligence. This will increasingly mean stronger, longer lasting trust with customers and staying on the right side of new laws and regulations.
10 Reasons that Make Google Cloud the Champion of IaaS

10445
Of your peers have already read this article.
5:00 Minutes
The most insightful time you'll spend today!
When you choose to run your business on Google Cloud you benefit from the same planet-scale infrastructure that powers Google’s products such as Maps, YouTube, and Workspace.
We have picked 10 ways in which Google Cloud Infrastructure services outshine alternatives in the market in how they simplify your operations, save money, and secure your data.
1. Custom Machine Types means no wasted resources
Compute Engine offers predefined machine types that you can use when you create a VM instance. A predefined machine type has a preset number of vCPUs and a preset amount of memory; each type is billed at a set price as described on the Compute Engine pricing page.
If predefined machine types don’t meet your needs, you can create a VM instance with a custom number of vCPUs and custom amount of memory, effectively building a custom machine type. Custom machine types are available only for general-purpose machine families. When you create a custom machine type, you are deploying a custom machine type from the E2, N2, N2D, or N1 machine family on GCP. No other leading cloud vendor offers custom machine types so extensively.
Custom machine types are a good idea for workloads that aren’t a good fit for the predefined machine types and for workloads that require more processing power or memory but don’t need all of the upgrades provided by the next machine type level. This translates into lower operating costs. They are also useful for controlling software licensing costs that are based on the number of underlying compute cores.
Jeremy Lloyd, Infrastructure and Application Modernization Lead at Appsbroker, a Google partner:
“Custom machine types coupled with Google’s StratoZone data center discovery tool provides Appsbroker with the flexibility we need to provide cost efficient virtual machines matched to a virtual machine’s actual utilization. As a result, we are able to keep our customers’ operating costs low while still providing the ability to scale as needed.”
2. Compute Engine Virtual Machines are optimized for scale-out workloads
For scale-out workloads, T2D, the first instance type in the Tau VM family, is based on 3rd Gen AMD EPYC processors and leapfrogs VMs for scale-out workloads of any leading public cloud provider today, both in terms of performance and price-performance. Tau VMs offer 56% higher absolute performance and 42% higher price-performance compared to general-purpose VMs from any leading public cloud vendor (source). The x86 compatibility provided by these AMD EPYC processor-based VMs gives you market-leading performance improvements and cost savings, without having to port your applications to a new processor architecture. Sign up here if you are interested in trying out T2D instances in Preview.
For SAP HANA, Google Cloud has demonstrated with SAP how we can run the world’s largest scale-out HANA system in the public cloud (96TB). With such innovation, you are covered as your business grows exponentially.
3. Largest single node GPU-enabled VM
Google is the only public cloud provider to offer up to 16 NVIDIA A100 GPUs in a single VM, making it possible to train very large AI models. Users can start with one NVIDIA A100 GPU and scale to 16 GPUs without configuring multiple VMs for single-node ML training, without crossing the VM layer.
Additionally, customers can choose smaller GPU configurations—1, 2, 4 and 8 GPUs per VM—providing the flexibility to scale their workload as needed.
The A2 VM family was designed to meet today’s most demanding applications—workloads like CUDA-enabled machine learning (ML) training and inference, for example. This family is built on the A100 GPU which offers up to 20x the compute performance compared to the previous generation GPU and comes with 40 GB of high-performance HBM2 GPU memory. To speed up multi-GPU workloads, the A2 VMs use NVIDIA’s HGX A100 systems to offer high-speed NVLink GPU-to-GPU bandwidth that delivers up to 600 GB/s. A2 VMs come with up to 96 Intel Cascade Lake vCPUs, optional Local SSD for workloads requiring faster data feeds into the GPUs and up to 100 Gbps of networking. A2 VMs provide full vNUMA transparency into the architecture of underlying GPU server platforms, enabling advanced performance tuning. Google Cloud offers these GPUs globally.
4. Non-disruptive maintenance means you worry less about planned downtime
Compute Engine offers live migration (non-disruptive maintenance) to keep your virtual machine instances running even when a host system event, such as a software or hardware update, occurs. Google’s Compute Engine live migrates your running instances to another host in the same zone without requiring your VMs to be rebooted. Live migration enables Google to perform maintenance that is integral to keeping infrastructure protected and reliable without interrupting any of your VMs. When a VM is scheduled to be live-migrated, Google provides a notification to the guest that a migration is imminent.
Live migration keeps your instances running during:
- Regular infrastructure maintenance and upgrades
- Network and power grid maintenance in the data centers
- Failed hardware such as memory, CPU, network interface cards, disks, power, and so on. This is done on a best-effort basis; if a hardware component fails completely or otherwise prevents live migration, the VM crashes and restarts automatically and a hostError is logged.
- Host OS and BIOS upgrades
- Security-related updates
- System configuration changes, including changing the size of the host root partition, for storage of the host image and packages
Live migration does not change any attributes or properties of the VM itself. The live migration process transfers a running VM from one host machine to another host machine within the same zone. All VM properties and attributes remain unchanged, including internal and external IP addresses, instance metadata, block storage data and volumes, OS and application state, network settings, network connections, and so on. This has the benefit of reducing operational and maintenance overhead, helps you build a more robust security posture where infrastructure can be consciously revamped from a known good state and minimizes risks for advanced persistent threats.
Refer to Lessons learned from a year of using live migration in production on Google Cloud from the Google engineering team.
5. Trusted Computing: Shielded VMs guard you against advanced, persistent attacks
Establishing trust in your environment is multifaceted, involving hardware and firmware, as well as host and guest operating systems. Unfortunately, threats like boot malware or firmware rootkits can stay undetected for a long time, and an infected virtual machine can continue to boot in a compromised state even after you’ve installed legitimate software.
Shielded VMs can help you protect your system from attack vectors like:
- Malicious guest OS firmware, including malicious UEFI extensions
- Boot and kernel vulnerabilities in the guest OS
- Malicious insiders within your organization
To guard against these kinds of advanced persistent attacks, Shielded VMs use:
- Unified Extensible Firmware Interface (UEFI) BIOS: Helps ensure that firmware is signed and verified
- Secure and Measured Boot: Helps ensure that a VM boots an expected, healthy kernel
- Virtual Trusted Platform Module (vTPM): Establishes root-of-trust, underpins Measured Boot, and prevents exfiltration of vTPM-sealed secrets
- Integrity Monitoring: Provides tamper-evident logging, integrated with Stackdriver, to help you quickly identify and remediate changes to a known integrity state
The Google approach allows customers to deploy Shielded VMs with only a simple click, thereby easing implementation.
6. Confidential Computing encrypts data while in use
Google Cloud was a founding member of the Confidential Computing Consortium. Along with encryption of data in transit and at rest using customer-managed encryption keys (CMEK) and customer-supplied encryption keys (CSEK), Confidential VM adds a “third pillar” to the end-to-end encryption story by encrypting data while in use. Confidential Computing uses processor-based technology that allows data to be encrypted in use while it is being processed in the public cloud. Confidential VM allows you to to encrypt memory in use on a Google Compute Engine VM by checking a single checkbox.
All Confidential VMs support the previously mentioned Shielded VM features under the covers—you can think of Shielded VM as helping to address VM integrity, while Confidential VM addresses the memory encryption aspect which relies on CPU features. With the confidential execution environments provided by Confidential VM and AMD Secure Encrypted Virtualization (SEV), Google Cloud keeps customers’ sensitive code and other data encrypted in memory during processing. Google does not have access to the encryption keys. In addition, Confidential VM can help alleviate concerns about risk related to either dependency on Google infrastructure or Google insiders’ access to customer data in the clear.
See what Google Cloud partners say about Confidential Computing here.
7. Advanced networking delivers full-stack networking and security services with fast, consistent, and scalable performance
Google Cloud’s network delivers low latency, reduces operational costs and ensures business continuity, enabling organizations to seamlessly scale up or down in any region to meet business needs. Our planet-scale network uses advanced software-defined networking and security with edge caching services to deliver fast, consistent, and scalable performance. With 28 regions, 85 zones, and 146 PoPs connected by 16 subsea fiber cables around the world, Google Cloud’s network offers a full stack of layer 1 to layer 7 services for enterprises to run their workloads anywhere. Enterprises can be assured that they have best-in-class networking and security services connecting their VMs, containers, and bare metal resources in hybrid and multi-cloud environments with simplicity, visibility, and control.
Google Cloud’s network has protected customers from one of the world’s largest DDoS attacks at 2.54 Tbps. With our multi-layer security architecture and products such as Cloud Armor, our customers ran their business with no disruptions. Furthermore, our recent integration of Cloud Armor with reCAPTCHA Enterprise adds best-in-class bot and fraud management to prevent volumetric attacks. Cloud Armor is deployed with our Cloud Load Balancer and Cloud CDN, extending the secure benefits at the network edge for traffic coming into Google Cloud so customers have security, performance, and reliability all built in. Furthermore, we are excited to offer Cloud IDS in preview, which was co-developed with security industry leader, Palo Alto Networks, to run natively in Google Cloud.
Our advanced networking capabilities also extends to GKE and Anthos networking. With the GKE Gateway controller, customers can manage internal and external HTTPS load balancing for a GKE cluster or a fleet of GKE clusters with multi-tenancy while maintaining centralized admin policy and control. Unlike other Kubernetes offerings, we offer eBPF dataplane which brings powerful tooling such as Kubernetes network policy and logging to GKE. eBPF is known to kernel engineers as a “superpower” for its unique architecture to load and unload modules in kernel space, and now this capability is built in with Google Cloud networking.
For observability and monitoring, our customers deploy Network Intelligence Center, Google Cloud’s comprehensive network monitoring, verification and optimization platform. With four key modules in Network Intelligence Center, and several more to come, we are working towards realizing our vision of proactive network operations that can predict and heal network failures, driven by AI/ML recommendations and remediation. Network Intelligence Center provides unmatched visibility into your network in the cloud along with proactive network verification. Centralized monitoring cuts down troubleshooting time and effort, increases network security and improves the overall user experience.
8. Regional Persistent Disk for High Availability
Regional Persistent Disk is a storage option that provides synchronous replication of data between two zones in a region. Regional Persistent Disks can be a great building block if you need to ensure high availability of your critical applications as they offer cost-effective durable storage and replication of data between two zones in the same region.
Regional Persistent Disks are also easy to set up within the Google Cloud Console. If you are designing robust systems or high availability services on Compute Engine, Regional Persistent Disks combined with other best practices such as backing up your data using snapshots enable you to build an infrastructure that is highly available and recoverable in a disaster. Regional Persistent Disks are also designed to work with regional managed instance groups. In the unlikely event of a zonal outage, Regional Persistent Disks allow continued I/O through failover of your workloads to another zone. Regional Persistent Disks can help meet zero RPO and near-zero RTO requirements and other stringent SLAs that your critical applications might require by maximizing application availability and protection of data during events such as host/VM failures and zonal outages.
9. Cloud Storage’s single namespace for dual-region and multi-region means managing regional replication is incredibly simple
Similar to how Persistent Disk makes data more available by replicating data across zones, Cloud Storage provides similar benefits for object storage. Cloud Storage within a region is cross-zone by definition, reducing the risk that a zonal outage would take down your application. Cloud Storage adds to this by also providing a cross-region option that can protect against a regional outage and gets your data closer to distributed users. This comes in the form of Dual-region or Multi-region settings for a bucket. These are the simplest to implement cross-region replication offerings in the industry—just a simple button or API call to enable them. In addition to being simple to implement, they offer an added advantage of using a single bucket name that spans regions.
This is unique in the industry. Competitive offerings currently require setting up and managing two distinct buckets, one in each region and they don’t offer the strong consistency properties Cloud Storage offers across regions. Operations and app development are burdened by this design. Google’s single namespace approach dramatically simplifies application development (the app runs on single region or dual/multi-region without any changes), and provides simpler application restarts and testing for DR.
10. Predictive autoscaling
Customers use predictive autoscaling to improve response times for applications with long initialization times or for applications with workloads that vary predictably with daily or weekly cycles. When you enable predictive autoscaling, Compute Engine forecasts future load based on your Managed Instance Group’s history and scales out the MIG’s in advance of predicted load, so that new instances are ready to serve when the load arrives. Without predictive autoscaling, an autoscaler can only scale a group reactively, based on observed changes in load in real time.
With predictive autoscaling enabled, the autoscaler works with real-time data as well as with historical data to cover both the current and forecasted load. Forecasts are refreshed every few minutes (faster than competing clouds) and consider daily and weekly seasonality, leading to more accurate forecasts of load patterns.
For more information, see How predictive autoscaling works and Checking if predictive autoscaling is suitable for your workload.
These are just a few examples of customer-centric innovation that set Google Cloud infrastructure apart. Bring your applications and let the platform work for you.
Get started by learning about your options for migration, or talk to our sales team to join the thousands of customers who have embarked upon this journey.
Acknowledgement
Special thanks to Dheeraj Konidena (Google) for contributing to this article.
More Relevant Stories for Your Company

BigQuery ML for Sentiment Analysis: How to Make the Most of Your Data
Introduction We recently announced BigQuery support for sparse features which help users to store and process the sparse features efficiently while working with them. That functionality enables users to represent sparse tensors and train machine learning models directly in the BigQuery environment. Being able to represent sparse tensors is a

Google Cloud Helps Northwell Health to Boost Caregiver Productivity and Access to Right Care Using AI
Lung cancer is the leading cause of cancer death in the United States and like any cancer, early detection is crucial to survival. Screening at-risk populations is an important part of reducing mortality, and if concerning nodules are found on imaging, further testing may be required. Today, we’ll share how

Measuring Deforestation in Extractive Supply Chains With ML
Introduction In my experience, I have observed that it’s common in machine learning to surrender to the process of experimenting with many different algorithms in a trial and error fashion, until you get the desired result. My peers and I at Google have a People and Planet AI YouTube series



Driving Business Transformation in Financial Services Using Google Cloud and AI/ML
These are challenging times with financial services institutions navigating the pandemic. Interest rates are an all-time low, and customer expectations are changing with the shift to digital. For example, digital banking has increased from 63 in 2019 to 72 percent today. Then regulatory requirements are evolving and compliance costs are
