





Measuring Deforestation in Extractive Supply Chains With ML
2565
Of your peers have already read this article.
2:30 Minutes
The most insightful time you'll spend today!
Introduction
In my experience, I have observed that it’s common in machine learning to surrender to the process of experimenting with many different algorithms in a trial and error fashion, until you get the desired result. My peers and I at Google have a People and Planet AI YouTube series where we talk about how to train and host a model for environmental purposes using Google Cloud and Google Earth Engine. Our focus is inspiring people to use deep learning, and if we could rename the series, we would call it AI for Minimalists since we would recommend artificial neural networks for most of our use cases. And so in this episode we give an overview of what deep learning is and how you can use it for tracking deforestation in supply chains. I also included a summary of the architecture and products you can use in this blog that I presented at the 2022 Geo For Good Summit. For those of you interested in diving even deeper into code, please visit our end-to-end sample (click “open in colab” at the bottom of the screen to view this tutorial in a notebook format).
What’s included in this article
- What is Deep Learning?
- Measuring deforestation in extractive supply chains with ML
- When to build a custom model outside of Earth Engine?
- How to build a model with Google Cloud & Earth Engine?
- Try it out!
What is Deep Learning?
Out of the many ML algorithms out there, I’m happy to share that deep learning or artificial neural networks is a technique that can be used for almost any supervised learning job.
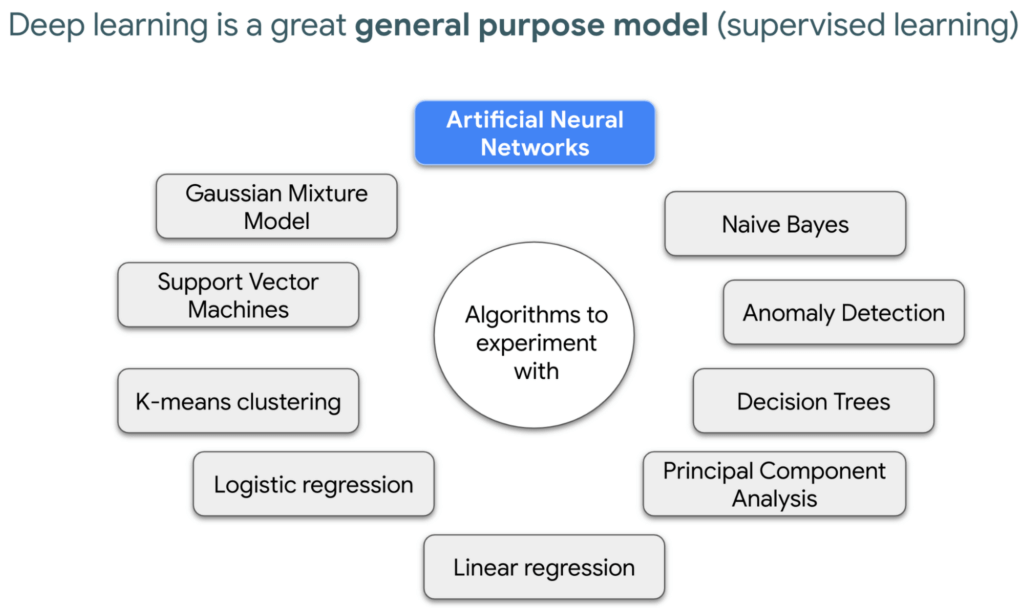
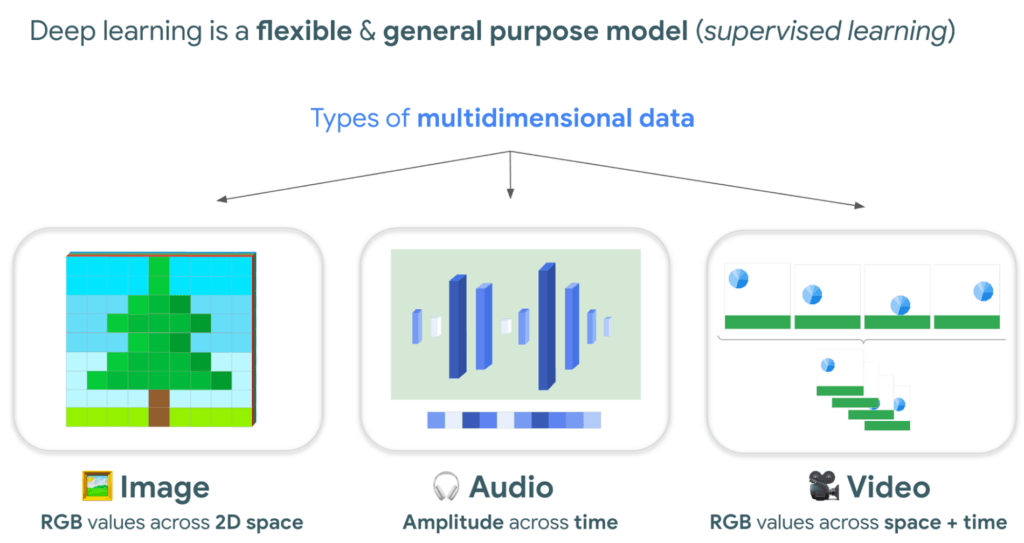
In supervised learning, you tell a computer the right answers to look for, through examples. Deep learning is very flexible, and is a great go-to algorithm. Especially for images, audio, or video files which are types of multidimensional data. This is because each of these data types have one or more dimensions with specific values for each point.
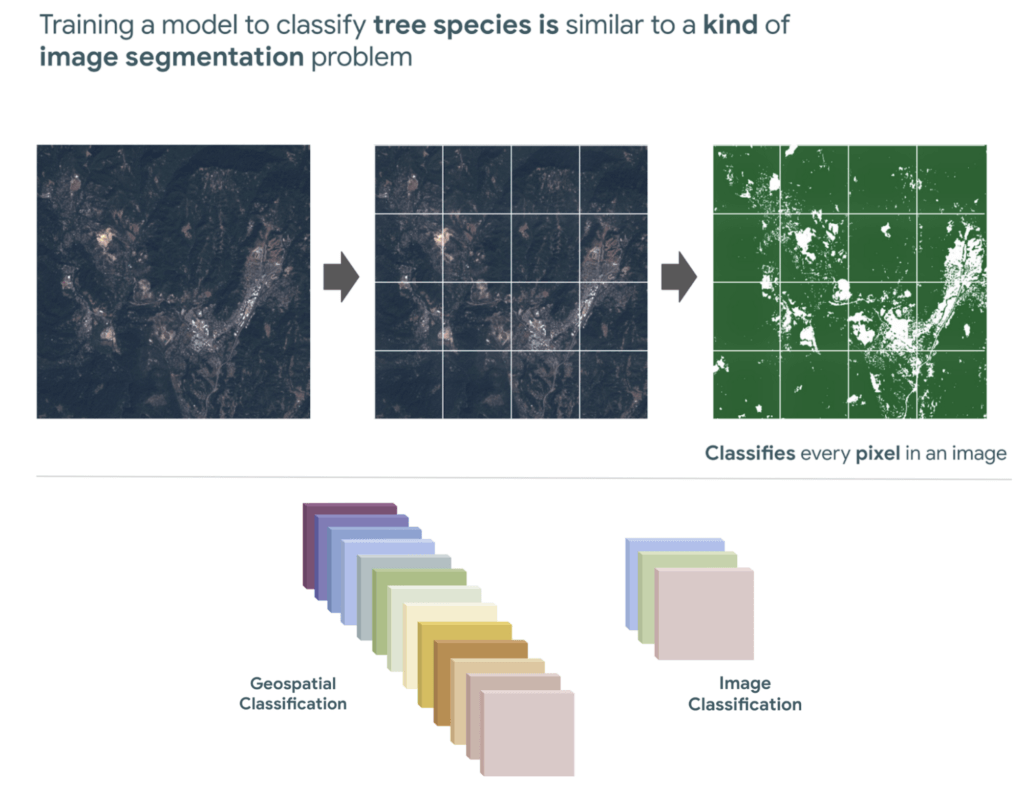
And training a model to classify tree species using satellite images is kind of like an image segmentation problem, where every pixel in the image is classified.
“Deep learning approaches problems differently”
David Cavazos, Developer Programs Engineer
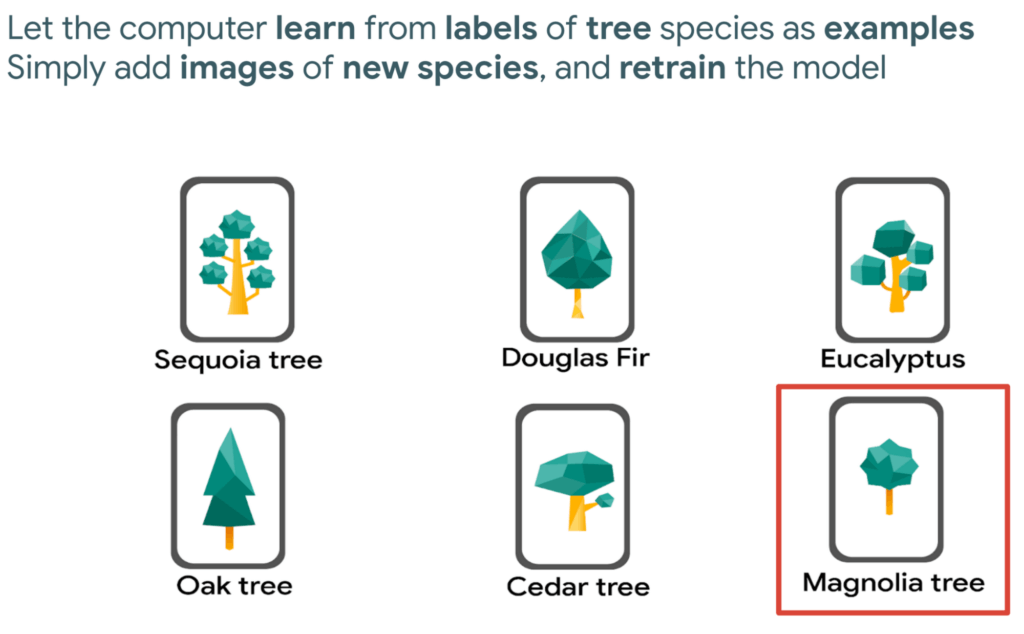
There’s no writing a function with explicit & sequential steps that reviews every single pixel one by one for every image, as traditional software development does. Let’s say you wish to build a model that classifies tree species. You don’t spend time coding all the instructions, but instead give a computer examples of images with tree species labels, and let it learn from these examples. And when you want to add more species, it’s as simple as adding new images of that species to retrain the model.
Measuring deforestation in extractive supply chains with ML
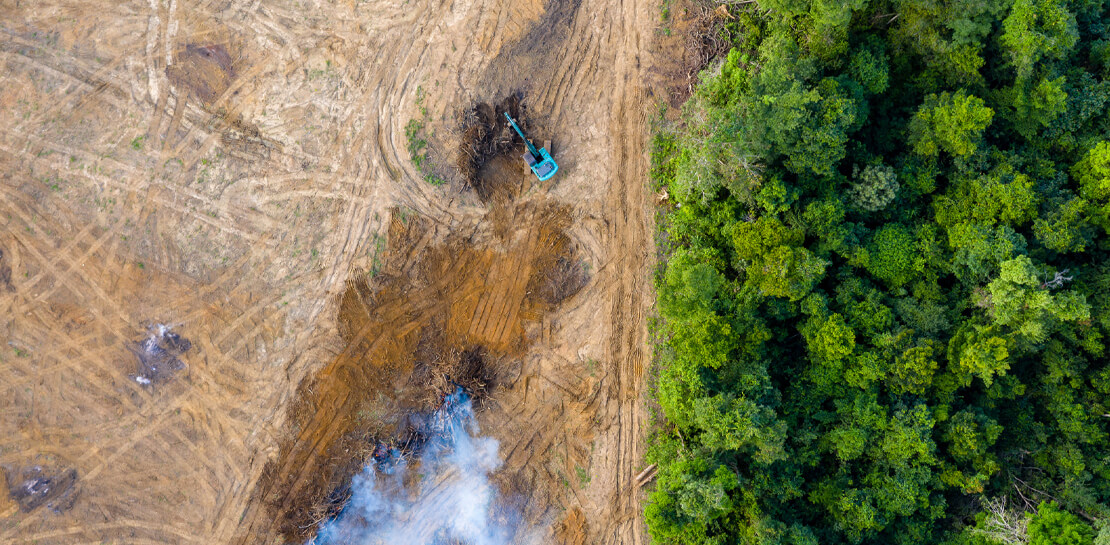
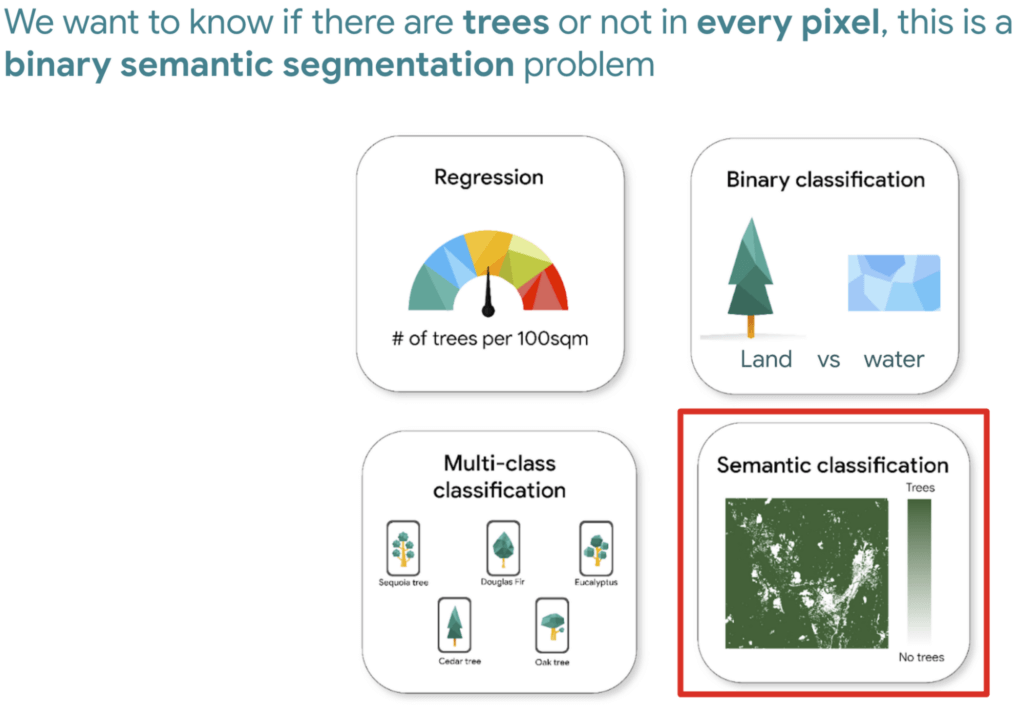
So let’s say we would like to measure deforestation using deep learning; to get started with building a model we first need a dataset that includes satellite images with an even amount of labels marking where there are trees and where there aren’t. Next, we choose a goal, here are a few common ones. In our case, we simply want to know if there are trees or not for every pixel, and so this would be a binary semantic segmentation problem.
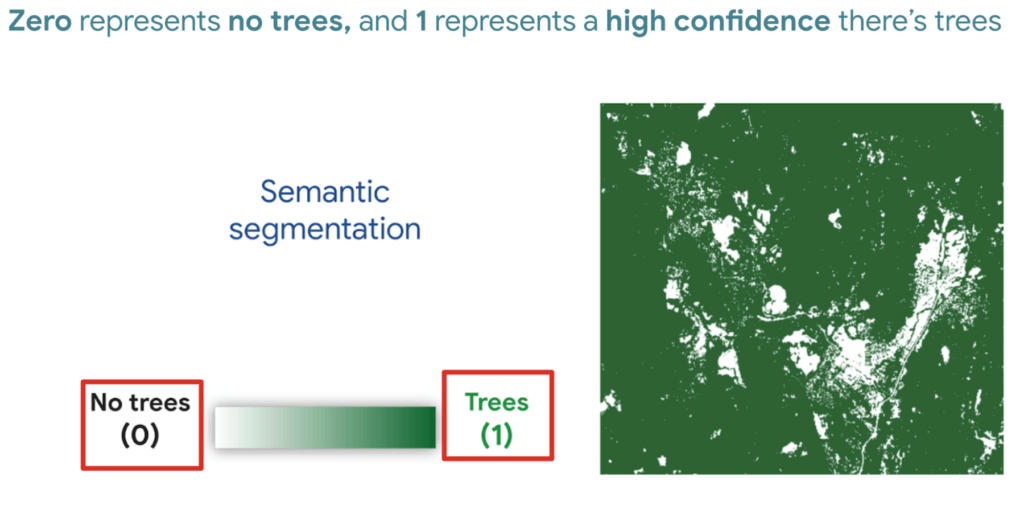
And based on this goal, we expect the outputs to be the percentage of trees for every pixel; as a number between 0 and 1. Zero represents no trees, and one represents a high confidence there are trees.
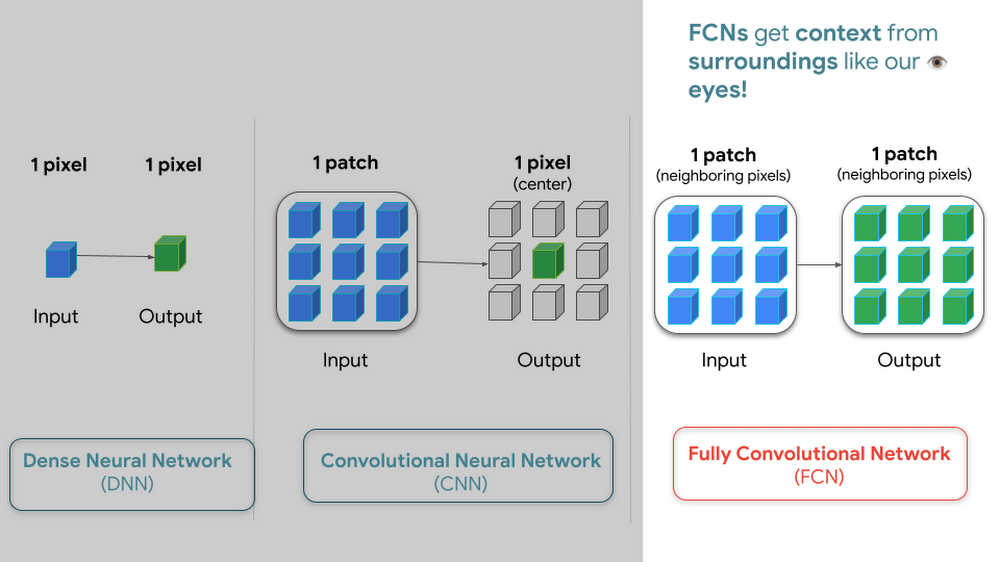
But how do we go from input images into probabilities of trees? Well think about it this way…there are many ways to approach this problem, here are 3 common ways of doing so. My peers and I prefer using Fully convolutional networks when building a map with ML predictions
And since a model is a collection of interconnected layers, we must come up with an arrangement of layers that transforms our data inputs based on our desired outputs. Each layer by the way has something called an activation function, which performs the transformations of each layer before it passes them to the next layer.
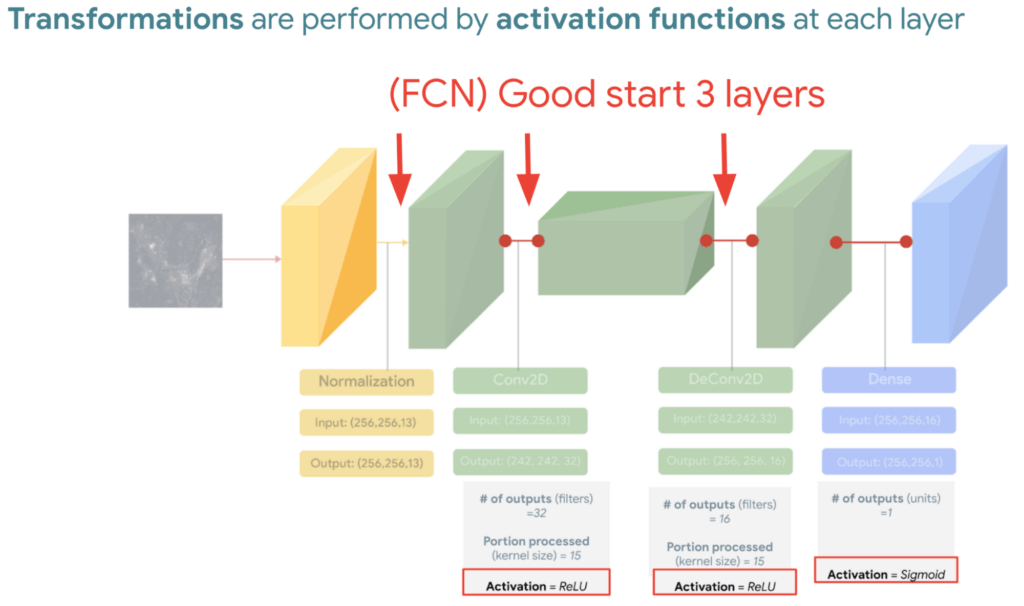
FYI Below is a handy dandy table, with our recommended activation and loss functions to choose from based on your goal. We hope this saves you time.
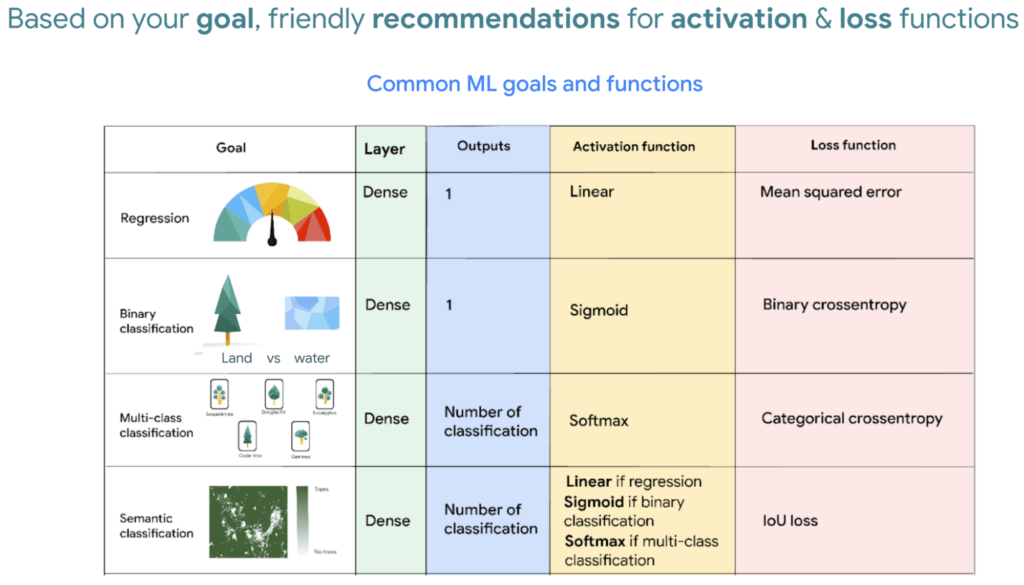
We then reach the fourth and last layer. Depending on our goals at the beginning, we also choose an appropriate loss function that helps us score how well the model did during training.
After choosing layers and functions you will split your data into training and validation datasets. Just remember that all of this work is about experimenting repeatedly until you reach desired results. Our 8min episode gives this overview more in detail.
When to build a custom model outside of Earth Engine
So now that we covered what is deep learning, the next step is understanding which tools to use to build our deforestation model. For starters it’s important to call out that Google Earth Engine is a wonderful tool that helps organizations of all sizes find insights about changes on the planet, in order to make a climate positive impact. It has built-in machine learning algorithms (classifiers) that let users quickly spin them up, with just a basic machine learning background. This is fantastic place to start when using ML on geospatial data, however there are multiple situations where you will want to opt to build a custom model such as:
- You want to use a popular ML library such as TensorFlow Keras.
- You wish to build a state of the art model to build a global and accurate land cover map product such as Google’s Dynamic World.
- Or because you generally have too much data to process that you can’t execute it in just one task in Earth Engine (and are trying to figure out hacky ways to export your data).
Whenever you identify with any of these options, you will want to roll up your sleeves and dive into building a custom model, which does require expertise and of course working with multiple products. But I have good news, using deep learning is a great go-to algorithm.
How to build a model with Google Cloud & Earth Engine?
To get started, you will need an account with Google Earth Engine which is free for non-commercial entities and Google Cloud account which has a free tier if you are just getting started for all users. I have broken up the products you would use by function.
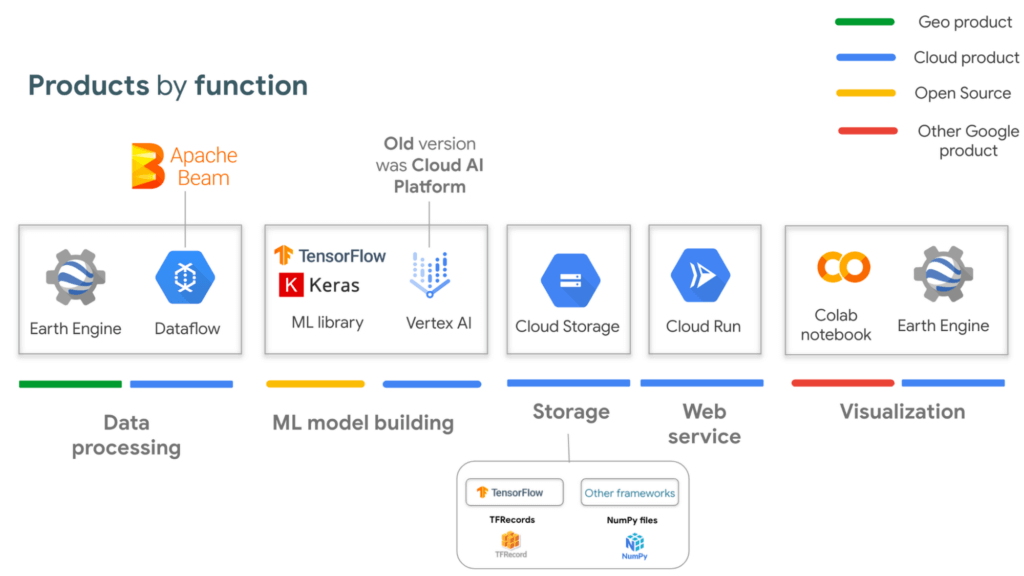
If you are interested in looking deeper into this overview, visit our slides here starting from slide 53 and read the speaker notes. Our code sample also walks through how to integrate with all of these projects end to end (just scroll down and click “open in colab”). But here is a quick visual summary. The main place to start is to identify which are the inputs and which are the outputs.
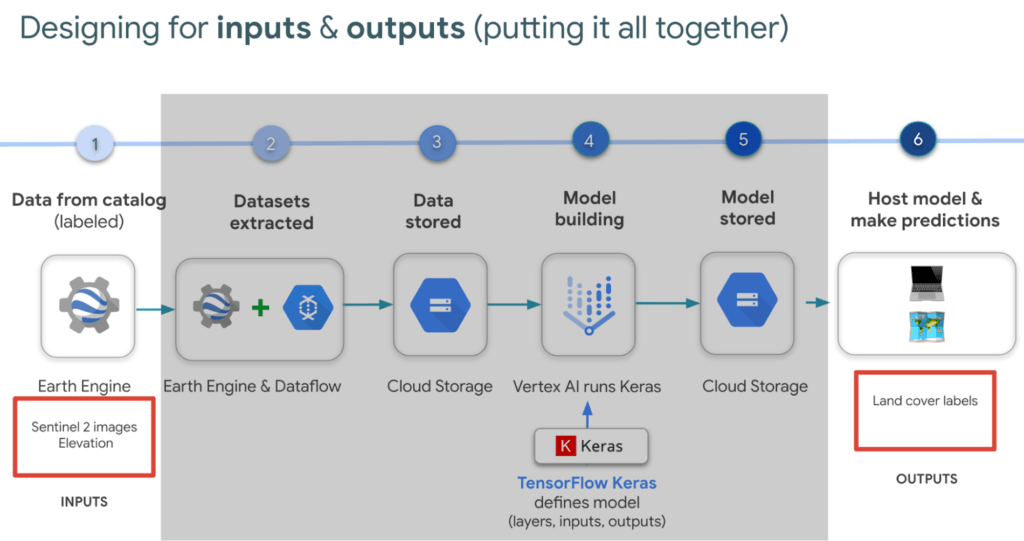
In our latest episodes for our People and Planet AI YouTube series, we walk through how to train a model and then host it in a relatively inexpensive web hosting platform called Cloud Run in episodes of less than 10mins.
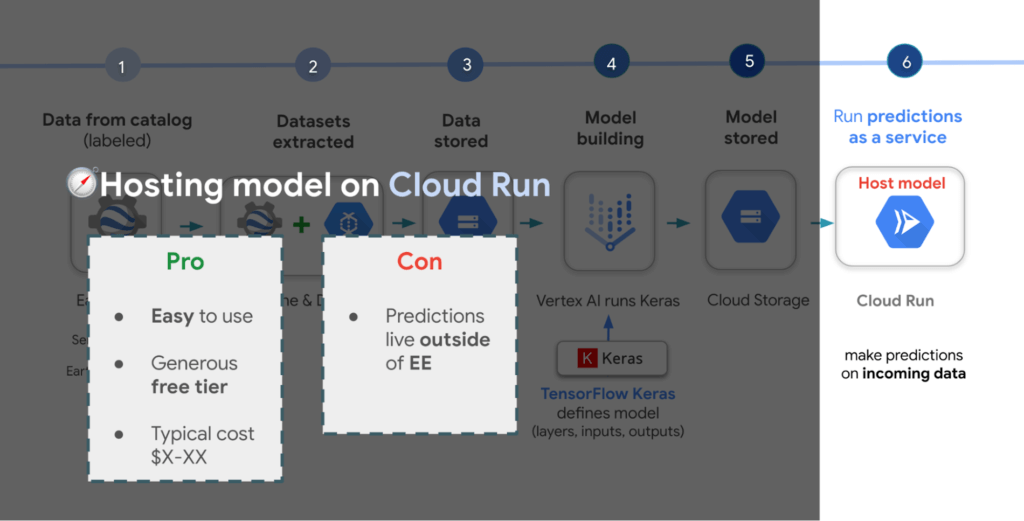
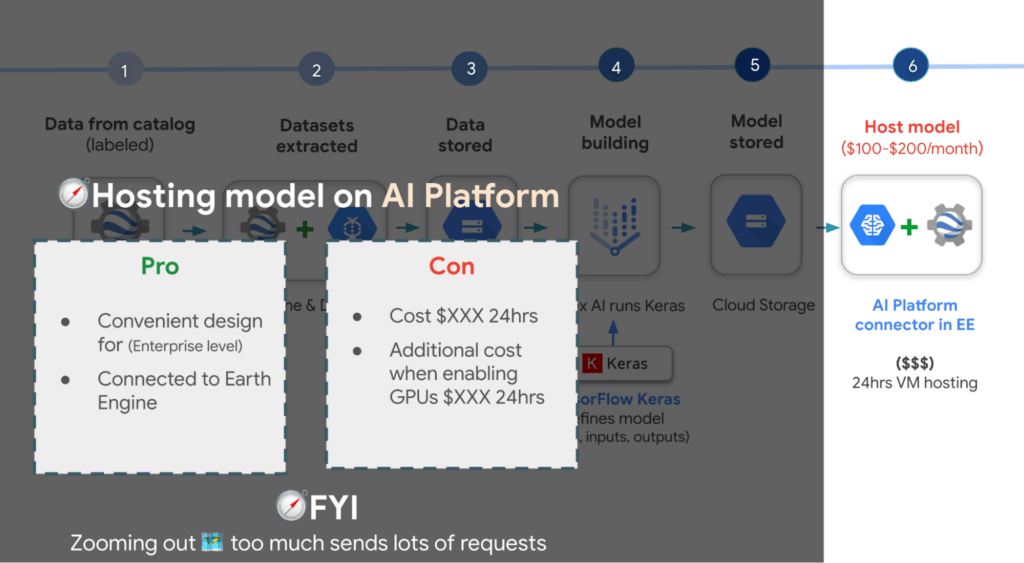
There are a few options presented in the slides, however the current best practice is to train a model using Vertex AI. Do note though that Google Earth Engine is currently not integrated with Vertex AI (we are working on this), but it is with the older (ML predecessor) called Cloud AI Platform (which is the recommended ML platform to use moving forward). As such, if you would like to import your model for detecting deforestation back into Earth Engine after training it in Vertex AI for example, you can host the model in Cloud AI Platform and get predictions. Just note that it’s a 24 hour paid service and so it can cost upwards of $100 or more a month to host your model to stream predictions. It also currently supports the following model building platforms if you don’t wish to use TensorFlow.
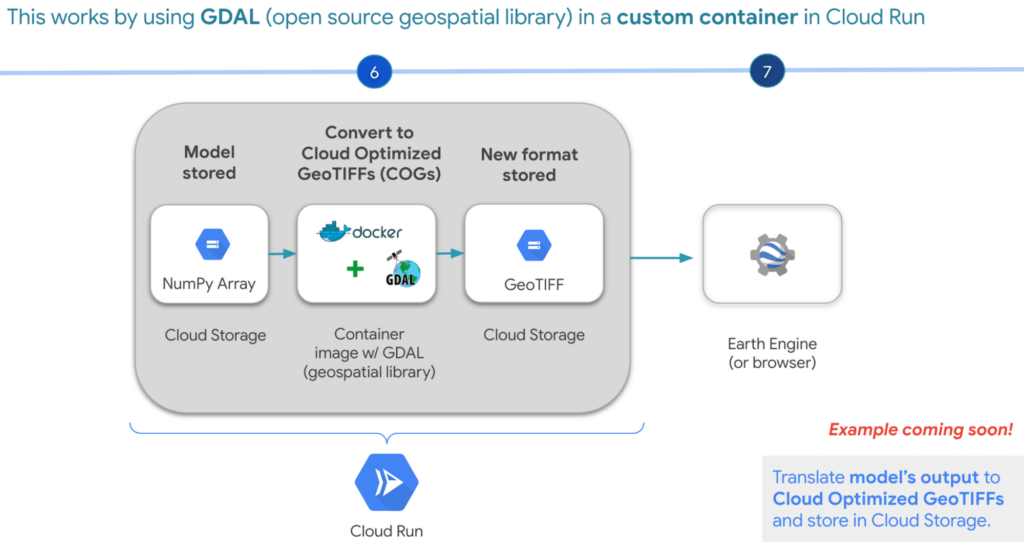
A cheaper alternative but without the convenience AI Platform offers is to manually translate the model’s output, which is NumPy Arrays into Cloud Optimized GeoTIFFs in order to load it back into Earth Engine using Cloud Run. Within this web service you would store the NumPy arrays into a Cloud Storage bucket, then spin up a container image with GDAL, an open source geospatial library in order to convert them into Cloud Optimized GeoTIFF files into Cloud Storage. This way you can view predictions from your browser or Earth Engine.
Try it out
This was a quick overview of deep learning and what Cloud products you can use to solve meaningful environmental challenges like detecting deforestation in extractive supply chains. If you would like to try it out, check out our code sample here (click “open in colab” at the bottom of the screen to view the tutorial in our notebook format or click this shortcut here).
BigQuery Helps Insurance Firms Leverage Previous Storm Data for Better Pricing Insights

8558
Of your peers have already read this article.
2:00 Minutes
The most insightful time you'll spend today!
It may be surprising to know that U.S. natural catastrophe economic losses totaled $119 billion in 2020, and 75% (or $89.4B) of those economic losses were caused by severe storms and cyclones. In the insurance industry, data is everything. Insurers use data to influence underwriting, rating, pricing, forms, marketing, and even claims handling. When fueled by good data, risk assessments become more accurate and produce better business results. To make this possible, the industry is increasingly turning to predictive analytics, which uses data, statistical algorithms, and machine learning (ML) techniques to predict future outcomes based on historical data. Insurance firms also integrate external data sources with their own existing data to generate more insight into claimants and damages. Google Cloud Public Datasets offers more than 100 high-demand public datasets through BigQuery that helps insurers in these sorts of data “mashups.”
One particular dataset that insurers find very useful is Severe Storm Event Details from the U.S. National Oceanic and Atmospheric Administration (NOAA). As part of the Google Cloud Public Datasets program and NOAA’s Public Data Program, this severe storm data contains various types of storm reports by state, county, and event type—from 1950 to the present—with regular updates. Similar NOAA datasets within the Google Cloud Public Datasets program include the Significant Earthquake Database, Global Hurricane Tracks, and the Global Historical Tsunami Database.
In this post, we’ll explore how to apply storm event data for insurance pricing purposes using a few common data science tools—Python Notebook and BigQuery—to drive better insights for insurers.
Predicting outcomes with severe storm datasets
For property insurers, common determinants of insurance pricing include home condition, assessor and neighborhood data, and cost-to-replace. But macro forces such as natural disasters—like regional hurricanes, flash floods, and thunderstorms—can also significantly contribute to the risk profile of the insured. Insurance companies can leverage severe weather data for dynamic pricing of premiums by analyzing the severity of those events in terms of past damage done to property and crops, for example.
It’s important to set the premium correctly, however, considering the risks involved. Insurance companies now run sophisticated statistical models, taking into account various factors—many of which can change over time. After all, without accurate data, poor predictions can lead to business losses, particularly at scale.
The Severe Storm Event Details database includes information about a storm event’s location, azimuth (an angle measurement used in celestial coordination), distance, impact, and severity, including the cost of damages to property and crops. It documents:
- The occurrence of storms and other significant weather events of sufficient intensity to cause loss of life, injuries, significant property damage, and/or disruption to commerce.
- Rare, unusual weather events that generate media attention, such as snow flurries in South Florida or the San Diego coastal area.
- Other significant weather events, such as record maximum or minimum temperatures or precipitation that occur in connection with another event.
Data about a specific event is added to the dataset within 120 days to allow time for damage assessments and other analysis.
Driving business insights with BigQuery and notebooks
Google Cloud’s BigQuery provides easy access to this data in multiple ways. For example, you can query directly within BigQuery and perform analysis using SQL.
Another popular option in the data science and analyst community is to access BigQuery from within the Notebook environment to intersperse Python code and SQL text, and then perform ad hoc experimentation. This uses the powerful BigQuery compute to query and process huge amounts of data without having to perform the complex transformations within the memory in Pandas, for example.
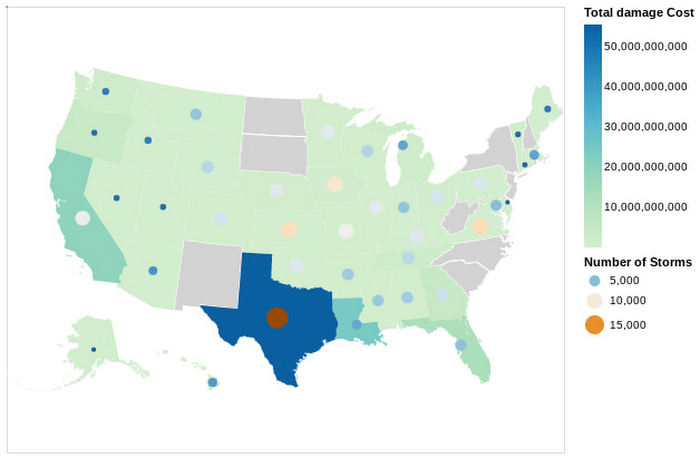
In this Python notebook, we have shown how the severe storm data can be used to generate risk profiles of various zip codes based on the severity of those events as measured by the damage incurred. The severe storm dataset is queried to retrieve a smaller dataset into the notebook, which is then explored and visualized using Python. Here’s a look at the risk profiles of the zip codes:
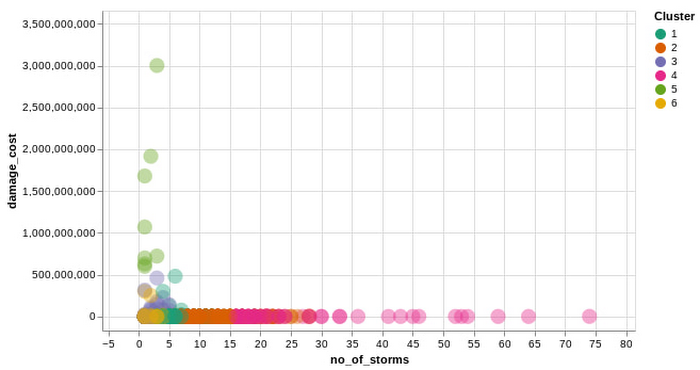
Another Google Cloud resource for insurers is BigQuery ML, which allows them to create and execute machine learning models on their data using standard SQL queries. In this notebook, with a K-Means Clustering algorithm, we have used BigQuery ML to generate different clusters of zip codes in the top five states impacted by severe storms. These clusters show different levels of impact by the storms, indicating different risk groups.
The example notebook is a reference guide to enable analysts to easily incorporate and leverage public datasets to augment their analysis and streamline the journey to business insights. Instead of having to figure out how to access and use this data yourself, the public datasets, coupled with BigQuery and other solutions, provide a well-lit path to insights, leaving you more time to focus on your own business solutions.
Making an impact with big data
Google Cloud’s Public Datasets is just one resource within the broader Google Cloud ecosystem that provides data science teams within the financial services with flexible tools to gather deeper insights for growth. The severe storm dataset is a part of our environmental, social, and governance (ESG) efforts to organize information about our planet and make it actionable through technology, helping people make a positive impact together.
To learn more about this public dataset collaboration between Google Cloud and NOAA, attend the Dynamic Pricing in Insurance: Leveraging Datasets To Predict Risk and Price session at the Google Cloud Financial Services Summit on May 27. You can also check out our recent blog and explore more about BigQuery and BigQuery ML.
A Look Back on Google Cloud’s Data Analytics Development Efforts from June

5961
Of your peers have already read this article.
4:00 Minutes
The most insightful time you'll spend today!
June is the month that holds the summer solstice, and some of us in the northern hemisphere get to enjoy the longest days of sunshine out of the entire year. We used all the hours we could in June to deliver a flurry of new features across BigQuery, Dataflow, Data Fusion, and more. Let’s take a look!
Simple, Sophisticated, and Secure
Usability is a key tenant of our data analytics development efforts. Our new user-friendly BigQuery improvements this month include:
- Flexible data type casting
- Formatting to change column descriptions
- GRANT/REVOKE access control commands using SQL
We hope this will delight data analysts, data scientists, DBAs, and SQL-enthusiasts who can find out more details in our blog here.
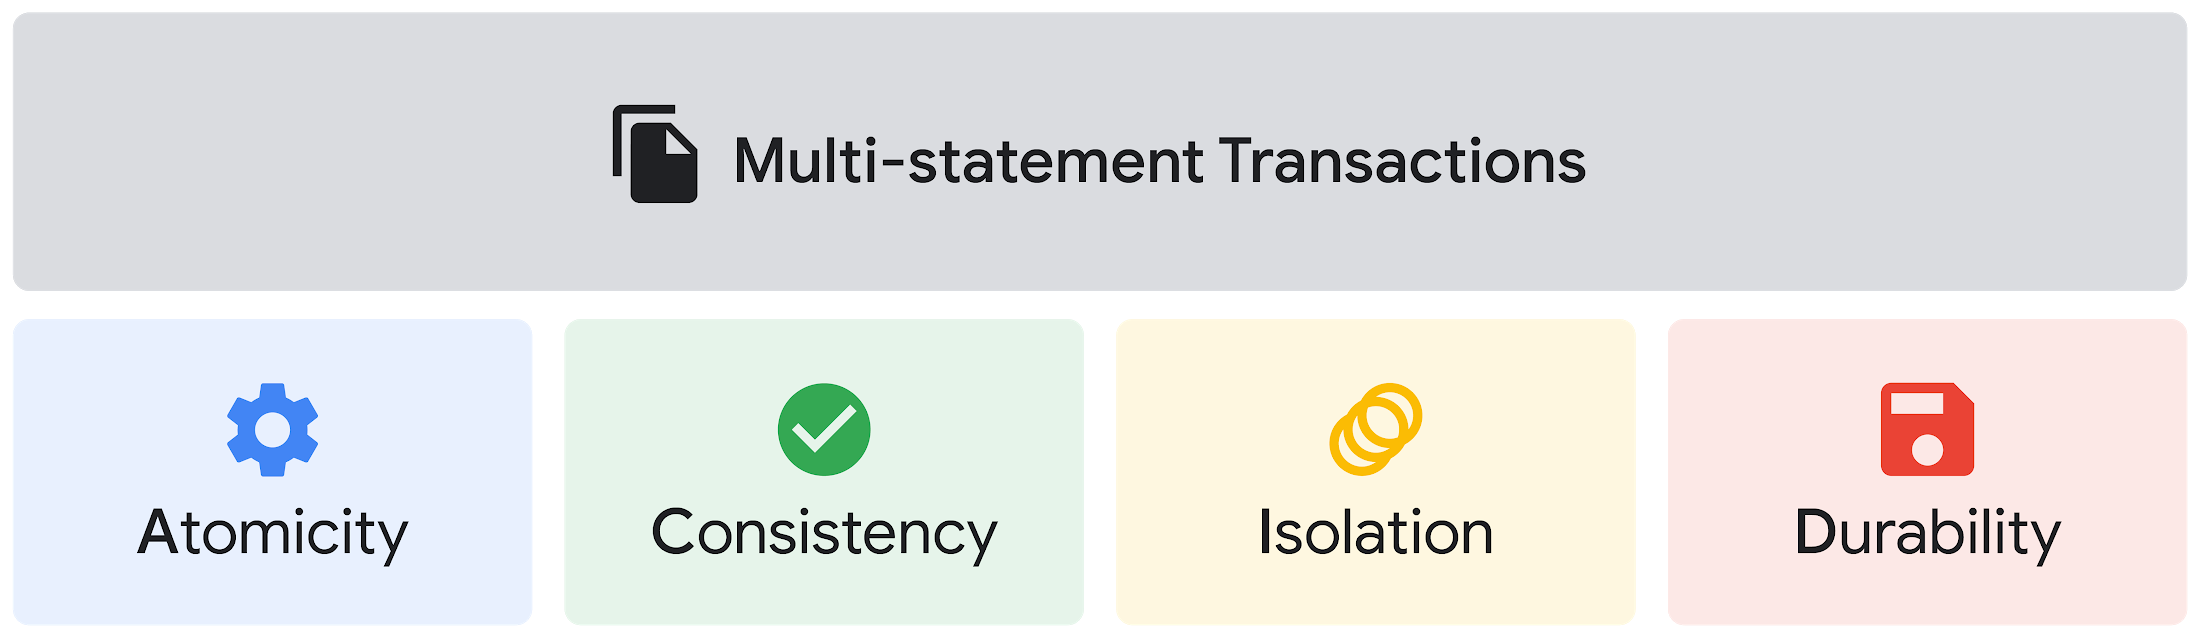
Beyond simplifying commands, we also recognize that it’s equally important to have more sophistication when dealing with transactions. That’s why we introduced multi-statement transactions in BigQuery.
As you probably know, BigQuery has long supported single-statement transactions through DML statements, such as INSERT, UPDATE, DELETE, MERGE and TRUNCATE, applied to one table per transaction. With multi-statement transactions, you can now use multiple SQL statements, including DML, spanning multiple tables in a single transaction.
This means that any data changes across multiple tables associated with all statements in a given transaction are committed atomically (all at once) if successful—or all rolled back atomically in the event of a failure.
We also know that organizations need to control access to data, down to the granular level and that, with the complexity of data platforms increasing day by day, it’s become even more critical to identify and monitor who has access to sensitive data.
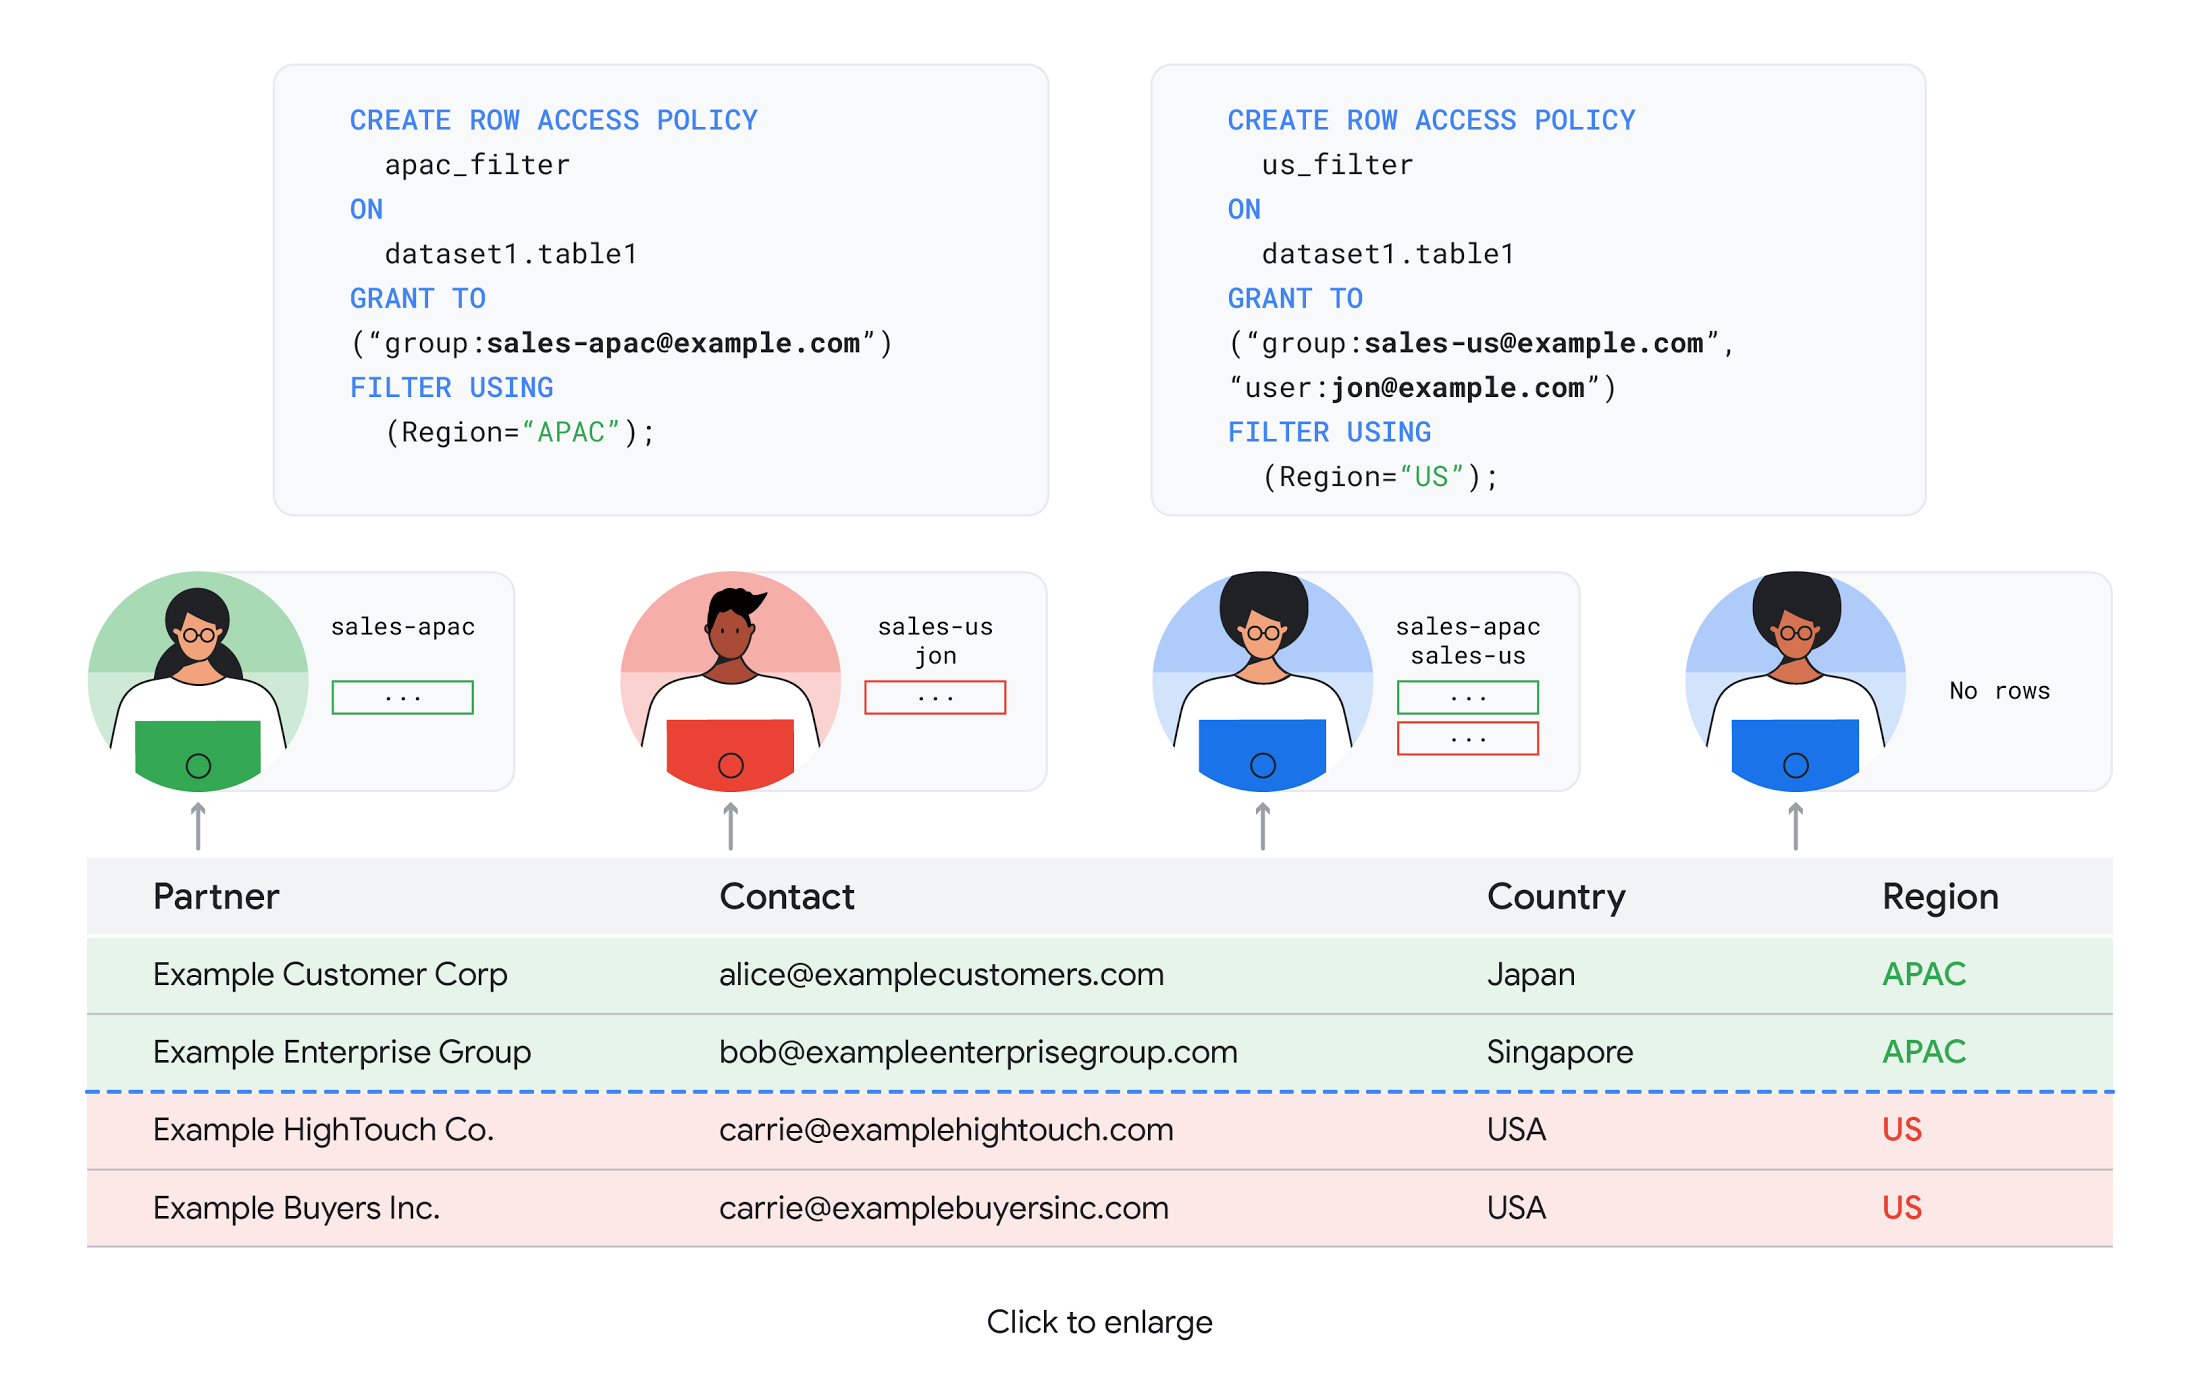
To help address these needs, we announced the general availability of BigQuery row-level security. This capability gives customers a way to control access to subsets of data in the same table for different groups of users. Row-level security in BigQuery enables different user personas access to subsets of data in the same table and can easily be created, updated, and dropped using DDL statements. To learn more, check out the documentation and best practices.
Simple, Safe, and Smart
Beyond building a simpler, more sophisticated and more secure data platform for customers, our team has been focused on providing solutions powered by built-in intelligence. One of our core beliefs is that for machine learning to be adopted and useful at scale, it must be easy to use and deploy.
BigQuery ML, our embedded machine learning capabilities, have been adopted by 80% of our top customers around the globe and it has become a cornerstone of their data to value journey.
As part of our efforts, we announced the general availability of AutoML tables in BigQuery ML. This no-code solution lets customers automatically build and deploy state-of-the-art machine learning models on structured data. With easy integration with Vertex AI, AutoML in BQML makes it simple to achieve machine learning magic in the background. From preprocessing data to feature engineering and model tuning all the way to cross validation, AutoML will “automagically” select and ensemble models so everyone—even non-data scientists—can use it.
Want to take this feature for a test drive? Try it today on BigQuery’s NYC Taxi public dataset following the instructions in this blog!
Speaking of public datasets, we also introduced the availability of Google Trends data in BigQuery to enable customers to measure interest in a topic or search term across Google Search. This new dataset will soon be available in Analytics Hub and will be anonymized, indexed, normalized, and aggregated prior to publication.
Want to ensure your end-cap displays are relevant to your local audience? You can take signals from what people are looking for in your market area to inform what items to place. Want to understand what new features could be incorporated into an existing product based on what people are searching for? Terms that appear in these datasets could be an indicator of what you should be paying attention to.
All this data and technology can be put to use to deploy critical solutions to grow and protect your business. For example, it can be difficult to know how to define anomalies during detection. If you have labeled data with known anomalies, then you can choose from a variety of supervised machine learning model types that are already supported in BigQuery ML.
But what if you don’t know what kind of anomaly to expect, and you don’t have labeled data? Unlike typical predictive techniques that leverage supervised learning, organizations may need to be able to detect anomalies in the absence of labeled data.
That’s why, we were particularly excited to announce the public preview of new anomaly detection capabilities in BigQuery ML that leverage unsupervised machine learning to help you detect anomalies without needing labeled data.
Our team has been working with a large number of enterprises who leverage machine learning for better anomaly detection. In financial services for example, customers have used our technology to detect machine-learned anomalies in real-time foreign exchange data.
To make it easier for you to take advantage of their best practices, we teamed up with Kasna to develop sample code, architecture guidance, and a data synthesizer that generates data so you can test these innovations right away.
Simple, Scalable, and Speedy
Capturing, processing and analyzing data in motion has become an important component of our customer architecture choices. Along with batch processing, many of you need the flexibility to stream records into BigQuery so they can become available for query as they are written.
Our new BigQuery Storage Write API combines the functionality of streaming ingestion and batch loading into a single API. You can use it to stream records into BigQuery or even batch process an arbitrarily large number of records and commit them in a single atomic operation.
Flexible systems that can do batch and real-time in the same environment is in our DNA: Dataflow, our serverless, data processing service for streaming and batch data was built with flexibility in mind.
This principle applies not just to what Dataflow does but also how you can leverage it—whether you prefer using Dataflow SQL right from the BigQuery web UI, Vertex AI notebooks from the Dataflow interface, or the vast collection of pre-built templates to develop streaming pipelines.
Dataflow has been in the news quite a bit recently. You might have noted the recent introduction of Dataflow Prime, a new no-ops, auto-tuning functionality that optimizes resource utilization and further simplifies big data processing. You might have also read that Google Dataflow is a Leader in The 2021 Forrester Wave™: Streaming Analytics, giving Dataflow a score of 5 out of 5 across 12 different criteria.
We couldn’t be more excited about the support the community has provided to this platform. The scalability of Dataflow is unparalleled and as you set your company up for more scale, more speed, and “streaming that screams”, we suggest you take a look at what leaders at Sky, RVU or Palo Alto Networks have already accomplished.
If you’re new to Dataflow, you’re in for a treat: this past month, Priyanka Vergadia (AKA CloudGirl) released a great set of resources to get you started. Read her blog here and watch her introduction video below!
https://youtube.com/watch?v=WRspZRG9e90%3Fenablejsapi%3D1%26
Simple structure that sticks together
We thrive to be the partner of choice for your transformation journey, regardless where your data comes from and how you choose to unify your data stack.
Our partners at Tata Consultancy Services (TCS) recently released research that highlights the importance of a unifying digital fabric and how data integration services like Google Cloud Data Fusion can enable their clients to achieve this vision.
We also announced SAP Integration with Cloud Data Fusion, Google Cloud’s native data integration platform, to seamlessly move data out of SAP Business Suite, SAP ERP and S4/HANA. To date, we provide more than 50 pipelines in Cloud Data Fusion to rapidly onboard SAP data.
This past month, we introduced our SAP Accelerator for Order to Cash. This accelerator is a sample implementation of the SAP Table Batch Source feature in Cloud Data Fusion and will help you get started with your end-to-end order to cash process and analytics.
It includes sample Cloud Data Fusion pipelines that you can configure to connect to your SAP data source, perform transformations, store data in BigQuery, and set up analytics in Looker. It also comes with LookML dashboards which you can access on Github.
Countless great organizations have chosen to work with Google for their SAP data. In June, we wrote about ATB Financial’s journey and how the company uses data to better serve over 800,000 customers, save over CA$2.24 million in productivity, and realize more than CA$4 million in operating revenue through “D.E.E.P”, a data exposure enablement platform built around BigQuery.
Finally, if you are an application developer looking for a unified platform that brings together data from Firebase Crashlytics, Google Analytics, Cloud Firestore, and third party datasets, we have good news!
This past month, we released a unified analytics platform that combines Firebase, BigQuery, Google Looker and FiveTran to easily integrate disparate data sources, and infuse data into operational workflows for greater product development insights and increased customer experience. This resource comes with sample code, a reference guide and a great blog! We hope you enjoy it. See you all next month!
https://youtube.com/watch?v=L25Vfzr2Ciw%3Fenablejsapi%3D1%26
S4 Agtech Transforms Agriculture with Google Cloud

7491
Of your peers have already read this article.
8:30 Minutes
The most insightful time you'll spend today!
Like countless other industries, farming is going digital and undergoing big changes—driven by access to more actionable information. The agriculture business can now gather and analyze georeferenced data from satellites, combined with data from IoT sensors in fields, crop rotation and yield histories, weather patterns, seed genotypes and soil composition to help increase the quantity and quality of crops.
This is essential for businesses in the agriculture industry, but it’s also critical to address growing food shortages around the world.
At S4, we create technology to de-risk crop production. We provide customers seeking agricultural risk management solutions with the tools to make better, data-driven decisions for their crop planning, based on machine learning and proprietary algorithms.
We interpret plant evolution on a global scale with predictive modeling and analytics, and offer super-efficient risk-transferring solutions. Our multi-cloud platform includes a petabyte-scale database, an open source stack, and—after 50 proof-of-concept evaluations—BigQuery for our data warehouse and the Cloud SQL database service to handle OLTP queries to our PostgreSQL database.
These PoCs included, among others, Microsoft Azure Data Lake Analytics, IBM Netezza, Postgres/PostGIS running on IBM bare-metal servers with SATA SSDs and on Google’s Compute Engine with NVMe disks, and on-premises memSQL, CitusData and Yandex ClickHouse.
Weeding out risk in an uncertain market
According to recent research, climate extreme events like drought, heat waves, and heavy precipitation are responsible for 18-43% of global variation in crop yields for maize, spring wheat, rice, and soybeans. This is a clear trend for other crops as well. Such variation poses risks of food shortages as well as large financial risks to farmers, insurers, and regions dependent on successful crop yields. Also, it creates vast humanitarian difficulties.
Our mission at S4 is to help de-risk crop production by matching the right data with analytics tools so farmers and other participants in the agricultural value chain can plan better, resulting in more reliable food supplies.
In a nutshell, we create indices out of biological assets. These indices measure yield losses on crops that are caused by the effects of weather and other factors, which are then used as underlying assets for products, such as swap/derivative contracts and parametric insurance policies, to transfer risk to the financial markets.
We enable insurers and lenders to buy and sell agricultural risks through the futures market. Also, our other products help farmers and seed and fertilizer companies provide customized genotype recommendations and fertilization requirements. This helps to optimize planting by geography, resources, and crop species, monitor phenological, pests and humidity evolution throughout the crop season, and estimate yields.
Local communities benefit from S4’s technology, as the ability to manage weather risks allows farmers to stabilize their cash flows, invest more to produce more with fewer risks, and develop in a more sustainable manner.
Growing data sources, reducing costs, accelerating performance
With the volume of diverse data sources and analytical complexity both growing at a very fast pace, we decided that using a major cloud services provider with a broad roadmap and global partnerships would be beneficial to S4’s future evolution.
At the same time, we wanted to bring our services to users faster and cut costs by consolidating our on-premises technology stack. When we started evaluating providers, our leading criteria included a powerful geospatial database and data analytics tools along with excellent support, all at a competitive price. GCP prevailed in nearly all criteria categories among the 50 companies we measured.
Our previous platform architecture included a hybrid relational database that used Compute Engine for virtual machines and Cloud Storage for database backup. The RDBMS was slow. Maintaining our own data warehouse was complex and expensive.
We wanted to use machine learning and neural networks, but couldn’t do so easily and affordably. The complexity of that system meant that products or services requiring small changes or additions to the data model translated to expensive expansions of infrastructure or project time.
Also, agronomical or product teams couldn’t test these changes by themselves, always requiring the intervention on no small part of the IT team, which led to further delays.
We added GCP services like BigQuery as S4’s cloud data warehouse and use BigQuery GIS for geospatial analysis, Cloud Dataflow for simplified stream and batch data processing, and Cloud SQL for queries to the S4 database platform, which have all made a huge impact on our services and bottom line.
Database and analytics costs have decreased by 40% and customers are receiving our analytical results 25% faster. In addition, we’ve eliminated the time-consuming downloading of images, reducing storage and processing costs by 80%, because we no longer need expensive tools licenses, and have greatly reduced classification processing times.
Our customers working in the agriculture industry are also benefiting from this infrastructure change. They are now able to speed up their data analytics using our GCP-based platform.
“S4 products and technologies unlock the full potential of satellite imagery for crop prescriptions, monitoring and yield estimates,” says Nicolás Loria, Manager of Marketing Services, Southern Cone, Corteva Agriscience.
“We’ve worked with S4 for the last three (and starting year number four) crop seasons as its team capabilities, data integration capacities, and analytics insights have allowed Corteva to perform an entire new solution. Thanks to S4’s customized 360° approach, fast response and delivery times, we have safely outsourced our remote crop analytic technical needs.”
Also, this new architecture has allowed us to scale our models and databases with almost no limits, at a fraction of the cost vs. the previous models.
We’ve saved a lot of time on executing processes and reduced work needed by our internal teams to do certain tasks, like preparing images, converting them, validating results, and more. Using Google Earth Engine has decreased the execution time of daily tasks anywhere from 50% to 90% of the previous time, going from an average time of 30 minutes to between four and 15 minutes, depending on the task.
In addition to saving money and time, we are able to focus on innovation with the GCP performance and features we’re using. We’re able to seamlessly add satellite data to analytics using both public datasets and our own private data, and deliver GIS data management, analytics, crop classification and monitoring in real time.
We can do semi-automatic crop classification and classification using spectral signatures with Google Earth Engine. Later this year, we’ll be using neural networks for pattern recognition and machine learning in new applications to improve crop yields and fine-tune risk models. And using GCP and Google Earth Engine infrastructure means we can run models for customers in South America and around the world, since Google Earth Engine has global satellite imagery available.
We’ve heard from our customer Indigo Argentina that they’re able to bring customers data insights faster.
“We are working with S4 in the development of two different applications for satellite crop monitoring and yield assessment,” says Carlos Becco, CEO, Indigo Argentina. “S4’s technology allowed us to manage and analyze multiple sources and layers of information in real time, letting us uncover valuable insights in Indigo’s own microbiome technologies, and at a very competitive cost.”
Analytical products and app development thrive with GCP
With GCP, we are updating and improving algorithms that we built manually with machine learning processes to develop drought indices for upcoming crop seasons. Algorithms can recognize specific phases of crop phenology (e.g., bud burst, flowering, fruiting, leaf fall) and correlate them with photosynthetic activity, light, water, temperature, radiation, and plant genetics factors. Other analytical products like crop monitoring, pre-planting recommendations, financial scoring, and yield estimation can now do a lot more for users by offering multiple layers and datasets, faster image processing, and real-time access via APIs.
We also replaced our bare-metal S4 app deployment with the App Engine serverless application platform. It provides tighter integration between the S4 platform and our BigQuery data warehouse for integration with marketplaces and third-party solutions.
We get all of these Google Cloud features with all the benefits of managed cloud services, from multiversioning and security to automatic backups and high availability.
At S4, we trust technology to decode plant growth and help protect farmers and their communities from climate change. With growing food shortages due to increasing populations and intensifying weather, data and analytics can have a huge impact in lowering financial risks and improving agricultural yields. It’s one sector where cloud, database, analytics, and other technologies are combining to improve business outcomes and affect the lives of billions of people. Learn more about S4’s work and learn more about data analytics on Google Cloud.
3097
Of your peers have already watched this video.
48:30 Minutes
The most insightful time you'll spend today!
Responsible AI: From Theory to Practice
In less than 10 years, AI will be the number one driver of global GDP growth. And organizations that achieve AI absorption will be the leaders of the global economy.
But as fast as AI is progressing, it also requires more care and attention from a responsibility standpoint. A more accurate and powerful vision AI technology, for example, when used in a harmful way can lead to harmful and intentional misuse, unintentional failure modes, and loss of personal privacy contributing to severe, real-life consequences for individuals.
Listen to Tracy Frey, Director, Product Strategy & Operations, Cloud AI – Google Cloud discuss implementing AI Principles into well-known products. Hear approaches in place for applying AI Principles in the product development process, including user research, product design, product reviews, testing, documentation, and marketing.
Transcend from Prototype to Production: Train Your ML models with Vertex AI

2615
Of your peers have already read this article.
1:30 Minutes
The most insightful time you'll spend today!
You’re working on a new machine learning problem, and the first environment you use is a notebook. Your data is stored on your local machine, and you try out different model architectures and configurations, executing the cells of your notebook manually each time. This workflow is great for experimentation, but you quickly hit a wall when it comes time to elevate your experiments up to production scale. Suddenly, your concerns are more than just getting the highest accuracy score.
Sound familiar?
Developing production applications or training large models requires additional tooling to help you scale beyond just code in a notebook, and using a cloud service provider can help. But that process can feel a bit daunting.
To make things a little easier for you, we’ve created the Prototype to Production video series, which covers all the foundational concepts you’ll need in order to build, train, scale, and deploy machine learning models on Google Cloud using Vertex AI.
Let’s jump in and see what it takes to get from prototype to production!
Getting started with Notebooks for machine learning
Episode one of this series shows you how to create a managed notebook using Vertex AI Workbench. With your environment set up, you can explore data, test different hardware configurations, train models, and interact with other Google Cloud services.
Storing data for machine learning
When working on machine learning problems, it’s easy to be laser focused on model training. But the data is where it all really starts.
If you want to train models on Vertex AI, first you need to get your data into the cloud. In episode 2, you’ll learn the basics of storing unstructured data for model training and see how to access training data from Vertex AI Workbench.
Training custom models on Vertex AI
You might be wondering, why do I need a training service when I can just run model training directly in my notebook? Well, for models that take a long time to train, a notebook isn’t always the most convenient option. And if you’re building an application with ML, it’s unlikely that you’ll only need to train your model once. Over time, you’ll want to retrain your model to make sure it stays fresh and keeps producing valuable results.
Manually executing the cells of your notebook might be the right option when you’re getting started with a new ML problem. But when you want to automate experimentation at scale, or retrain models for a production application, a managed ML training option will make things much easier.
Episode 3 shows you how to package up your training code with Docker and run a custom container training job on Vertex AI. Don’t worry if you’re new to Docker! This video and the accompanying codelab will cover all the commands you’ll need.
CODELAB: Training custom models with Vertex AI
How to get predictions from an ML model
Machine learning is not just about training. What’s the point of all this work if we don’t actually use the model to do something?
Just like with training, you could execute predictions directly from a notebook by calling model.predict. But when you want to get predictions for lots of data, or get low latency predictions on the fly, you’re going to need something more than a notebook. When you’re ready to use your model to solve a real world problem with ML, you don’t want to be manually executing notebook cells to get a prediction.
In episode 4, you’ll learn how to use the Vertex AI prediction service for batch and online predictions.
CODELAB: Getting predictions from custom trained models
Tuning and scaling your ML models
By this point, you’ve seen how to go from notebook code, to a deployed model in the cloud. But in reality, an ML workflow is rarely that linear. A huge part of the machine learning process is experimentation and tuning. You’ll probably need to try out different hyperparameters, different architectures, or even different hardware configurations before you figure out what works best for your use case.
Episode 5, covers the Vertex AI features that can help you with tuning and scaling your ML models. Specifically, you’ll learn about hyperparameter tuning, distributed training, and experiment tracking.
CODELAB: Hyperparameter tuning on Vertex AI
CODELAB: Distributed Training on Vertex AI
We hope this series inspires you to create ML applications with Vertex AI! Be sure to leave a comment on the videos if you’d like to see any of the concepts in more detail, or learn how to use the Vertex AI MLOps tools.
If you’d like try all the code for yourself, check out the following codelabs:
More Relevant Stories for Your Company

How Google Cloud Helps SAP Admins Create Scalable, Secure Networks
SAP forms the critical backbone of thousands of enterprises, supporting critical business functions such as finance, supply chain, warehouse management, and more. Google Cloud provides a highly scalable and resilient infrastructure to run such workloads and offers tools, such as Smart Analytics and Machine Learning that can accelerate your organization’s digital transformation. In fact, a
A Road to Possibilities: Google Maps Platform Website
For more than 15 years, developers have used Google Maps Platform to deliver location-based experiences to their end users and used location intelligence to optimize their businesses. Along this journey, we’ve made a variety of changes to better support our community as needs have changed and new industries and technologies

Speak Now to Book a Flight: easyJet’s Uses AI to Improve Customer Experience
With a growing fleet of 325 aircraft that cover more than 1,000 routes across 158 airports, easyJet is one of Europe’s most popular airlines. And easyJet serves an average of 90 million passengers each year, so a helpful mobile experience for its customers is a top priority. Travellers today are

Marks & Spencer Aims to Bring a Third of business Online and Google Contact Center AI is Key to its Success
“Hello, Marks & Spencer. How may we help you?” As one of the biggest and best-loved retail brands in the UK, Marks & Spencer (M&S) is known for the personalized service it provides to its 30 million loyal customers. For 135 years and in 57 countries around the world, M&S has worked
